
 Login Sign Up


| |||||
 |  | ||||

| 12Stocks.com Market Intelligence |
Best Healthcare Stocks
 | "Discover best trending healthcare stocks with 12Stocks.com." |
| - Subu Vdaygiri, Founder, 12Stocks.com |
| In a hurry? Healthcare Stocks Lists: Performance Trends Table, Stock Charts
Sort Healthcare stocks: Daily, Weekly, Year-to-Date, Market Cap & Trends. Filter Healthcare stocks list by size:All Healthcare Large Mid-Range Small |
| 12Stocks.com Healthcare Stocks Performances & Trends Daily | |||||||||
|
|  The overall Smart Investing & Trading Score is 83 (0-bearish to 100-bullish) which puts Healthcare sector in short term bullish trend. The Smart Investing & Trading Score from previous trading session is 88 and a deterioration of trend continues.
| ||||||||
Here are the Smart Investing & Trading Scores of the most requested Healthcare stocks at 12Stocks.com (click stock name for detailed review):
|


| 12Stocks.com: Investing in Healthcare sector with Stocks | |
|
The following table helps investors and traders sort through current performance and trends (as measured by Smart Investing & Trading Score) of various
stocks in the Healthcare sector. Quick View: Move mouse or cursor over stock symbol (ticker) to view short-term Technical chart and over stock name to view long term chart. Click on  to add stock symbol to your watchlist and to add stock symbol to your watchlist and  to view watchlist. Click on any ticker or stock name for detailed market intelligence report for that stock. to view watchlist. Click on any ticker or stock name for detailed market intelligence report for that stock. |
12Stocks.com Performance of Stocks in Healthcare Sector
| Ticker | Stock Name | Watchlist | Category | Recent Price | Smart Investing & Trading Score | Change % | YTD Change% |
| GLSI | Greenwich LifeSciences |   | Biotechnology | 13.82 | 38 | 5.66% | 30.38% |
| MNKD | MannKind | | Biotechnology | 4.74 | 90 | 0.85% | 30.22% |
| LNTH | Lantheus | | Equipment | 80.71 | 83 | -2.61% | 30.18% |
| MEDP | Medpace | | Laboratories | 396.37 | 33 | -0.22% | 29.31% |
| GRTX | Galera | | Biotechnology | 0.19 | 25 | 0.91% | 29.30% |
| KPTI | Karyopharm | | Biotechnology | 1.12 | 15 | -2.19% | 28.90% |
| TNYA | Tenaya | | Biotechnology | 4.09 | 0 | -3.76% | 28.62% |
| EHC | Encompass Health | | Hospitals | 85.80 | 68 | -0.36% | 28.60% |
| ABUS | Arbutus Biopharma | | Biotechnology | 3.21 | 100 | 4.56% | 28.40% |
| IMNM | Immunome | | Biotechnology | 13.62 | 10 | -1.30% | 27.41% |
| RMD | ResMed | | Instruments | 218.28 | 51 | -0.21% | 26.89% |
| IOVA | Iovance Bio | | Biotechnology | 10.31 | 10 | -0.39% | 26.81% |
| KROS | Keros | | Biotechnology | 50.51 | 10 | -3.55% | 26.78% |
| CLSD | Clearside Bio | | Biotechnology | 1.48 | 64 | 11.28% | 26.50% |
| APLT | Applied | | Biotechnology | 4.23 | 18 | 0.71% | 26.27% |
| PASG | Passage Bio | | Biotechnology | 1.27 | 5 | -2.67% | 26.24% |
| MTD | Mettler-Toledo | | Instruments | 1521.29 | 68 | 0.20% | 25.42% |
| WVE | Wave Life | | Biotechnology | 6.32 | 100 | -0.94% | 25.15% |
| UTHR | United | | Biotechnology | 275.07 | 90 | 0.15% | 25.09% |
| EOLS | Evolus | | Pharmaceutical | 13.16 | 30 | -1.90% | 25.02% |
| ARDX | Ardelyx | | Biotechnology | 7.74 | 25 | -2.40% | 24.84% |
| GMED | Globus | | Equipment | 66.50 | 90 | 0.36% | 24.79% |
| CRVS | Corvus | | Biotechnology | 2.18 | 64 | -4.39% | 23.86% |
| HALO | Halozyme | | Biotechnology | 45.55 | 83 | 1.29% | 23.24% |
| ITGR | Integer | | Equipment | 121.31 | 100 | 0.87% | 22.44% |
| For chart view version of above stock list: Chart View ➞ 0 - 25 , 25 - 50 , 50 - 75 , 75 - 100 , 100 - 125 , 125 - 150 , 150 - 175 , 175 - 200 , 200 - 225 , 225 - 250 , 250 - 275 , 275 - 300 , 300 - 325 , 325 - 350 , 350 - 375 , 375 - 400 , 400 - 425 , 425 - 450 , 450 - 475 , 475 - 500 , 500 - 525 , 525 - 550 , 550 - 575 , 575 - 600 , 600 - 625 , 625 - 650 , 650 - 675 , 675 - 700 , 700 - 725 | ||
 | Click To Change The Sort Order: By Market Cap or Company Size Performance: Year-to-date, Week and Day |  |
|
Get the most comprehensive stock market coverage daily at 12Stocks.com ➞ Best Stocks Today ➞ Best Stocks Weekly ➞ Best Stocks Year-to-Date ➞ Best Stocks Trends ➞  Best Stocks Today 12Stocks.com Best Nasdaq Stocks ➞ Best S&P 500 Stocks ➞ Best Tech Stocks ➞ Best Biotech Stocks ➞ |
| Detailed Overview of Healthcare Stocks |
| Healthcare Technical Overview, Leaders & Laggards, Top Healthcare ETF Funds & Detailed Healthcare Stocks List, Charts, Trends & More |
| Healthcare Sector: Technical Analysis, Trends & YTD Performance | |
| Healthcare sector is composed of stocks
from pharmaceutical, biotech, diagnostics labs, insurance providers
and healthcare services. Healthcare sector, as represented by XLV, an exchange-traded fund [ETF] that holds basket of Healthcare stocks (e.g, Merck, Amgen) is up by 7.24% and is currently underperforming the overall market by -3.67% year-to-date. Below is a quick view of Technical charts and trends: |
|
 XLV Weekly Chart |
|
| Long Term Trend: Very Good | |
| Medium Term Trend: Very Good | |
 XLV Daily Chart |
|
| Short Term Trend: Not Good | |
| Overall Trend Score: 83 | |
| YTD Performance: 7.24% | |
| **Trend Scores & Views Are Only For Educational Purposes And Not For Investing | |
| 12Stocks.com: Top Performing Healthcare Sector Stocks | ||||||||||||||||||||||||||||||||||||||||||||||||
 The top performing Healthcare sector stocks year to date are
Now, more recently, over last week, the top performing Healthcare sector stocks on the move are


|
||||||||||||||||||||||||||||||||||||||||||||||||
| 12Stocks.com: Investing in Healthcare Sector using Exchange Traded Funds | |
|
The following table shows list of key exchange traded funds (ETF) that
help investors track Healthcare Index. For detailed view, check out our ETF Funds section of our website. Quick View: Move mouse or cursor over ETF symbol (ticker) to view short-term Technical chart and over ETF name to view long term chart. Click on ticker or stock name for detailed view. Click on to add stock symbol to your watchlist and to view watchlist. |
12Stocks.com List of ETFs that track Healthcare Index
| Ticker | ETF Name | Watchlist | Recent Price | Smart Investing & Trading Score | Change % | Week % | Year-to-date % |
| XLV | Health Care | | 146.25 | 83 | 0.17 | -0.04 | 7.24% |
| XBI | Biotech | | 91.57 | 45 | -0.76 | 0.43 | 2.55% |
| IBB | Biotechnology | | 136.86 | 70 | -0.47 | 0.12 | 0.74% |
| BBH | Biotech | | 168.04 | 83 | -0.33 | 0.03 | 1.65% |
| VHT | Health Care | | 266.91 | 67 | 0.02 | -0.07 | 6.47% |
| IYH | Healthcare | | 61.39 | 62 | 0.24 | 0.08 | 7.24% |
| IHF | Healthcare Providers | | 53.71 | 76 | 0.32 | -0.37 | 2.29% |
| IHI | Medical Devices | | 56.36 | 30 | -0.16 | -0.58 | 4.43% |
| BIB | Biotechnology | | 57.88 | 63 | -0.02 | 1.62 | 1.45% |
| BIS | Short Biotech | | 17.32 | 18 | -0.06 | -1.53 | -4.15% |
| XHE | Health Care Equipment | | 86.97 | 61 | -0.61 | -0.55 | 3.22% |
| CURE | Healthcare Bull 3X | | 118.20 | 70 | -0.04 | -0.76 | 16.18% |
| LABU | Biotech Bull 3X | | 113.12 | 32 | -2.31 | 1.19 | -7.26% |
| LABD | Biotech Bear 3X | | 7.83 | 61 | 2.09 | -1.51 | -19.2% |
| PSCH | SmallCap Health Care | | 43.44 | 56 | -0.02 | 0.1 | 1.5% |
| XHS | Health Care Services | | 91.28 | 73 | -0.65 | -0.29 | 2.62% |
| PTH | DWA Healthcare Momentum | | 43.07 | 35 | -0.09 | 1.03 | 10.04% |
| BTEC | Principal Healthcare Innovators | | 36.83 | 28 | -0.30 | 0.96 | 1.38% |
| RXL | Health Care | | 103.09 | 83 | 0.19 | 0.32 | 12.79% |
| RXD | Short Health Care | | 10.57 | 25 | 0.00 | 0.07 | -11.36% |
| 12Stocks.com: Charts, Trends, Fundamental Data and Performances of Healthcare Stocks | |
|
We now take in-depth look at all Healthcare stocks including charts, multi-period performances and overall trends (as measured by Smart Investing & Trading Score). One can sort Healthcare stocks (click link to choose) by Daily, Weekly and by Year-to-Date performances. Also, one can sort by size of the company or by market capitalization. |
| Select Your Default Chart Type: | |||||
| |||||
| Click on stock symbol or name for detailed view. Click on to add stock symbol to your watchlist and to view watchlist. Quick View: Move mouse or cursor over "Daily" to quickly view daily Technical stock chart and over "Weekly" to view weekly Technical stock chart. | |||||

 | GLSI Greenwich LifeSciences, Inc. |
| Sector: Health Care | |
| SubSector: Biotechnology | |
| MarketCap: 86487 Millions | |
| Recent Price: 13.82 Smart Investing & Trading Score: 38 | |
| Day Percent Change: 5.66% Day Change: 0.74 | |
| Week Change: -1.14% Year-to-date Change: 30.4% | |
| GLSI Links: Profile News Message Board | |
| Charts:- Daily , Weekly | |
| Add GLSI to Watchlist: View: Get Complete GLSI Trend Analysis ➞ | |
 | MNKD MannKind Corporation |
| Sector: Health Care | |
| SubSector: Biotechnology | |
| MarketCap: 250.885 Millions | |
| Recent Price: 4.74 Smart Investing & Trading Score: 90 | |
| Day Percent Change: 0.85% Day Change: 0.04 | |
| Week Change: 3.27% Year-to-date Change: 30.2% | |
| MNKD Links: Profile News Message Board | |
| Charts:- Daily , Weekly | |
| Add MNKD to Watchlist: View: Get Complete MNKD Trend Analysis ➞ | |
 | LNTH Lantheus Holdings, Inc. |
| Sector: Health Care | |
| SubSector: Medical Appliances & Equipment | |
| MarketCap: 467.18 Millions | |
| Recent Price: 80.71 Smart Investing & Trading Score: 83 | |
| Day Percent Change: -2.61% Day Change: -2.16 | |
| Week Change: 1.31% Year-to-date Change: 30.2% | |
| LNTH Links: Profile News Message Board | |
| Charts:- Daily , Weekly | |
| Add LNTH to Watchlist: View: Get Complete LNTH Trend Analysis ➞ | |
 | MEDP Medpace Holdings, Inc. |
| Sector: Health Care | |
| SubSector: Medical Laboratories & Research | |
| MarketCap: 2888.7 Millions | |
| Recent Price: 396.37 Smart Investing & Trading Score: 33 | |
| Day Percent Change: -0.22% Day Change: -0.88 | |
| Week Change: 0.78% Year-to-date Change: 29.3% | |
| MEDP Links: Profile News Message Board | |
| Charts:- Daily , Weekly | |
| Add MEDP to Watchlist: View: Get Complete MEDP Trend Analysis ➞ | |
 | GRTX Galera Therapeutics, Inc. |
| Sector: Health Care | |
| SubSector: Biotechnology | |
| MarketCap: 277.585 Millions | |
| Recent Price: 0.19 Smart Investing & Trading Score: 25 | |
| Day Percent Change: 0.91% Day Change: 0.00 | |
| Week Change: -4.08% Year-to-date Change: 29.3% | |
| GRTX Links: Profile News Message Board | |
| Charts:- Daily , Weekly | |
| Add GRTX to Watchlist: View: Get Complete GRTX Trend Analysis ➞ | |
 | KPTI Karyopharm Therapeutics Inc. |
| Sector: Health Care | |
| SubSector: Biotechnology | |
| MarketCap: 1471.85 Millions | |
| Recent Price: 1.12 Smart Investing & Trading Score: 15 | |
| Day Percent Change: -2.19% Day Change: -0.02 | |
| Week Change: -3.04% Year-to-date Change: 28.9% | |
| KPTI Links: Profile News Message Board | |
| Charts:- Daily , Weekly | |
| Add KPTI to Watchlist: View: Get Complete KPTI Trend Analysis ➞ | |
 | TNYA Tenaya Therapeutics, Inc. |
| Sector: Health Care | |
| SubSector: Biotechnology | |
| MarketCap: 395 Millions | |
| Recent Price: 4.09 Smart Investing & Trading Score: 0 | |
| Day Percent Change: -3.76% Day Change: -0.16 | |
| Week Change: -12.23% Year-to-date Change: 28.6% | |
| TNYA Links: Profile News Message Board | |
| Charts:- Daily , Weekly | |
| Add TNYA to Watchlist: View: Get Complete TNYA Trend Analysis ➞ | |
 | EHC Encompass Health Corporation |
| Sector: Health Care | |
| SubSector: Hospitals | |
| MarketCap: 5384.06 Millions | |
| Recent Price: 85.80 Smart Investing & Trading Score: 68 | |
| Day Percent Change: -0.36% Day Change: -0.31 | |
| Week Change: 0.41% Year-to-date Change: 28.6% | |
| EHC Links: Profile News Message Board | |
| Charts:- Daily , Weekly | |
| Add EHC to Watchlist: View: Get Complete EHC Trend Analysis ➞ | |
 | ABUS Arbutus Biopharma Corporation |
| Sector: Health Care | |
| SubSector: Biotechnology | |
| MarketCap: 110.885 Millions | |
| Recent Price: 3.21 Smart Investing & Trading Score: 100 | |
| Day Percent Change: 4.56% Day Change: 0.14 | |
| Week Change: 7.54% Year-to-date Change: 28.4% | |
| ABUS Links: Profile News Message Board | |
| Charts:- Daily , Weekly | |
| Add ABUS to Watchlist: View: Get Complete ABUS Trend Analysis ➞ | |
 | IMNM Immunome, Inc. |
| Sector: Health Care | |
| SubSector: Biotechnology | |
| MarketCap: 12487 Millions | |
| Recent Price: 13.62 Smart Investing & Trading Score: 10 | |
| Day Percent Change: -1.30% Day Change: -0.18 | |
| Week Change: -1.52% Year-to-date Change: 27.4% | |
| IMNM Links: Profile News Message Board | |
| Charts:- Daily , Weekly | |
| Add IMNM to Watchlist: View: Get Complete IMNM Trend Analysis ➞ | |
 | RMD ResMed Inc. |
| Sector: Health Care | |
| SubSector: Medical Instruments & Supplies | |
| MarketCap: 18660.2 Millions | |
| Recent Price: 218.28 Smart Investing & Trading Score: 51 | |
| Day Percent Change: -0.21% Day Change: -0.46 | |
| Week Change: -0.13% Year-to-date Change: 26.9% | |
| RMD Links: Profile News Message Board | |
| Charts:- Daily , Weekly | |
| Add RMD to Watchlist: View: Get Complete RMD Trend Analysis ➞ | |
 | IOVA Iovance Biotherapeutics, Inc. |
| Sector: Health Care | |
| SubSector: Biotechnology | |
| MarketCap: 3533.35 Millions | |
| Recent Price: 10.31 Smart Investing & Trading Score: 10 | |
| Day Percent Change: -0.39% Day Change: -0.04 | |
| Week Change: 0.68% Year-to-date Change: 26.8% | |
| IOVA Links: Profile News Message Board | |
| Charts:- Daily , Weekly | |
| Add IOVA to Watchlist: View: Get Complete IOVA Trend Analysis ➞ | |
 | KROS Keros Therapeutics, Inc. |
| Sector: Health Care | |
| SubSector: Biotechnology | |
| MarketCap: 17887 Millions | |
| Recent Price: 50.51 Smart Investing & Trading Score: 10 | |
| Day Percent Change: -3.55% Day Change: -1.86 | |
| Week Change: -3.39% Year-to-date Change: 26.8% | |
| KROS Links: Profile News Message Board | |
| Charts:- Daily , Weekly | |
| Add KROS to Watchlist: View: Get Complete KROS Trend Analysis ➞ | |
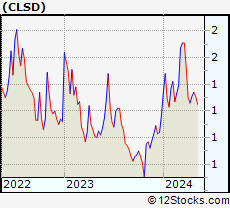 | CLSD Clearside Biomedical, Inc. |
| Sector: Health Care | |
| SubSector: Biotechnology | |
| MarketCap: 73.2785 Millions | |
| Recent Price: 1.48 Smart Investing & Trading Score: 64 | |
| Day Percent Change: 11.28% Day Change: 0.15 | |
| Week Change: 12.12% Year-to-date Change: 26.5% | |
| CLSD Links: Profile News Message Board | |
| Charts:- Daily , Weekly | |
| Add CLSD to Watchlist: View: Get Complete CLSD Trend Analysis ➞ | |
 | APLT Applied Therapeutics, Inc. |
| Sector: Health Care | |
| SubSector: Biotechnology | |
| MarketCap: 641.285 Millions | |
| Recent Price: 4.23 Smart Investing & Trading Score: 18 | |
| Day Percent Change: 0.71% Day Change: 0.03 | |
| Week Change: 0.95% Year-to-date Change: 26.3% | |
| APLT Links: Profile News Message Board | |
| Charts:- Daily , Weekly | |
| Add APLT to Watchlist: View: Get Complete APLT Trend Analysis ➞ | |
 | PASG Passage Bio, Inc. |
| Sector: Health Care | |
| SubSector: Biotechnology | |
| MarketCap: 12787 Millions | |
| Recent Price: 1.27 Smart Investing & Trading Score: 5 | |
| Day Percent Change: -2.67% Day Change: -0.04 | |
| Week Change: -3.41% Year-to-date Change: 26.2% | |
| PASG Links: Profile News Message Board | |
| Charts:- Daily , Weekly | |
| Add PASG to Watchlist: View: Get Complete PASG Trend Analysis ➞ | |
 | MTD Mettler-Toledo International Inc. |
| Sector: Health Care | |
| SubSector: Medical Instruments & Supplies | |
| MarketCap: 15973.1 Millions | |
| Recent Price: 1521.29 Smart Investing & Trading Score: 68 | |
| Day Percent Change: 0.20% Day Change: 3.00 | |
| Week Change: -0.1% Year-to-date Change: 25.4% | |
| MTD Links: Profile News Message Board | |
| Charts:- Daily , Weekly | |
| Add MTD to Watchlist: View: Get Complete MTD Trend Analysis ➞ | |
 | WVE Wave Life Sciences Ltd. |
| Sector: Health Care | |
| SubSector: Biotechnology | |
| MarketCap: 452.785 Millions | |
| Recent Price: 6.32 Smart Investing & Trading Score: 100 | |
| Day Percent Change: -0.94% Day Change: -0.06 | |
| Week Change: 0.96% Year-to-date Change: 25.2% | |
| WVE Links: Profile News Message Board | |
| Charts:- Daily , Weekly | |
| Add WVE to Watchlist: View: Get Complete WVE Trend Analysis ➞ | |
 | UTHR United Therapeutics Corporation |
| Sector: Health Care | |
| SubSector: Biotechnology | |
| MarketCap: 3980.75 Millions | |
| Recent Price: 275.07 Smart Investing & Trading Score: 90 | |
| Day Percent Change: 0.15% Day Change: 0.40 | |
| Week Change: 0.3% Year-to-date Change: 25.1% | |
| UTHR Links: Profile News Message Board | |
| Charts:- Daily , Weekly | |
| Add UTHR to Watchlist: View: Get Complete UTHR Trend Analysis ➞ | |
 | EOLS Evolus, Inc. |
| Sector: Health Care | |
| SubSector: Drugs - Generic | |
| MarketCap: 145.885 Millions | |
| Recent Price: 13.16 Smart Investing & Trading Score: 30 | |
| Day Percent Change: -1.90% Day Change: -0.26 | |
| Week Change: -3.13% Year-to-date Change: 25.0% | |
| EOLS Links: Profile News Message Board | |
| Charts:- Daily , Weekly | |
| Add EOLS to Watchlist: View: Get Complete EOLS Trend Analysis ➞ | |
 | ARDX Ardelyx, Inc. |
| Sector: Health Care | |
| SubSector: Biotechnology | |
| MarketCap: 541.985 Millions | |
| Recent Price: 7.74 Smart Investing & Trading Score: 25 | |
| Day Percent Change: -2.40% Day Change: -0.19 | |
| Week Change: -0.9% Year-to-date Change: 24.8% | |
| ARDX Links: Profile News Message Board | |
| Charts:- Daily , Weekly | |
| Add ARDX to Watchlist: View: Get Complete ARDX Trend Analysis ➞ | |
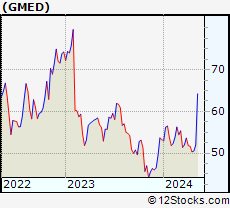 | GMED Globus Medical, Inc. |
| Sector: Health Care | |
| SubSector: Medical Appliances & Equipment | |
| MarketCap: 3965.5 Millions | |
| Recent Price: 66.50 Smart Investing & Trading Score: 90 | |
| Day Percent Change: 0.36% Day Change: 0.24 | |
| Week Change: 3.26% Year-to-date Change: 24.8% | |
| GMED Links: Profile News Message Board | |
| Charts:- Daily , Weekly | |
| Add GMED to Watchlist: View: Get Complete GMED Trend Analysis ➞ | |
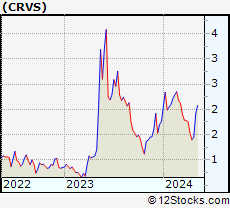 | CRVS Corvus Pharmaceuticals, Inc. |
| Sector: Health Care | |
| SubSector: Biotechnology | |
| MarketCap: 73.7785 Millions | |
| Recent Price: 2.18 Smart Investing & Trading Score: 64 | |
| Day Percent Change: -4.39% Day Change: -0.10 | |
| Week Change: -4.8% Year-to-date Change: 23.9% | |
| CRVS Links: Profile News Message Board | |
| Charts:- Daily , Weekly | |
| Add CRVS to Watchlist: View: Get Complete CRVS Trend Analysis ➞ | |
 | HALO Halozyme Therapeutics, Inc. |
| Sector: Health Care | |
| SubSector: Biotechnology | |
| MarketCap: 2383.75 Millions | |
| Recent Price: 45.55 Smart Investing & Trading Score: 83 | |
| Day Percent Change: 1.29% Day Change: 0.58 | |
| Week Change: 1.88% Year-to-date Change: 23.2% | |
| HALO Links: Profile News Message Board | |
| Charts:- Daily , Weekly | |
| Add HALO to Watchlist: View: Get Complete HALO Trend Analysis ➞ | |
 | ITGR Integer Holdings Corporation |
| Sector: Health Care | |
| SubSector: Medical Appliances & Equipment | |
| MarketCap: 1794.8 Millions | |
| Recent Price: 121.31 Smart Investing & Trading Score: 100 | |
| Day Percent Change: 0.87% Day Change: 1.05 | |
| Week Change: 0.32% Year-to-date Change: 22.4% | |
| ITGR Links: Profile News Message Board | |
| Charts:- Daily , Weekly | |
| Add ITGR to Watchlist: View: Get Complete ITGR Trend Analysis ➞ | |
| For tabular summary view of above stock list: Summary View ➞ 0 - 25 , 25 - 50 , 50 - 75 , 75 - 100 , 100 - 125 , 125 - 150 , 150 - 175 , 175 - 200 , 200 - 225 , 225 - 250 , 250 - 275 , 275 - 300 , 300 - 325 , 325 - 350 , 350 - 375 , 375 - 400 , 400 - 425 , 425 - 450 , 450 - 475 , 475 - 500 , 500 - 525 , 525 - 550 , 550 - 575 , 575 - 600 , 600 - 625 , 625 - 650 , 650 - 675 , 675 - 700 , 700 - 725 | ||
| Click To Change The Sort Order: By Market Cap or Company Size Performance: Year-to-date, Week and Day | |
| Select Chart Type: | ||
|
Best Stocks Today 12Stocks.com |
© 2024 12Stocks.com Terms & Conditions Privacy Contact Us
All Information Provided Only For Education And Not To Be Used For Investing or Trading. See Terms & Conditions


One More Thing ... Get Best Stocks Delivered Daily!
Never Ever Miss A Move With Our Top Ten Stocks Lists
Find Best Stocks In Any Market - Bull or Bear Market
Take A Peek At Our Top Ten Stocks Lists: Daily, Weekly, Year-to-Date & Top Trends
Find Best Stocks In Any Market - Bull or Bear Market
Take A Peek At Our Top Ten Stocks Lists: Daily, Weekly, Year-to-Date & Top Trends
Healthcare Stocks With Best Up Trends [0-bearish to 100-bullish]: Third Harmonic[100], Concord [100], Brainstorm Cell[100], Arbutus Biopharma[100], Tandem Diabetes[100], PureTech Health[100], Genfit SA[100], Heron [100], Integer [100], Vericel [100], Boston Scientific[100]
Best Healthcare Stocks Year-to-Date:
Pieris [6042.86%], Precision BioSciences[3472.6%], Avenue [2266.46%], Inovio [2052.94%], Assembly Biosciences[1717.46%], Aurora Cannabis[1398.32%], Agenus [1240.74%], NuCana [1103.52%], Adverum Biotechnologies[949.42%], Affimed N.V[716%], Burning Rock[690.76%] Best Healthcare Stocks This Week:
DURECT [38.14%], Genelux [31.78%], Concord [29.19%], iBio [27.37%], Nobilis Health[26.23%], Pulse Biosciences[24.58%], Scilex Holding[22.22%], Dyne [17.81%], PTC [17.45%], Accelerate Diagnostics[17.35%], CareMax [16.61%] Best Healthcare Stocks Daily:
DURECT [25.00%], Accelerate Diagnostics[17.96%], CareMax [17.83%], RAPT [15.00%], Pulse Biosciences[13.40%], Genelux [11.86%], Relay [11.58%], Sol-Gel Technologies[10.62%], iBio [9.30%], Vaxxinity [9.30%], Third Harmonic[8.54%]