
 Login Sign Up


| |||||
 |  | ||||

| 12Stocks.com Market Intelligence |
Best Healthcare Stocks
 | "Discover best trending healthcare stocks with 12Stocks.com." |
| - Subu Vdaygiri, Founder, 12Stocks.com |
| In a hurry? Healthcare Stocks Lists: Performance Trends Table, Stock Charts
Sort Healthcare stocks: Daily, Weekly, Year-to-Date, Market Cap & Trends. Filter Healthcare stocks list by size:All Healthcare Large Mid-Range Small |
| 12Stocks.com Healthcare Stocks Performances & Trends Daily | |||||||||
|
|  The overall Smart Investing & Trading Score is 83 (0-bearish to 100-bullish) which puts Healthcare sector in short term bullish trend. The Smart Investing & Trading Score from previous trading session is 88 and a deterioration of trend continues.
| ||||||||
Here are the Smart Investing & Trading Scores of the most requested Healthcare stocks at 12Stocks.com (click stock name for detailed review):
|


| 12Stocks.com: Investing in Healthcare sector with Stocks | |
|
The following table helps investors and traders sort through current performance and trends (as measured by Smart Investing & Trading Score) of various
stocks in the Healthcare sector. Quick View: Move mouse or cursor over stock symbol (ticker) to view short-term Technical chart and over stock name to view long term chart. Click on  to add stock symbol to your watchlist and to add stock symbol to your watchlist and  to view watchlist. Click on any ticker or stock name for detailed market intelligence report for that stock. to view watchlist. Click on any ticker or stock name for detailed market intelligence report for that stock. |
12Stocks.com Performance of Stocks in Healthcare Sector
| Ticker | Stock Name | Watchlist | Category | Recent Price | Smart Investing & Trading Score | Change % | YTD Change% |
| STXS | Stereotaxis |   | Instruments | 2.11 | 10 | 0.72% | 20.29% |
| MRK | Merck | | Pharmaceutical | 131.07 | 93 | 0.06% | 20.23% |
| AVIR | Atea | | Biotechnology | 3.65 | 40 | 1.39% | 19.67% |
| BCYC | Bicycle | | Biotechnology | 21.63 | 15 | -0.37% | 19.63% |
| ADUS | Addus HomeCare | | Home Care | 111.00 | 76 | 0.31% | 19.55% |
| VRCA | Verrica | | Biotechnology | 8.67 | 61 | -0.34% | 18.44% |
| WRBY | Warby Parker | | Instruments | 16.70 | 95 | 0.06% | 18.40% |
| SCYX | SCYNEXIS | | Pharmaceutical | 2.64 | 93 | 0.76% | 18.39% |
| EW | Edwards Lifesciences | | Equipment | 90.26 | 88 | 0.53% | 18.37% |
| MRSN | Mersana | | Biotechnology | 2.75 | 35 | -0.90% | 18.32% |
| HCA | HCA | | Hospitals | 320.00 | 53 | -1.55% | 18.22% |
| PHAT | Phathom | | Biotechnology | 10.79 | 100 | -0.92% | 18.18% |
| PCVX | Vaxcyte | | Biotechnology | 74.03 | 95 | -2.51% | 17.93% |
| ISRG | Intuitive Surgical | | Instruments | 397.57 | 90 | -0.61% | 17.85% |
| EDAP | EDAP TMS | | Equipment | 6.22 | 10 | -0.16% | 17.80% |
| BVS | Bioventus | | Medical Devices | 6.23 | 68 | 0.00% | 17.77% |
| UHS | Universal Health | | Hospitals | 179.45 | 78 | -1.08% | 17.72% |
| RPHM | Reneo | | Biotechnology | 1.91 | 100 | 0.26% | 17.59% |
| AZN | AstraZeneca | | Pharmaceutical | 79.17 | 95 | 2.67% | 17.55% |
| CYH | Community Health | | Hospitals | 3.67 | 75 | 0.82% | 17.25% |
| BKD | Brookdale Senior | | Long-Term | 6.82 | 26 | -0.58% | 17.18% |
| CLSD | Clearside Bio | | Biotechnology | 1.37 | 64 | 3.01% | 17.09% |
| ANAB | AnaptysBio | | Biotechnology | 24.68 | 27 | -1.30% | 15.24% |
| LNSR | LENSAR | | Medical Devices | 4.03 | 42 | 0.00% | 14.81% |
| IDYA | IDEAYA Biosciences | | Biotechnology | 40.62 | 17 | 0.74% | 14.17% |
| For chart view version of above stock list: Chart View ➞ 0 - 25 , 25 - 50 , 50 - 75 , 75 - 100 , 100 - 125 , 125 - 150 , 150 - 175 , 175 - 200 , 200 - 225 , 225 - 250 , 250 - 275 , 275 - 300 , 300 - 325 , 325 - 350 , 350 - 375 , 375 - 400 , 400 - 425 , 425 - 450 , 450 - 475 , 475 - 500 , 500 - 525 , 525 - 550 , 550 - 575 , 575 - 600 , 600 - 625 , 625 - 650 , 650 - 675 | ||
 | Click To Change The Sort Order: By Market Cap or Company Size Performance: Year-to-date, Week and Day |  |
|
Get the most comprehensive stock market coverage daily at 12Stocks.com ➞ Best Stocks Today ➞ Best Stocks Weekly ➞ Best Stocks Year-to-Date ➞ Best Stocks Trends ➞  Best Stocks Today 12Stocks.com Best Nasdaq Stocks ➞ Best S&P 500 Stocks ➞ Best Tech Stocks ➞ Best Biotech Stocks ➞ |
| Detailed Overview of Healthcare Stocks |
| Healthcare Technical Overview, Leaders & Laggards, Top Healthcare ETF Funds & Detailed Healthcare Stocks List, Charts, Trends & More |
| Healthcare Sector: Technical Analysis, Trends & YTD Performance | |
| Healthcare sector is composed of stocks
from pharmaceutical, biotech, diagnostics labs, insurance providers
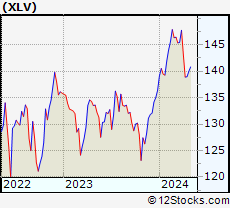
and healthcare services. Healthcare sector, as represented by XLV, an exchange-traded fund [ETF] that holds basket of Healthcare stocks (e.g, Merck, Amgen) is up by 7.11% and is currently underperforming the overall market by -3.61% year-to-date. Below is a quick view of Technical charts and trends: |
|
 XLV Weekly Chart |
|
| Long Term Trend: Very Good | |
| Medium Term Trend: Very Good | |
 XLV Daily Chart |
|
| Short Term Trend: Good | |
| Overall Trend Score: 83 | |
| YTD Performance: 7.11% | |
| **Trend Scores & Views Are Only For Educational Purposes And Not For Investing | |
| 12Stocks.com: Top Performing Healthcare Sector Stocks | ||||||||||||||||||||||||||||||||||||||||||||||||
 The top performing Healthcare sector stocks year to date are
Now, more recently, over last week, the top performing Healthcare sector stocks on the move are


|
||||||||||||||||||||||||||||||||||||||||||||||||
| 12Stocks.com: Investing in Healthcare Sector using Exchange Traded Funds | |
|
The following table shows list of key exchange traded funds (ETF) that
help investors track Healthcare Index. For detailed view, check out our ETF Funds section of our website. Quick View: Move mouse or cursor over ETF symbol (ticker) to view short-term Technical chart and over ETF name to view long term chart. Click on ticker or stock name for detailed view. Click on to add stock symbol to your watchlist and to view watchlist. |
12Stocks.com List of ETFs that track Healthcare Index
| Ticker | ETF Name | Watchlist | Recent Price | Smart Investing & Trading Score | Change % | Week % | Year-to-date % |
| XLV | Health Care | | 146.08 | 83 | 0.05 | -0.16 | 7.11% |
| XBI | Biotech | | 91.72 | 38 | -0.60 | 0.59 | 2.72% |
| IBB | Biotechnology | | 136.39 | 70 | -0.81 | -0.22 | 0.4% |
| BBH | Biotech | | 168.05 | 83 | -0.32 | 0.04 | 1.66% |
| IHF | Healthcare Providers | | 53.57 | 76 | 0.06 | -0.63 | 2.02% |
| IHI | Medical Devices | | 56.35 | 38 | -0.17 | -0.59 | 4.42% |
| BIB | Biotechnology | | 57.88 | 60 | -0.02 | 1.62 | 1.45% |
| CURE | Healthcare Bull 3X | | 118.58 | 61 | 0.28 | -0.44 | 16.55% |
| LABU | Biotech Bull 3X | | 113.83 | 30 | -1.70 | 1.82 | -6.67% |
| LABD | Biotech Bear 3X | | 7.82 | 61 | 1.96 | -1.64 | -19.3% |
| RXL | Health Care | | 103.09 | 90 | 0.19 | 0.32 | 12.79% |
| 12Stocks.com: Charts, Trends, Fundamental Data and Performances of Healthcare Stocks | |
|
We now take in-depth look at all Healthcare stocks including charts, multi-period performances and overall trends (as measured by Smart Investing & Trading Score). One can sort Healthcare stocks (click link to choose) by Daily, Weekly and by Year-to-Date performances. Also, one can sort by size of the company or by market capitalization. |
| Select Your Default Chart Type: | |||||
| |||||
| Click on stock symbol or name for detailed view. Click on to add stock symbol to your watchlist and to view watchlist. Quick View: Move mouse or cursor over "Daily" to quickly view daily Technical stock chart and over "Weekly" to view weekly Technical stock chart. | |||||

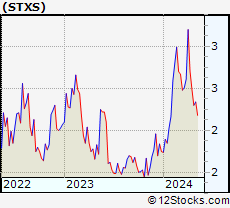 | STXS Stereotaxis, Inc. |
| Sector: Health Care | |
| SubSector: Medical Instruments & Supplies | |
| MarketCap: 232.26 Millions | |
| Recent Price: 2.11 Smart Investing & Trading Score: 10 | |
| Day Percent Change: 0.72% Day Change: 0.02 | |
| Week Change: 0.24% Year-to-date Change: 20.3% | |
| STXS Links: Profile News Message Board | |
| Charts:- Daily , Weekly | |
| Add STXS to Watchlist: View: Get Complete STXS Trend Analysis ➞ | |
 | MRK Merck & Co., Inc. |
| Sector: Health Care | |
| SubSector: Drug Manufacturers - Major | |
| MarketCap: 192657 Millions | |
| Recent Price: 131.07 Smart Investing & Trading Score: 93 | |
| Day Percent Change: 0.06% Day Change: 0.08 | |
| Week Change: -0.09% Year-to-date Change: 20.2% | |
| MRK Links: Profile News Message Board | |
| Charts:- Daily , Weekly | |
| Add MRK to Watchlist: View: Get Complete MRK Trend Analysis ➞ | |
 | AVIR Atea Pharmaceuticals, Inc. |
| Sector: Health Care | |
| SubSector: Biotechnology | |
| MarketCap: 22587 Millions | |
| Recent Price: 3.65 Smart Investing & Trading Score: 40 | |
| Day Percent Change: 1.39% Day Change: 0.05 | |
| Week Change: 0% Year-to-date Change: 19.7% | |
| AVIR Links: Profile News Message Board | |
| Charts:- Daily , Weekly | |
| Add AVIR to Watchlist: View: Get Complete AVIR Trend Analysis ➞ | |
 | BCYC Bicycle Therapeutics plc |
| Sector: Health Care | |
| SubSector: Biotechnology | |
| MarketCap: 214.485 Millions | |
| Recent Price: 21.63 Smart Investing & Trading Score: 15 | |
| Day Percent Change: -0.37% Day Change: -0.08 | |
| Week Change: 1.26% Year-to-date Change: 19.6% | |
| BCYC Links: Profile News Message Board | |
| Charts:- Daily , Weekly | |
| Add BCYC to Watchlist: View: Get Complete BCYC Trend Analysis ➞ | |
 | ADUS Addus HomeCare Corporation |
| Sector: Health Care | |
| SubSector: Home Health Care | |
| MarketCap: 994.795 Millions | |
| Recent Price: 111.00 Smart Investing & Trading Score: 76 | |
| Day Percent Change: 0.31% Day Change: 0.34 | |
| Week Change: 0.31% Year-to-date Change: 19.6% | |
| ADUS Links: Profile News Message Board | |
| Charts:- Daily , Weekly | |
| Add ADUS to Watchlist: View: Get Complete ADUS Trend Analysis ➞ | |
 | VRCA Verrica Pharmaceuticals Inc. |
| Sector: Health Care | |
| SubSector: Biotechnology | |
| MarketCap: 289.585 Millions | |
| Recent Price: 8.67 Smart Investing & Trading Score: 61 | |
| Day Percent Change: -0.34% Day Change: -0.03 | |
| Week Change: 0% Year-to-date Change: 18.4% | |
| VRCA Links: Profile News Message Board | |
| Charts:- Daily , Weekly | |
| Add VRCA to Watchlist: View: Get Complete VRCA Trend Analysis ➞ | |
 | WRBY Warby Parker Inc. |
| Sector: Health Care | |
| SubSector: Medical Instruments & Supplies | |
| MarketCap: 1380 Millions | |
| Recent Price: 16.70 Smart Investing & Trading Score: 95 | |
| Day Percent Change: 0.06% Day Change: 0.01 | |
| Week Change: 1.03% Year-to-date Change: 18.4% | |
| WRBY Links: Profile News Message Board | |
| Charts:- Daily , Weekly | |
| Add WRBY to Watchlist: View: Get Complete WRBY Trend Analysis ➞ | |
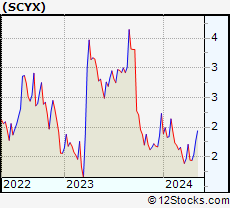 | SCYX SCYNEXIS, Inc. |
| Sector: Health Care | |
| SubSector: Drugs - Generic | |
| MarketCap: 77.4185 Millions | |
| Recent Price: 2.64 Smart Investing & Trading Score: 93 | |
| Day Percent Change: 0.76% Day Change: 0.02 | |
| Week Change: -0.94% Year-to-date Change: 18.4% | |
| SCYX Links: Profile News Message Board | |
| Charts:- Daily , Weekly | |
| Add SCYX to Watchlist: View: Get Complete SCYX Trend Analysis ➞ | |
 | EW Edwards Lifesciences Corporation |
| Sector: Health Care | |
| SubSector: Medical Appliances & Equipment | |
| MarketCap: 36735.5 Millions | |
| Recent Price: 90.26 Smart Investing & Trading Score: 88 | |
| Day Percent Change: 0.53% Day Change: 0.48 | |
| Week Change: 1.26% Year-to-date Change: 18.4% | |
| EW Links: Profile News Message Board | |
| Charts:- Daily , Weekly | |
| Add EW to Watchlist: View: Get Complete EW Trend Analysis ➞ | |
 | MRSN Mersana Therapeutics, Inc. |
| Sector: Health Care | |
| SubSector: Biotechnology | |
| MarketCap: 224.385 Millions | |
| Recent Price: 2.75 Smart Investing & Trading Score: 35 | |
| Day Percent Change: -0.90% Day Change: -0.02 | |
| Week Change: 0.55% Year-to-date Change: 18.3% | |
| MRSN Links: Profile News Message Board | |
| Charts:- Daily , Weekly | |
| Add MRSN to Watchlist: View: Get Complete MRSN Trend Analysis ➞ | |
 | HCA HCA Healthcare, Inc. |
| Sector: Health Care | |
| SubSector: Hospitals | |
| MarketCap: 29466.6 Millions | |
| Recent Price: 320.00 Smart Investing & Trading Score: 53 | |
| Day Percent Change: -1.55% Day Change: -5.05 | |
| Week Change: -0.89% Year-to-date Change: 18.2% | |
| HCA Links: Profile News Message Board | |
| Charts:- Daily , Weekly | |
| Add HCA to Watchlist: View: Get Complete HCA Trend Analysis ➞ | |
 | PHAT Phathom Pharmaceuticals, Inc. |
| Sector: Health Care | |
| SubSector: Biotechnology | |
| MarketCap: 728.785 Millions | |
| Recent Price: 10.79 Smart Investing & Trading Score: 100 | |
| Day Percent Change: -0.92% Day Change: -0.10 | |
| Week Change: 2.37% Year-to-date Change: 18.2% | |
| PHAT Links: Profile News Message Board | |
| Charts:- Daily , Weekly | |
| Add PHAT to Watchlist: View: Get Complete PHAT Trend Analysis ➞ | |
 | PCVX Vaxcyte, Inc. |
| Sector: Health Care | |
| SubSector: Biotechnology | |
| MarketCap: 13887 Millions | |
| Recent Price: 74.03 Smart Investing & Trading Score: 95 | |
| Day Percent Change: -2.51% Day Change: -1.91 | |
| Week Change: -0.73% Year-to-date Change: 17.9% | |
| PCVX Links: Profile News Message Board | |
| Charts:- Daily , Weekly | |
| Add PCVX to Watchlist: View: Get Complete PCVX Trend Analysis ➞ | |
 | ISRG Intuitive Surgical, Inc. |
| Sector: Health Care | |
| SubSector: Medical Instruments & Supplies | |
| MarketCap: 50917.5 Millions | |
| Recent Price: 397.57 Smart Investing & Trading Score: 90 | |
| Day Percent Change: -0.61% Day Change: -2.46 | |
| Week Change: -0.31% Year-to-date Change: 17.9% | |
| ISRG Links: Profile News Message Board | |
| Charts:- Daily , Weekly | |
| Add ISRG to Watchlist: View: Get Complete ISRG Trend Analysis ➞ | |
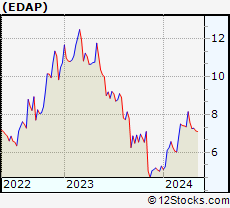 | EDAP EDAP TMS S.A. |
| Sector: Health Care | |
| SubSector: Medical Appliances & Equipment | |
| MarketCap: 64.008 Millions | |
| Recent Price: 6.22 Smart Investing & Trading Score: 10 | |
| Day Percent Change: -0.16% Day Change: -0.01 | |
| Week Change: -9.72% Year-to-date Change: 17.8% | |
| EDAP Links: Profile News Message Board | |
| Charts:- Daily , Weekly | |
| Add EDAP to Watchlist: View: Get Complete EDAP Trend Analysis ➞ | |
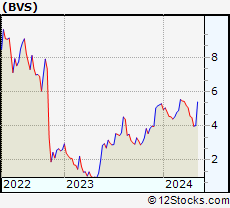 | BVS Bioventus Inc. |
| Sector: Health Care | |
| SubSector: Medical Devices | |
| MarketCap: 234 Millions | |
| Recent Price: 6.23 Smart Investing & Trading Score: 68 | |
| Day Percent Change: 0.00% Day Change: 0.00 | |
| Week Change: -2.35% Year-to-date Change: 17.8% | |
| BVS Links: Profile News Message Board | |
| Charts:- Daily , Weekly | |
| Add BVS to Watchlist: View: Get Complete BVS Trend Analysis ➞ | |
 | UHS Universal Health Services, Inc. |
| Sector: Health Care | |
| SubSector: Hospitals | |
| MarketCap: 7217.66 Millions | |
| Recent Price: 179.45 Smart Investing & Trading Score: 78 | |
| Day Percent Change: -1.08% Day Change: -1.96 | |
| Week Change: 0.98% Year-to-date Change: 17.7% | |
| UHS Links: Profile News Message Board | |
| Charts:- Daily , Weekly | |
| Add UHS to Watchlist: View: Get Complete UHS Trend Analysis ➞ | |
 | RPHM Reneo Pharmaceuticals, Inc. |
| Sector: Health Care | |
| SubSector: Biotechnology | |
| MarketCap: 233 Millions | |
| Recent Price: 1.91 Smart Investing & Trading Score: 100 | |
| Day Percent Change: 0.26% Day Change: 0.01 | |
| Week Change: 8.86% Year-to-date Change: 17.6% | |
| RPHM Links: Profile News Message Board | |
| Charts:- Daily , Weekly | |
| Add RPHM to Watchlist: View: Get Complete RPHM Trend Analysis ➞ | |
 | AZN AstraZeneca PLC |
| Sector: Health Care | |
| SubSector: Drug Manufacturers - Major | |
| MarketCap: 113154 Millions | |
| Recent Price: 79.17 Smart Investing & Trading Score: 95 | |
| Day Percent Change: 2.67% Day Change: 2.06 | |
| Week Change: 2.95% Year-to-date Change: 17.6% | |
| AZN Links: Profile News Message Board | |
| Charts:- Daily , Weekly | |
| Add AZN to Watchlist: View: Get Complete AZN Trend Analysis ➞ | |
 | CYH Community Health Systems, Inc. |
| Sector: Health Care | |
| SubSector: Hospitals | |
| MarketCap: 371.546 Millions | |
| Recent Price: 3.67 Smart Investing & Trading Score: 75 | |
| Day Percent Change: 0.82% Day Change: 0.03 | |
| Week Change: 1.66% Year-to-date Change: 17.3% | |
| CYH Links: Profile News Message Board | |
| Charts:- Daily , Weekly | |
| Add CYH to Watchlist: View: Get Complete CYH Trend Analysis ➞ | |
 | BKD Brookdale Senior Living Inc. |
| Sector: Health Care | |
| SubSector: Long-Term Care Facilities | |
| MarketCap: 420.686 Millions | |
| Recent Price: 6.82 Smart Investing & Trading Score: 26 | |
| Day Percent Change: -0.58% Day Change: -0.04 | |
| Week Change: -1.3% Year-to-date Change: 17.2% | |
| BKD Links: Profile News Message Board | |
| Charts:- Daily , Weekly | |
| Add BKD to Watchlist: View: Get Complete BKD Trend Analysis ➞ | |
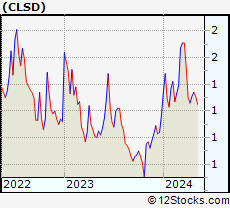 | CLSD Clearside Biomedical, Inc. |
| Sector: Health Care | |
| SubSector: Biotechnology | |
| MarketCap: 73.2785 Millions | |
| Recent Price: 1.37 Smart Investing & Trading Score: 64 | |
| Day Percent Change: 3.01% Day Change: 0.04 | |
| Week Change: 3.79% Year-to-date Change: 17.1% | |
| CLSD Links: Profile News Message Board | |
| Charts:- Daily , Weekly | |
| Add CLSD to Watchlist: View: Get Complete CLSD Trend Analysis ➞ | |
 | ANAB AnaptysBio, Inc. |
| Sector: Health Care | |
| SubSector: Biotechnology | |
| MarketCap: 405.985 Millions | |
| Recent Price: 24.68 Smart Investing & Trading Score: 27 | |
| Day Percent Change: -1.30% Day Change: -0.33 | |
| Week Change: -1.54% Year-to-date Change: 15.2% | |
| ANAB Links: Profile News Message Board | |
| Charts:- Daily , Weekly | |
| Add ANAB to Watchlist: View: Get Complete ANAB Trend Analysis ➞ | |
 | LNSR LENSAR, Inc. |
| Sector: Health Care | |
| SubSector: Medical Devices | |
| MarketCap: 91487 Millions | |
| Recent Price: 4.03 Smart Investing & Trading Score: 42 | |
| Day Percent Change: 0.00% Day Change: 0.00 | |
| Week Change: -2.18% Year-to-date Change: 14.8% | |
| LNSR Links: Profile News Message Board | |
| Charts:- Daily , Weekly | |
| Add LNSR to Watchlist: View: Get Complete LNSR Trend Analysis ➞ | |
 | IDYA IDEAYA Biosciences, Inc. |
| Sector: Health Care | |
| SubSector: Biotechnology | |
| MarketCap: 89.1785 Millions | |
| Recent Price: 40.62 Smart Investing & Trading Score: 17 | |
| Day Percent Change: 0.74% Day Change: 0.30 | |
| Week Change: 0.3% Year-to-date Change: 14.2% | |
| IDYA Links: Profile News Message Board | |
| Charts:- Daily , Weekly | |
| Add IDYA to Watchlist: View: Get Complete IDYA Trend Analysis ➞ | |
| For tabular summary view of above stock list: Summary View ➞ 0 - 25 , 25 - 50 , 50 - 75 , 75 - 100 , 100 - 125 , 125 - 150 , 150 - 175 , 175 - 200 , 200 - 225 , 225 - 250 , 250 - 275 , 275 - 300 , 300 - 325 , 325 - 350 , 350 - 375 , 375 - 400 , 400 - 425 , 425 - 450 , 450 - 475 , 475 - 500 , 500 - 525 , 525 - 550 , 550 - 575 , 575 - 600 , 600 - 625 , 625 - 650 , 650 - 675 | ||
| Click To Change The Sort Order: By Market Cap or Company Size Performance: Year-to-date, Week and Day | |
| Select Chart Type: | ||
|
Best Stocks Today 12Stocks.com |
© 2024 12Stocks.com Terms & Conditions Privacy Contact Us
All Information Provided Only For Education And Not To Be Used For Investing or Trading. See Terms & Conditions


One More Thing ... Get Best Stocks Delivered Daily!
Never Ever Miss A Move With Our Top Ten Stocks Lists
Find Best Stocks In Any Market - Bull or Bear Market
Take A Peek At Our Top Ten Stocks Lists: Daily, Weekly, Year-to-Date & Top Trends
Find Best Stocks In Any Market - Bull or Bear Market
Take A Peek At Our Top Ten Stocks Lists: Daily, Weekly, Year-to-Date & Top Trends
Healthcare Stocks With Best Up Trends [0-bearish to 100-bullish]: Concord [100], Third Harmonic[100], Wave Life[100], Arbutus Biopharma[100], Humacyte [100], Integer [100], Boston Scientific[100], Vericel [100], Reneo [100], Stoke [100], Cytosorbents [100]
Best Healthcare Stocks Year-to-Date:
Pieris [6042.86%], Precision BioSciences[3397.26%], Avenue [2266.46%], Inovio [2071.57%], Assembly Biosciences[1724.17%], Aurora Cannabis[1479.17%], Agenus [1233.49%], NuCana [1117.04%], Adverum Biotechnologies[1013.18%], Affimed N.V[725.6%], Burning Rock[706.3%] Best Healthcare Stocks This Week:
Genelux [31.78%], Concord [31.16%], Dyne [23.66%], Scilex Holding[22.22%], PTC [20.61%], Nobilis Health[19.65%], Petros [19.01%], Atara Bio[17.11%], Sutro Biopharma[17.08%], CareMax [16.61%], InnovAge Holding[16.49%] Best Healthcare Stocks Daily:
CareMax [17.83%], Accelerate Diagnostics[12.26%], Genelux [11.86%], Petros [11.60%], Concord [10.00%], Brainstorm Cell[9.95%], Vaxxinity [9.30%], Mesoblast [7.80%], Compugen [6.61%], Tandem Diabetes[6.20%], Third Harmonic[5.83%]