
 Login Sign Up


| |||||
 |  | ||||

| 12Stocks.com Market Intelligence |
Best Tech Stocks
| In a hurry? Tech Stocks Lists: Performance & Trends, Stock Charts, FANG Stocks
Sort Tech stocks: Daily, Weekly, Year-to-Date, Market Cap & Trends. Filter Tech stocks list by size:All Tech Large Mid-Range Small and MicroCap |
| 12Stocks.com Tech Stocks Performances & Trends Daily | |||||||||
|
|  The overall Smart Investing & Trading Score is 95 (0-bearish to 100-bullish) which puts Technology sector in short term bullish trend. The Smart Investing & Trading Score from previous trading session is 77 and hence an improvement of trend.
| ||||||||
Here are the Smart Investing & Trading Scores of the most requested Technology stocks at 12Stocks.com (click stock name for detailed review):
|


| 12Stocks.com: Investing in Technology sector with Stocks | |
|
The following table helps investors and traders sort through current performance and trends (as measured by Smart Investing & Trading Score) of various
stocks in the Tech sector. Quick View: Move mouse or cursor over stock symbol (ticker) to view short-term technical chart and over stock name to view long term chart. Click on  to add stock symbol to your watchlist and to add stock symbol to your watchlist and  to view watchlist. Click on any ticker or stock name for detailed market intelligence report for that stock. to view watchlist. Click on any ticker or stock name for detailed market intelligence report for that stock. |
12Stocks.com Performance of Stocks in Tech Sector
| Ticker | Stock Name | Watchlist | Category | Recent Price | Smart Investing & Trading Score | Change % | YTD Change% |
| WK | Workiva |   | Software | 84.13 | 69 | -0.24% | -17.14% |
| SHEN | Shenandoah Tele | | Telecom | 17.71 | 69 | 1.61% | -18.09% |
| CSGS | CSG Systems | | Software | 43.56 | 49 | 0.83% | -18.14% |
| ZS | Zscaler | | Security Software | 181.13 | 64 | 2.44% | -18.25% |
| S | SentinelOne | | Software - Infrastructure | 22.31 | 64 | 3.33% | -18.70% |
| MRCY | Mercury Systems | | Computer | 29.71 | 87 | 2.70% | -18.76% |
| DBX | Dropbox | | Software | 23.86 | 50 | -0.67% | -19.06% |
| SYNA | Synaptics | | Software | 92.25 | 64 | 2.99% | -19.14% |
| YELP | Yelp | | Internet | 38.23 | 48 | 1.35% | -19.24% |
| BMBL | Bumble | | Software - | 11.97 | 88 | -0.08% | -19.45% |
| PWSC | PowerSchool | | Software - | 18.95 | 57 | 3.44% | -19.84% |
| PRO | PROS | | Software | 31.02 | 32 | 0.36% | -20.03% |
| BRZE | Braze | | Software - | 42.49 | 57 | 1.46% | -20.19% |
| OMCL | Omnicell | | Healthcare Information | 29.87 | 63 | -1.35% | -20.62% |
| TDC | Teradata | | IT | 34.28 | 42 | 1.03% | -21.21% |
| INSP | Inspire Medical | | Internet | 159.75 | 10 | 0.73% | -21.47% |
| Z | Zillow | | Internet | 45.13 | 64 | 0.96% | -22.00% |
| ZG | Zillow | | Internet | 44.23 | 57 | 0.87% | -22.02% |
| DUOL | Duolingo | | Software - | 177.30 | 0 | -0.62% | -22.19% |
| XRX | Xerox | | IT | 14.15 | 64 | 1.87% | -22.80% |
| CCOI | Cogent | | Communication | 58.69 | 20 | 0.31% | -22.84% |
| AMBA | Ambarella | | Semiconductor | 46.80 | 69 | 1.30% | -23.64% |
| RDFN | Redfin | | Internet | 7.86 | 88 | -0.51% | -23.84% |
| VIAV | Viavi | | Communication | 7.66 | 49 | -0.13% | -23.93% |
| QLYS | Qualys | | Software | 148.67 | 10 | -0.71% | -24.26% |
| For chart view version of above stock list: Chart View ➞ 0 - 25 , 25 - 50 , 50 - 75 , 75 - 100 , 100 - 125 , 125 - 150 , 150 - 175 , 175 - 200 , 200 - 225 , 225 - 250 | ||
 | Click To Change The Sort Order: By Market Cap or Company Size Performance: Year-to-date, Week and Day |  |
|
Get the most comprehensive stock market coverage daily at 12Stocks.com ➞ Best Stocks Today ➞ Best Stocks Weekly ➞ Best Stocks Year-to-Date ➞ Best Stocks Trends ➞  Best Stocks Today 12Stocks.com Best Nasdaq Stocks ➞ Best S&P 500 Stocks ➞ Best Tech Stocks ➞ Best Biotech Stocks ➞ |
| Detailed Overview of Tech Stocks |
| Tech Technical Overview, Leaders & Laggards, Top Tech ETF Funds & Detailed Tech Stocks List, Charts, Trends & More |
| Tech Sector: Technical Analysis, Trends & YTD Performance | |
| Technology sector is composed of stocks
from semiconductors, software, web, social media
and services subsectors. Technology sector, as represented by XLK, an exchange-traded fund [ETF] that holds basket of tech stocks (e.g, Intel, Google) is up by 10.68% and is currently underperforming the overall market by -0.040000000000001% year-to-date. Below is a quick view of technical charts and trends: |
|
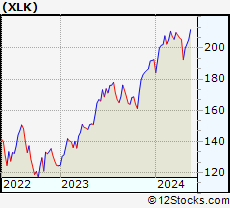
 XLK Weekly Chart |
|
| Long Term Trend: Very Good | |
| Medium Term Trend: Very Good | |
 XLK Daily Chart |
|
| Short Term Trend: Very Good | |
| Overall Trend Score: 95 | |
| YTD Performance: 10.68% | |
| **Trend Scores & Views Are Only For Educational Purposes And Not For Investing | |
| 12Stocks.com: Top Performing Technology Sector Stocks | ||||||||||||||||||||||||||||||||||||||||||||||||
 The top performing Technology sector stocks year to date are
Now, more recently, over last week, the top performing Technology sector stocks on the move are


|
||||||||||||||||||||||||||||||||||||||||||||||||
| 12Stocks.com: Investing in Tech Sector using Exchange Traded Funds | |
|
The following table shows list of key exchange traded funds (ETF) that
help investors track Tech Index. For detailed view, check out our ETF Funds section of our website. Quick View: Move mouse or cursor over ETF symbol (ticker) to view short-term technical chart and over ETF name to view long term chart. Click on ticker or stock name for detailed view. Click on to add stock symbol to your watchlist and to view watchlist. |
12Stocks.com List of ETFs that track Tech Index
| Ticker | ETF Name | Watchlist | Recent Price | Smart Investing & Trading Score | Change % | Week % | Year-to-date % |
| XLK | Technology | | 213.03 | 95 | 2.25 | 3.64 | 10.68% |
| QQQ | QQQ | | 450.36 | 95 | 0.98 | 1.88 | 9.97% |
| IYW | Technology | | 138.70 | 95 | 2.78 | 3.53 | 12.99% |
| VGT | Information Technology | | 536.12 | 95 | 2.29 | 3.85 | 10.77% |
| IXN | Global Tech | | 76.54 | 95 | 2.31 | 3.59 | 12.26% |
| IGV | Tech-Software | | 84.03 | 64 | 2.51 | 3.24 | 3.58% |
| XSD | Semiconductor | | 239.63 | 100 | 2.36 | 4.49 | 6.6% |
| TQQQ | QQQ | | 63.47 | 95 | 4.62 | 7.27 | 25.19% |
| SQQQ | Short QQQ | | 9.87 | 0 | -4.55 | -6.97 | -26.62% |
| SOXL | Semicondct Bull 3X | | 47.00 | 100 | 8.77 | 14.55 | 49.68% |
| SOXS | Semicondct Bear 3X | | 29.81 | 26 | -4.97 | -10.1 | 412.2% |
| SOXX | PHLX Semiconductor | | 230.67 | 95 | 2.83 | 4.73 | 20.12% |
| QTEC | First -100-Tech | | 191.40 | 64 | 2.61 | 3.58 | 9.08% |
| SMH | Semiconductor | | 233.90 | 100 | 3.00 | 4.75 | 33.76% |
| 12Stocks.com: Charts, Trends, Fundamental Data and Performances of Tech Stocks | |
|
We now take in-depth look at all Tech stocks including charts, multi-period performances and overall trends (as measured by Smart Investing & Trading Score). One can sort Tech stocks (click link to choose) by Daily, Weekly and by Year-to-Date performances. Also, one can sort by size of the company or by market capitalization. |
| Select Your Default Chart Type: | |||||
| |||||
| Click on stock symbol or name for detailed view. Click on to add stock symbol to your watchlist and to view watchlist. Quick View: Move mouse or cursor over "Daily" to quickly view daily technical stock chart and over "Weekly" to view weekly technical stock chart. | |||||


 | WK Workiva Inc. |
| Sector: Technology | |
| SubSector: Application Software | |
| MarketCap: 1537.42 Millions | |
| Recent Price: 84.13 Smart Investing & Trading Score: 69 | |
| Day Percent Change: -0.24% Day Change: -0.20 | |
| Week Change: 2.27% Year-to-date Change: -17.1% | |
| WK Links: Profile News Message Board | |
| Charts:- Daily , Weekly | |
| Add WK to Watchlist: View: Get Complete WK Trend Analysis ➞ | |
 | SHEN Shenandoah Telecommunications Company |
| Sector: Technology | |
| SubSector: Telecom Services - Domestic | |
| MarketCap: 2329.67 Millions | |
| Recent Price: 17.71 Smart Investing & Trading Score: 69 | |
| Day Percent Change: 1.61% Day Change: 0.28 | |
| Week Change: 4.79% Year-to-date Change: -18.1% | |
| SHEN Links: Profile News Message Board | |
| Charts:- Daily , Weekly | |
| Add SHEN to Watchlist: View: Get Complete SHEN Trend Analysis ➞ | |
 | CSGS CSG Systems International, Inc. |
| Sector: Technology | |
| SubSector: Business Software & Services | |
| MarketCap: 1336.78 Millions | |
| Recent Price: 43.56 Smart Investing & Trading Score: 49 | |
| Day Percent Change: 0.83% Day Change: 0.36 | |
| Week Change: 3.64% Year-to-date Change: -18.1% | |
| CSGS Links: Profile News Message Board | |
| Charts:- Daily , Weekly | |
| Add CSGS to Watchlist: View: Get Complete CSGS Trend Analysis ➞ | |
 | ZS Zscaler, Inc. |
| Sector: Technology | |
| SubSector: Security Software & Services | |
| MarketCap: 7532.17 Millions | |
| Recent Price: 181.13 Smart Investing & Trading Score: 64 | |
| Day Percent Change: 2.44% Day Change: 4.31 | |
| Week Change: 3.91% Year-to-date Change: -18.3% | |
| ZS Links: Profile News Message Board | |
| Charts:- Daily , Weekly | |
| Add ZS to Watchlist: View: Get Complete ZS Trend Analysis ➞ | |
 | S SentinelOne, Inc. |
| Sector: Technology | |
| SubSector: Software - Infrastructure | |
| MarketCap: 4420 Millions | |
| Recent Price: 22.31 Smart Investing & Trading Score: 64 | |
| Day Percent Change: 3.33% Day Change: 0.72 | |
| Week Change: 5.68% Year-to-date Change: -18.7% | |
| S Links: Profile News Message Board | |
| Charts:- Daily , Weekly | |
| Add S to Watchlist: View: Get Complete S Trend Analysis ➞ | |
 | MRCY Mercury Systems, Inc. |
| Sector: Technology | |
| SubSector: Computer Peripherals | |
| MarketCap: 3797.09 Millions | |
| Recent Price: 29.71 Smart Investing & Trading Score: 87 | |
| Day Percent Change: 2.70% Day Change: 0.78 | |
| Week Change: 6.15% Year-to-date Change: -18.8% | |
| MRCY Links: Profile News Message Board | |
| Charts:- Daily , Weekly | |
| Add MRCY to Watchlist: View: Get Complete MRCY Trend Analysis ➞ | |
 | DBX Dropbox, Inc. |
| Sector: Technology | |
| SubSector: Application Software | |
| MarketCap: 7588.32 Millions | |
| Recent Price: 23.86 Smart Investing & Trading Score: 50 | |
| Day Percent Change: -0.67% Day Change: -0.16 | |
| Week Change: 1.58% Year-to-date Change: -19.1% | |
| DBX Links: Profile News Message Board | |
| Charts:- Daily , Weekly | |
| Add DBX to Watchlist: View: Get Complete DBX Trend Analysis ➞ | |
 | SYNA Synaptics Incorporated |
| Sector: Technology | |
| SubSector: Application Software | |
| MarketCap: 1822.82 Millions | |
| Recent Price: 92.25 Smart Investing & Trading Score: 64 | |
| Day Percent Change: 2.99% Day Change: 2.68 | |
| Week Change: 3.72% Year-to-date Change: -19.1% | |
| SYNA Links: Profile News Message Board | |
| Charts:- Daily , Weekly | |
| Add SYNA to Watchlist: View: Get Complete SYNA Trend Analysis ➞ | |
 | YELP Yelp Inc. |
| Sector: Technology | |
| SubSector: Internet Information Providers | |
| MarketCap: 1430.1 Millions | |
| Recent Price: 38.23 Smart Investing & Trading Score: 48 | |
| Day Percent Change: 1.35% Day Change: 0.51 | |
| Week Change: 3.91% Year-to-date Change: -19.2% | |
| YELP Links: Profile News Message Board | |
| Charts:- Daily , Weekly | |
| Add YELP to Watchlist: View: Get Complete YELP Trend Analysis ➞ | |
 | BMBL Bumble Inc. |
| Sector: Technology | |
| SubSector: Software - Application | |
| MarketCap: 2290 Millions | |
| Recent Price: 11.97 Smart Investing & Trading Score: 88 | |
| Day Percent Change: -0.08% Day Change: -0.01 | |
| Week Change: 4.54% Year-to-date Change: -19.5% | |
| BMBL Links: Profile News Message Board | |
| Charts:- Daily , Weekly | |
| Add BMBL to Watchlist: View: Get Complete BMBL Trend Analysis ➞ | |
 | PWSC PowerSchool Holdings, Inc. |
| Sector: Technology | |
| SubSector: Software - Application | |
| MarketCap: 3870 Millions | |
| Recent Price: 18.95 Smart Investing & Trading Score: 57 | |
| Day Percent Change: 3.44% Day Change: 0.63 | |
| Week Change: 4.64% Year-to-date Change: -19.8% | |
| PWSC Links: Profile News Message Board | |
| Charts:- Daily , Weekly | |
| Add PWSC to Watchlist: View: Get Complete PWSC Trend Analysis ➞ | |
 | PRO PROS Holdings, Inc. |
| Sector: Technology | |
| SubSector: Application Software | |
| MarketCap: 1357.42 Millions | |
| Recent Price: 31.02 Smart Investing & Trading Score: 32 | |
| Day Percent Change: 0.36% Day Change: 0.11 | |
| Week Change: 0.88% Year-to-date Change: -20.0% | |
| PRO Links: Profile News Message Board | |
| Charts:- Daily , Weekly | |
| Add PRO to Watchlist: View: Get Complete PRO Trend Analysis ➞ | |
 | BRZE Braze, Inc. |
| Sector: Technology | |
| SubSector: Software - Application | |
| MarketCap: 4340 Millions | |
| Recent Price: 42.49 Smart Investing & Trading Score: 57 | |
| Day Percent Change: 1.46% Day Change: 0.61 | |
| Week Change: 3.06% Year-to-date Change: -20.2% | |
| BRZE Links: Profile News Message Board | |
| Charts:- Daily , Weekly | |
| Add BRZE to Watchlist: View: Get Complete BRZE Trend Analysis ➞ | |
 | OMCL Omnicell, Inc. |
| Sector: Technology | |
| SubSector: Healthcare Information Services | |
| MarketCap: 2781.05 Millions | |
| Recent Price: 29.87 Smart Investing & Trading Score: 63 | |
| Day Percent Change: -1.35% Day Change: -0.41 | |
| Week Change: -0.83% Year-to-date Change: -20.6% | |
| OMCL Links: Profile News Message Board | |
| Charts:- Daily , Weekly | |
| Add OMCL to Watchlist: View: Get Complete OMCL Trend Analysis ➞ | |
 | TDC Teradata Corporation |
| Sector: Technology | |
| SubSector: Information Technology Services | |
| MarketCap: 2229.48 Millions | |
| Recent Price: 34.28 Smart Investing & Trading Score: 42 | |
| Day Percent Change: 1.03% Day Change: 0.35 | |
| Week Change: 3.82% Year-to-date Change: -21.2% | |
| TDC Links: Profile News Message Board | |
| Charts:- Daily , Weekly | |
| Add TDC to Watchlist: View: Get Complete TDC Trend Analysis ➞ | |
 | INSP Inspire Medical Systems, Inc. |
| Sector: Technology | |
| SubSector: Internet Information Providers | |
| MarketCap: 1239.8 Millions | |
| Recent Price: 159.75 Smart Investing & Trading Score: 10 | |
| Day Percent Change: 0.73% Day Change: 1.16 | |
| Week Change: -5.57% Year-to-date Change: -21.5% | |
| INSP Links: Profile News Message Board | |
| Charts:- Daily , Weekly | |
| Add INSP to Watchlist: View: Get Complete INSP Trend Analysis ➞ | |
 | Z Zillow Group, Inc. |
| Sector: Technology | |
| SubSector: Internet Information Providers | |
| MarketCap: 3880.4 Millions | |
| Recent Price: 45.13 Smart Investing & Trading Score: 64 | |
| Day Percent Change: 0.96% Day Change: 0.43 | |
| Week Change: 6.54% Year-to-date Change: -22.0% | |
| Z Links: Profile News Message Board | |
| Charts:- Daily , Weekly | |
| Add Z to Watchlist: View: Get Complete Z Trend Analysis ➞ | |
 | ZG Zillow Group, Inc. |
| Sector: Technology | |
| SubSector: Internet Information Providers | |
| MarketCap: 6536.7 Millions | |
| Recent Price: 44.23 Smart Investing & Trading Score: 57 | |
| Day Percent Change: 0.87% Day Change: 0.38 | |
| Week Change: 5.81% Year-to-date Change: -22.0% | |
| ZG Links: Profile News Message Board | |
| Charts:- Daily , Weekly | |
| Add ZG to Watchlist: View: Get Complete ZG Trend Analysis ➞ | |
 | DUOL Duolingo, Inc. |
| Sector: Technology | |
| SubSector: Software - Application | |
| MarketCap: 6070 Millions | |
| Recent Price: 177.30 Smart Investing & Trading Score: 0 | |
| Day Percent Change: -0.62% Day Change: -1.10 | |
| Week Change: -5.75% Year-to-date Change: -22.2% | |
| DUOL Links: Profile News Message Board | |
| Charts:- Daily , Weekly | |
| Add DUOL to Watchlist: View: Get Complete DUOL Trend Analysis ➞ | |
 | XRX Xerox Holdings Corporation |
| Sector: Technology | |
| SubSector: Information Technology Services | |
| MarketCap: 4077.48 Millions | |
| Recent Price: 14.15 Smart Investing & Trading Score: 64 | |
| Day Percent Change: 1.87% Day Change: 0.26 | |
| Week Change: 4.51% Year-to-date Change: -22.8% | |
| XRX Links: Profile News Message Board | |
| Charts:- Daily , Weekly | |
| Add XRX to Watchlist: View: Get Complete XRX Trend Analysis ➞ | |
 | CCOI Cogent Communications Holdings, Inc. |
| Sector: Technology | |
| SubSector: Diversified Communication Services | |
| MarketCap: 3868.14 Millions | |
| Recent Price: 58.69 Smart Investing & Trading Score: 20 | |
| Day Percent Change: 0.31% Day Change: 0.18 | |
| Week Change: -1.51% Year-to-date Change: -22.8% | |
| CCOI Links: Profile News Message Board | |
| Charts:- Daily , Weekly | |
| Add CCOI to Watchlist: View: Get Complete CCOI Trend Analysis ➞ | |
 | AMBA Ambarella, Inc. |
| Sector: Technology | |
| SubSector: Semiconductor Equipment & Materials | |
| MarketCap: 1509.38 Millions | |
| Recent Price: 46.80 Smart Investing & Trading Score: 69 | |
| Day Percent Change: 1.30% Day Change: 0.60 | |
| Week Change: 2.07% Year-to-date Change: -23.6% | |
| AMBA Links: Profile News Message Board | |
| Charts:- Daily , Weekly | |
| Add AMBA to Watchlist: View: Get Complete AMBA Trend Analysis ➞ | |
 | RDFN Redfin Corporation |
| Sector: Technology | |
| SubSector: Internet Information Providers | |
| MarketCap: 1356.2 Millions | |
| Recent Price: 7.86 Smart Investing & Trading Score: 88 | |
| Day Percent Change: -0.51% Day Change: -0.04 | |
| Week Change: 10.08% Year-to-date Change: -23.8% | |
| RDFN Links: Profile News Message Board | |
| Charts:- Daily , Weekly | |
| Add RDFN to Watchlist: View: Get Complete RDFN Trend Analysis ➞ | |
 | VIAV Viavi Solutions Inc. |
| Sector: Technology | |
| SubSector: Communication Equipment | |
| MarketCap: 2653.29 Millions | |
| Recent Price: 7.66 Smart Investing & Trading Score: 49 | |
| Day Percent Change: -0.13% Day Change: -0.01 | |
| Week Change: 3.79% Year-to-date Change: -23.9% | |
| VIAV Links: Profile News Message Board | |
| Charts:- Daily , Weekly | |
| Add VIAV to Watchlist: View: Get Complete VIAV Trend Analysis ➞ | |
 | QLYS Qualys, Inc. |
| Sector: Technology | |
| SubSector: Application Software | |
| MarketCap: 3475.02 Millions | |
| Recent Price: 148.67 Smart Investing & Trading Score: 10 | |
| Day Percent Change: -0.71% Day Change: -1.06 | |
| Week Change: -1.09% Year-to-date Change: -24.3% | |
| QLYS Links: Profile News Message Board | |
| Charts:- Daily , Weekly | |
| Add QLYS to Watchlist: View: Get Complete QLYS Trend Analysis ➞ | |
| For tabular summary view of above stock list: Summary View ➞ 0 - 25 , 25 - 50 , 50 - 75 , 75 - 100 , 100 - 125 , 125 - 150 , 150 - 175 , 175 - 200 , 200 - 225 , 225 - 250 | ||
| Click To Change The Sort Order: By Market Cap or Company Size Performance: Year-to-date, Week and Day | |
| Select Chart Type: | ||
|
Best Stocks Today 12Stocks.com |
© 2024 12Stocks.com Terms & Conditions Privacy Contact Us
All Information Provided Only For Education And Not To Be Used For Investing or Trading. See Terms & Conditions


One More Thing ... Get Best Stocks Delivered Daily!
Never Ever Miss A Move With Our Top Ten Stocks Lists
Find Best Stocks In Any Market - Bull or Bear Market
Take A Peek At Our Top Ten Stocks Lists: Daily, Weekly, Year-to-Date & Top Trends
Find Best Stocks In Any Market - Bull or Bear Market
Take A Peek At Our Top Ten Stocks Lists: Daily, Weekly, Year-to-Date & Top Trends
Technology Stocks With Best Up Trends [0-bearish to 100-bullish]: Synchronoss [100], MicroStrategy [100], Riskified [100], Dell [100], Viomi [100], Sportradar [100], Camtek [100], Samsara [100], Immersion [100], Pure Storage[100], Himax [100]
Best Technology Stocks Year-to-Date:
MicroCloud Hologram[527.34%], Bakkt [446.19%], Uxin [404.99%], MediaCo Holding[259.15%], Super Micro[235.03%], Smith Micro[232.93%], CXApp [157.14%], SoundHound AI[148.6%], MicroStrategy [138.03%], AppLovin [111.23%], CuriosityStream [109.22%] Best Technology Stocks This Week:
Uxin [41.04%], LivePerson [40.88%], SunPower [35.22%], Tigo Energy[34.26%], on [28.3%], MicroCloud Hologram[28.24%], MicroStrategy [27.36%], Synchronoss [26.88%], Bakkt [23.78%], OptimizeRx [21.83%], monday.com [21.43%] Best Technology Stocks Daily:
OptimizeRx [25.67%], Telos [24.29%], monday.com [21.37%], Synchronoss [16.23%], MicroStrategy [15.86%], Super Micro[15.81%], Riskified [15.30%], Dell [11.21%], Shift4 Payments[11.02%], Viomi [10.67%], Sportradar [10.32%]