
 Login Sign Up


| |||||
 |  | ||||

| 12Stocks.com Market Intelligence |
Best Tech Stocks
| In a hurry? Tech Stocks Lists: Performance & Trends, Stock Charts, FANG Stocks
Sort Tech stocks: Daily, Weekly, Year-to-Date, Market Cap & Trends. Filter Tech stocks list by size:All Tech Large Mid-Range Small and MicroCap |
| 12Stocks.com Tech Stocks Performances & Trends Daily | |||||||||
|
|  The overall Smart Investing & Trading Score is 95 (0-bearish to 100-bullish) which puts Technology sector in short term bullish trend. The Smart Investing & Trading Score from previous trading session is 77 and hence an improvement of trend.
| ||||||||
Here are the Smart Investing & Trading Scores of the most requested Technology stocks at 12Stocks.com (click stock name for detailed review):
|


| 12Stocks.com: Investing in Technology sector with Stocks | |
|
The following table helps investors and traders sort through current performance and trends (as measured by Smart Investing & Trading Score) of various
stocks in the Tech sector. Quick View: Move mouse or cursor over stock symbol (ticker) to view short-term technical chart and over stock name to view long term chart. Click on  to add stock symbol to your watchlist and to add stock symbol to your watchlist and  to view watchlist. Click on any ticker or stock name for detailed market intelligence report for that stock. to view watchlist. Click on any ticker or stock name for detailed market intelligence report for that stock. |
12Stocks.com Performance of Stocks in Tech Sector
| Ticker | Stock Name | Watchlist | Category | Recent Price | Smart Investing & Trading Score | Change % | YTD Change% |
| YEXT | Yext |   | Internet | 5.67 | 74 | -1.22% | -3.74% |
| ENFN | Enfusion | | Software - | 9.43 | 86 | 1.84% | -4.34% |
| CWAN | Clearwater Analytics | | Software - | 19.10 | 95 | 0.79% | -4.57% |
| CCCS | CCC Intelligent | | Software - Infrastructure | 10.78 | 32 | 1.60% | -4.98% |
| NTCT | NetScout Systems | | Software | 20.84 | 74 | 2.11% | -5.06% |
| POWI | Power Integrations | | Semiconductor | 77.93 | 95 | 0.74% | -5.09% |
| PRGS | Progress Software | | Software | 51.43 | 74 | 0.45% | -5.29% |
| BL | BlackLine | | Software | 58.90 | 63 | 1.83% | -5.67% |
| EVCM | EverCommerce | | Software - Infrastructure | 10.49 | 95 | 1.06% | -5.71% |
| LBTYK | Liberty Global | | CATV | 17.57 | 74 | 0.51% | -5.74% |
| SRAD | Sportradar | | Software - | 10.48 | 100 | 10.32% | -6.01% |
| DOX | Amdocs | | Software | 82.05 | 0 | -0.02% | -6.64% |
| GBTG | Global Business | | Software - | 6.09 | 88 | 1.33% | -6.74% |
| LOGI | Logitech | | Computer | 88.58 | 85 | -0.67% | -6.82% |
| EVTC | EVERTEC | | Software | 37.74 | 75 | 0.21% | -7.82% |
| MDB | MongoDB | | Software | 376.49 | 49 | 4.79% | -7.91% |
| PD | PagerDuty | | Software | 21.29 | 67 | 2.90% | -8.03% |
| OLED | Universal Display | | Semiconductor | 175.46 | 72 | 0.31% | -8.26% |
| ROG | Rogers | | Electronics | 121.14 | 68 | 1.31% | -8.28% |
| ESE | ESCO | | Instruments | 107.30 | 95 | 2.20% | -8.31% |
| HKD | AMTD Digital | | Software - | 3.77 | 57 | -8.05% | -8.72% |
| BB | BlackBerry | | Communication | 3.23 | 88 | -6.92% | -8.76% |
| BLKB | Blackbaud | | Software | 79.01 | 95 | 1.73% | -8.87% |
| AVDX | AvidXchange | | Software - Infrastructure | 11.31 | 18 | 0.80% | -8.90% |
| JBL | Jabil | | Circuit Boards | 115.47 | 10 | -1.85% | -9.36% |
| For chart view version of above stock list: Chart View ➞ 0 - 25 , 25 - 50 , 50 - 75 , 75 - 100 , 100 - 125 , 125 - 150 , 150 - 175 , 175 - 200 , 200 - 225 , 225 - 250 | ||
 | Click To Change The Sort Order: By Market Cap or Company Size Performance: Year-to-date, Week and Day |  |
|
Get the most comprehensive stock market coverage daily at 12Stocks.com ➞ Best Stocks Today ➞ Best Stocks Weekly ➞ Best Stocks Year-to-Date ➞ Best Stocks Trends ➞  Best Stocks Today 12Stocks.com Best Nasdaq Stocks ➞ Best S&P 500 Stocks ➞ Best Tech Stocks ➞ Best Biotech Stocks ➞ |
| Detailed Overview of Tech Stocks |
| Tech Technical Overview, Leaders & Laggards, Top Tech ETF Funds & Detailed Tech Stocks List, Charts, Trends & More |
| Tech Sector: Technical Analysis, Trends & YTD Performance | |
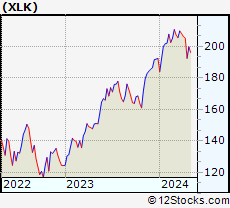
| Technology sector is composed of stocks
from semiconductors, software, web, social media
and services subsectors. Technology sector, as represented by XLK, an exchange-traded fund [ETF] that holds basket of tech stocks (e.g, Intel, Google) is up by 10.68% and is currently underperforming the overall market by -0.040000000000001% year-to-date. Below is a quick view of technical charts and trends: |
|
 XLK Weekly Chart |
|
| Long Term Trend: Very Good | |
| Medium Term Trend: Very Good | |
 XLK Daily Chart |
|
| Short Term Trend: Very Good | |
| Overall Trend Score: 95 | |
| YTD Performance: 10.68% | |
| **Trend Scores & Views Are Only For Educational Purposes And Not For Investing | |
| 12Stocks.com: Top Performing Technology Sector Stocks | ||||||||||||||||||||||||||||||||||||||||||||||||
 The top performing Technology sector stocks year to date are
Now, more recently, over last week, the top performing Technology sector stocks on the move are


|
||||||||||||||||||||||||||||||||||||||||||||||||
| 12Stocks.com: Investing in Tech Sector using Exchange Traded Funds | |
|
The following table shows list of key exchange traded funds (ETF) that
help investors track Tech Index. For detailed view, check out our ETF Funds section of our website. Quick View: Move mouse or cursor over ETF symbol (ticker) to view short-term technical chart and over ETF name to view long term chart. Click on ticker or stock name for detailed view. Click on to add stock symbol to your watchlist and to view watchlist. |
12Stocks.com List of ETFs that track Tech Index
| Ticker | ETF Name | Watchlist | Recent Price | Smart Investing & Trading Score | Change % | Week % | Year-to-date % |
| XLK | Technology | | 213.03 | 95 | 2.25 | 3.64 | 10.68% |
| QQQ | QQQ | | 450.36 | 95 | 0.98 | 1.88 | 9.97% |
| IYW | Technology | | 138.70 | 95 | 2.78 | 3.53 | 12.99% |
| VGT | Information Technology | | 536.12 | 95 | 2.29 | 3.85 | 10.77% |
| IXN | Global Tech | | 76.54 | 95 | 2.31 | 3.59 | 12.26% |
| IGV | Tech-Software | | 84.03 | 64 | 2.51 | 3.24 | 3.58% |
| XSD | Semiconductor | | 239.63 | 100 | 2.36 | 4.49 | 6.6% |
| TQQQ | QQQ | | 63.47 | 95 | 4.62 | 7.27 | 25.19% |
| SQQQ | Short QQQ | | 9.87 | 0 | -4.55 | -6.97 | -26.62% |
| SOXL | Semicondct Bull 3X | | 47.00 | 100 | 8.77 | 14.55 | 49.68% |
| SOXS | Semicondct Bear 3X | | 29.81 | 26 | -4.97 | -10.1 | 412.2% |
| SOXX | PHLX Semiconductor | | 230.67 | 95 | 2.83 | 4.73 | 20.12% |
| QTEC | First -100-Tech | | 191.40 | 82 | 2.61 | 3.58 | 9.08% |
| SMH | Semiconductor | | 233.90 | 100 | 3.00 | 4.75 | 33.76% |
| 12Stocks.com: Charts, Trends, Fundamental Data and Performances of Tech Stocks | |
|
We now take in-depth look at all Tech stocks including charts, multi-period performances and overall trends (as measured by Smart Investing & Trading Score). One can sort Tech stocks (click link to choose) by Daily, Weekly and by Year-to-Date performances. Also, one can sort by size of the company or by market capitalization. |
| Select Your Default Chart Type: | |||||
| |||||
| Click on stock symbol or name for detailed view. Click on to add stock symbol to your watchlist and to view watchlist. Quick View: Move mouse or cursor over "Daily" to quickly view daily technical stock chart and over "Weekly" to view weekly technical stock chart. | |||||


 | YEXT Yext, Inc. |
| Sector: Technology | |
| SubSector: Internet Software & Services | |
| MarketCap: 1414.91 Millions | |
| Recent Price: 5.67 Smart Investing & Trading Score: 74 | |
| Day Percent Change: -1.22% Day Change: -0.07 | |
| Week Change: 3.85% Year-to-date Change: -3.7% | |
| YEXT Links: Profile News Message Board | |
| Charts:- Daily , Weekly | |
| Add YEXT to Watchlist: View: Get Complete YEXT Trend Analysis ➞ | |
 | ENFN Enfusion, Inc. |
| Sector: Technology | |
| SubSector: Software - Application | |
| MarketCap: 1290 Millions | |
| Recent Price: 9.43 Smart Investing & Trading Score: 86 | |
| Day Percent Change: 1.84% Day Change: 0.17 | |
| Week Change: 4.2% Year-to-date Change: -4.3% | |
| ENFN Links: Profile News Message Board | |
| Charts:- Daily , Weekly | |
| Add ENFN to Watchlist: View: Get Complete ENFN Trend Analysis ➞ | |
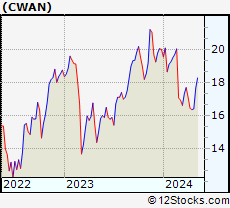 | CWAN Clearwater Analytics Holdings, Inc. |
| Sector: Technology | |
| SubSector: Software - Application | |
| MarketCap: 3830 Millions | |
| Recent Price: 19.10 Smart Investing & Trading Score: 95 | |
| Day Percent Change: 0.79% Day Change: 0.15 | |
| Week Change: 4.49% Year-to-date Change: -4.6% | |
| CWAN Links: Profile News Message Board | |
| Charts:- Daily , Weekly | |
| Add CWAN to Watchlist: View: Get Complete CWAN Trend Analysis ➞ | |
 | CCCS CCC Intelligent Solutions Holdings Inc. |
| Sector: Technology | |
| SubSector: Software - Infrastructure | |
| MarketCap: 6990 Millions | |
| Recent Price: 10.78 Smart Investing & Trading Score: 32 | |
| Day Percent Change: 1.60% Day Change: 0.17 | |
| Week Change: 1.51% Year-to-date Change: -5.0% | |
| CCCS Links: Profile News Message Board | |
| Charts:- Daily , Weekly | |
| Add CCCS to Watchlist: View: Get Complete CCCS Trend Analysis ➞ | |
 | NTCT NetScout Systems, Inc. |
| Sector: Technology | |
| SubSector: Business Software & Services | |
| MarketCap: 1657.28 Millions | |
| Recent Price: 20.84 Smart Investing & Trading Score: 74 | |
| Day Percent Change: 2.11% Day Change: 0.43 | |
| Week Change: 2.56% Year-to-date Change: -5.1% | |
| NTCT Links: Profile News Message Board | |
| Charts:- Daily , Weekly | |
| Add NTCT to Watchlist: View: Get Complete NTCT Trend Analysis ➞ | |
 | POWI Power Integrations, Inc. |
| Sector: Technology | |
| SubSector: Semiconductor - Integrated Circuits | |
| MarketCap: 2612.1 Millions | |
| Recent Price: 77.93 Smart Investing & Trading Score: 95 | |
| Day Percent Change: 0.74% Day Change: 0.57 | |
| Week Change: 3.34% Year-to-date Change: -5.1% | |
| POWI Links: Profile News Message Board | |
| Charts:- Daily , Weekly | |
| Add POWI to Watchlist: View: Get Complete POWI Trend Analysis ➞ | |
 | PRGS Progress Software Corporation |
| Sector: Technology | |
| SubSector: Application Software | |
| MarketCap: 1407.22 Millions | |
| Recent Price: 51.43 Smart Investing & Trading Score: 74 | |
| Day Percent Change: 0.45% Day Change: 0.23 | |
| Week Change: 0.94% Year-to-date Change: -5.3% | |
| PRGS Links: Profile News Message Board | |
| Charts:- Daily , Weekly | |
| Add PRGS to Watchlist: View: Get Complete PRGS Trend Analysis ➞ | |
 | BL BlackLine, Inc. |
| Sector: Technology | |
| SubSector: Application Software | |
| MarketCap: 2972.62 Millions | |
| Recent Price: 58.90 Smart Investing & Trading Score: 63 | |
| Day Percent Change: 1.83% Day Change: 1.06 | |
| Week Change: 1.17% Year-to-date Change: -5.7% | |
| BL Links: Profile News Message Board | |
| Charts:- Daily , Weekly | |
| Add BL to Watchlist: View: Get Complete BL Trend Analysis ➞ | |
 | EVCM EverCommerce Inc. |
| Sector: Technology | |
| SubSector: Software - Infrastructure | |
| MarketCap: 2210 Millions | |
| Recent Price: 10.49 Smart Investing & Trading Score: 95 | |
| Day Percent Change: 1.06% Day Change: 0.11 | |
| Week Change: 3.96% Year-to-date Change: -5.7% | |
| EVCM Links: Profile News Message Board | |
| Charts:- Daily , Weekly | |
| Add EVCM to Watchlist: View: Get Complete EVCM Trend Analysis ➞ | |
 | LBTYK Liberty Global plc |
| Sector: Technology | |
| SubSector: CATV Systems | |
| MarketCap: 7253.02 Millions | |
| Recent Price: 17.57 Smart Investing & Trading Score: 74 | |
| Day Percent Change: 0.51% Day Change: 0.09 | |
| Week Change: 1.97% Year-to-date Change: -5.7% | |
| LBTYK Links: Profile News Message Board | |
| Charts:- Daily , Weekly | |
| Add LBTYK to Watchlist: View: Get Complete LBTYK Trend Analysis ➞ | |
 | SRAD Sportradar Group AG |
| Sector: Technology | |
| SubSector: Software - Application | |
| MarketCap: 3900 Millions | |
| Recent Price: 10.48 Smart Investing & Trading Score: 100 | |
| Day Percent Change: 10.32% Day Change: 0.98 | |
| Week Change: 13.17% Year-to-date Change: -6.0% | |
| SRAD Links: Profile News Message Board | |
| Charts:- Daily , Weekly | |
| Add SRAD to Watchlist: View: Get Complete SRAD Trend Analysis ➞ | |
 | DOX Amdocs Limited |
| Sector: Technology | |
| SubSector: Business Software & Services | |
| MarketCap: 6895.48 Millions | |
| Recent Price: 82.05 Smart Investing & Trading Score: 0 | |
| Day Percent Change: -0.02% Day Change: -0.02 | |
| Week Change: -1.42% Year-to-date Change: -6.6% | |
| DOX Links: Profile News Message Board | |
| Charts:- Daily , Weekly | |
| Add DOX to Watchlist: View: Get Complete DOX Trend Analysis ➞ | |
 | GBTG Global Business Travel Group, Inc. |
| Sector: Technology | |
| SubSector: Software - Application | |
| MarketCap: 3440 Millions | |
| Recent Price: 6.09 Smart Investing & Trading Score: 88 | |
| Day Percent Change: 1.33% Day Change: 0.08 | |
| Week Change: 1.84% Year-to-date Change: -6.7% | |
| GBTG Links: Profile News Message Board | |
| Charts:- Daily , Weekly | |
| Add GBTG to Watchlist: View: Get Complete GBTG Trend Analysis ➞ | |
 | LOGI Logitech International S.A. |
| Sector: Technology | |
| SubSector: Computer Peripherals | |
| MarketCap: 7998.19 Millions | |
| Recent Price: 88.58 Smart Investing & Trading Score: 85 | |
| Day Percent Change: -0.67% Day Change: -0.59 | |
| Week Change: 4.5% Year-to-date Change: -6.8% | |
| LOGI Links: Profile News Message Board | |
| Charts:- Daily , Weekly | |
| Add LOGI to Watchlist: View: Get Complete LOGI Trend Analysis ➞ | |
 | EVTC EVERTEC, Inc. |
| Sector: Technology | |
| SubSector: Business Software & Services | |
| MarketCap: 1646.08 Millions | |
| Recent Price: 37.74 Smart Investing & Trading Score: 75 | |
| Day Percent Change: 0.21% Day Change: 0.08 | |
| Week Change: 1.23% Year-to-date Change: -7.8% | |
| EVTC Links: Profile News Message Board | |
| Charts:- Daily , Weekly | |
| Add EVTC to Watchlist: View: Get Complete EVTC Trend Analysis ➞ | |
 | MDB MongoDB, Inc. |
| Sector: Technology | |
| SubSector: Application Software | |
| MarketCap: 7591.22 Millions | |
| Recent Price: 376.49 Smart Investing & Trading Score: 49 | |
| Day Percent Change: 4.79% Day Change: 17.22 | |
| Week Change: 6.22% Year-to-date Change: -7.9% | |
| MDB Links: Profile News Message Board | |
| Charts:- Daily , Weekly | |
| Add MDB to Watchlist: View: Get Complete MDB Trend Analysis ➞ | |
 | PD PagerDuty, Inc. |
| Sector: Technology | |
| SubSector: Application Software | |
| MarketCap: 1690.32 Millions | |
| Recent Price: 21.29 Smart Investing & Trading Score: 67 | |
| Day Percent Change: 2.90% Day Change: 0.60 | |
| Week Change: 8.13% Year-to-date Change: -8.0% | |
| PD Links: Profile News Message Board | |
| Charts:- Daily , Weekly | |
| Add PD to Watchlist: View: Get Complete PD Trend Analysis ➞ | |
 | OLED Universal Display Corporation |
| Sector: Technology | |
| SubSector: Semiconductor Equipment & Materials | |
| MarketCap: 5660.08 Millions | |
| Recent Price: 175.46 Smart Investing & Trading Score: 72 | |
| Day Percent Change: 0.31% Day Change: 0.54 | |
| Week Change: 2.56% Year-to-date Change: -8.3% | |
| OLED Links: Profile News Message Board | |
| Charts:- Daily , Weekly | |
| Add OLED to Watchlist: View: Get Complete OLED Trend Analysis ➞ | |
 | ROG Rogers Corporation |
| Sector: Technology | |
| SubSector: Diversified Electronics | |
| MarketCap: 1756.36 Millions | |
| Recent Price: 121.14 Smart Investing & Trading Score: 68 | |
| Day Percent Change: 1.31% Day Change: 1.57 | |
| Week Change: 0.45% Year-to-date Change: -8.3% | |
| ROG Links: Profile News Message Board | |
| Charts:- Daily , Weekly | |
| Add ROG to Watchlist: View: Get Complete ROG Trend Analysis ➞ | |
 | ESE ESCO Technologies Inc. |
| Sector: Technology | |
| SubSector: Scientific & Technical Instruments | |
| MarketCap: 1968.03 Millions | |
| Recent Price: 107.30 Smart Investing & Trading Score: 95 | |
| Day Percent Change: 2.20% Day Change: 2.31 | |
| Week Change: 2.19% Year-to-date Change: -8.3% | |
| ESE Links: Profile News Message Board | |
| Charts:- Daily , Weekly | |
| Add ESE to Watchlist: View: Get Complete ESE Trend Analysis ➞ | |
 | HKD AMTD Digital Inc. |
| Sector: Technology | |
| SubSector: Software - Application | |
| MarketCap: 1200 Millions | |
| Recent Price: 3.77 Smart Investing & Trading Score: 57 | |
| Day Percent Change: -8.05% Day Change: -0.33 | |
| Week Change: 4.14% Year-to-date Change: -8.7% | |
| HKD Links: Profile News Message Board | |
| Charts:- Daily , Weekly | |
| Add HKD to Watchlist: View: Get Complete HKD Trend Analysis ➞ | |
 | BB BlackBerry Limited |
| Sector: Technology | |
| SubSector: Communication Equipment | |
| MarketCap: 2100.39 Millions | |
| Recent Price: 3.23 Smart Investing & Trading Score: 88 | |
| Day Percent Change: -6.92% Day Change: -0.24 | |
| Week Change: 10.81% Year-to-date Change: -8.8% | |
| BB Links: Profile News Message Board | |
| Charts:- Daily , Weekly | |
| Add BB to Watchlist: View: Get Complete BB Trend Analysis ➞ | |
 | BLKB Blackbaud, Inc. |
| Sector: Technology | |
| SubSector: Business Software & Services | |
| MarketCap: 2838.48 Millions | |
| Recent Price: 79.01 Smart Investing & Trading Score: 95 | |
| Day Percent Change: 1.73% Day Change: 1.34 | |
| Week Change: 1.75% Year-to-date Change: -8.9% | |
| BLKB Links: Profile News Message Board | |
| Charts:- Daily , Weekly | |
| Add BLKB to Watchlist: View: Get Complete BLKB Trend Analysis ➞ | |
 | AVDX AvidXchange Holdings, Inc. |
| Sector: Technology | |
| SubSector: Software - Infrastructure | |
| MarketCap: 2120 Millions | |
| Recent Price: 11.31 Smart Investing & Trading Score: 18 | |
| Day Percent Change: 0.80% Day Change: 0.09 | |
| Week Change: 0.62% Year-to-date Change: -8.9% | |
| AVDX Links: Profile News Message Board | |
| Charts:- Daily , Weekly | |
| Add AVDX to Watchlist: View: Get Complete AVDX Trend Analysis ➞ | |
 | JBL Jabil Inc. |
| Sector: Technology | |
| SubSector: Printed Circuit Boards | |
| MarketCap: 3272.15 Millions | |
| Recent Price: 115.47 Smart Investing & Trading Score: 10 | |
| Day Percent Change: -1.85% Day Change: -2.18 | |
| Week Change: -2.1% Year-to-date Change: -9.4% | |
| JBL Links: Profile News Message Board | |
| Charts:- Daily , Weekly | |
| Add JBL to Watchlist: View: Get Complete JBL Trend Analysis ➞ | |
| For tabular summary view of above stock list: Summary View ➞ 0 - 25 , 25 - 50 , 50 - 75 , 75 - 100 , 100 - 125 , 125 - 150 , 150 - 175 , 175 - 200 , 200 - 225 , 225 - 250 | ||
| Click To Change The Sort Order: By Market Cap or Company Size Performance: Year-to-date, Week and Day | |
| Select Chart Type: | ||
|
Best Stocks Today 12Stocks.com |
© 2024 12Stocks.com Terms & Conditions Privacy Contact Us
All Information Provided Only For Education And Not To Be Used For Investing or Trading. See Terms & Conditions


One More Thing ... Get Best Stocks Delivered Daily!
Never Ever Miss A Move With Our Top Ten Stocks Lists
Find Best Stocks In Any Market - Bull or Bear Market
Take A Peek At Our Top Ten Stocks Lists: Daily, Weekly, Year-to-Date & Top Trends
Find Best Stocks In Any Market - Bull or Bear Market
Take A Peek At Our Top Ten Stocks Lists: Daily, Weekly, Year-to-Date & Top Trends
Technology Stocks With Best Up Trends [0-bearish to 100-bullish]: Synchronoss [100], MicroStrategy [100], Riskified [100], Dell [100], Sportradar [100], Camtek [100], Samsara [100], Immersion [100], Pure Storage[100], Himax [100], Vodafone [100]
Best Technology Stocks Year-to-Date:
MicroCloud Hologram[527.34%], Bakkt [446.19%], Uxin [404.99%], MediaCo Holding[259.15%], Super Micro[235.03%], Smith Micro[232.93%], CXApp [157.14%], SoundHound AI[148.6%], MicroStrategy [138.03%], AppLovin [111.23%], CuriosityStream [109.22%] Best Technology Stocks This Week:
Uxin [41.04%], LivePerson [40.88%], SunPower [35.22%], Tigo Energy[34.26%], on [28.3%], MicroCloud Hologram[28.24%], MicroStrategy [27.36%], Synchronoss [26.88%], Bakkt [23.78%], OptimizeRx [21.83%], monday.com [21.43%] Best Technology Stocks Daily:
OptimizeRx [25.67%], Telos [24.29%], monday.com [21.37%], Synchronoss [16.23%], MicroStrategy [15.86%], Super Micro[15.81%], Riskified [15.30%], Dell [11.21%], Shift4 Payments[11.02%], Viomi [10.67%], Sportradar [10.32%]