
 Login Sign Up


| |||||
 |  | ||||

| 12Stocks.com Market Intelligence |
Best Tech Stocks
| In a hurry? Tech Stocks Lists: Performance & Trends, Stock Charts, FANG Stocks
Sort Tech stocks: Daily, Weekly, Year-to-Date, Market Cap & Trends. Filter Tech stocks list by size:All Tech Large Mid-Range Small and MicroCap |
| 12Stocks.com Tech Stocks Performances & Trends Daily | |||||||||
|
|  The overall Smart Investing & Trading Score is 68 (0-bearish to 100-bullish) which puts Technology sector in short term neutral to bullish trend. The Smart Investing & Trading Score from previous trading session is 58 and hence an improvement of trend.
| ||||||||
Here are the Smart Investing & Trading Scores of the most requested Technology stocks at 12Stocks.com (click stock name for detailed review):
|


| 12Stocks.com: Investing in Technology sector with Stocks | |
|
The following table helps investors and traders sort through current performance and trends (as measured by Smart Investing & Trading Score) of various
stocks in the Tech sector. Quick View: Move mouse or cursor over stock symbol (ticker) to view short-term technical chart and over stock name to view long term chart. Click on  to add stock symbol to your watchlist and to add stock symbol to your watchlist and  to view watchlist. Click on any ticker or stock name for detailed market intelligence report for that stock. to view watchlist. Click on any ticker or stock name for detailed market intelligence report for that stock. |
12Stocks.com Performance of Stocks in Tech Sector
| Ticker | Stock Name | Watchlist | Category | Recent Price | Smart Investing & Trading Score | Change % | YTD Change% |
| GLOB | Globant S.A |   | IT | 183.60 | 42 | 1.53% | -22.85% |
| BILL | Bill.com | | Software | 62.93 | 74 | 0.78% | -22.87% |
| VICR | Vicor | | Electronics | 34.23 | 42 | -0.52% | -23.83% |
| ZG | Zillow | | Internet | 43.09 | 42 | -0.08% | -24.02% |
| XRX | Xerox | | IT | 13.86 | 10 | -1.00% | -24.39% |
| Z | Zillow | | Internet | 43.66 | 42 | -0.03% | -24.55% |
| FIVN | Five9 | | Software | 59.23 | 27 | 0.42% | -24.73% |
| TUYA | Tuya | | Software - Infrastructure | 1.73 | 10 | -0.86% | -24.84% |
| PWSC | PowerSchool | | Software - | 17.67 | 42 | 0.57% | -25.25% |
| AMBA | Ambarella | | Semiconductor | 45.23 | 49 | 4.95% | -26.21% |
| FSLY | Fastly | | Software | 12.99 | 42 | 0.31% | -27.02% |
| OMCL | Omnicell | | Healthcare Information | 27.38 | 52 | -1.72% | -27.24% |
| INST | Instructure | | Software - | 19.48 | 49 | -0.87% | -27.88% |
| IONQ | IonQ | | Computer Hardware | 8.91 | 64 | -0.67% | -28.52% |
| SSYS | Stratasys | | Computer | 10.02 | 42 | 0.00% | -29.83% |
| BMBL | Bumble | | Software - | 10.37 | 40 | -1.14% | -30.22% |
| AUR | Aurora Innovation | | IT | 3.04 | 80 | 1.00% | -30.87% |
| MLNK | MeridianLink | | Software - | 17.10 | 24 | -2.29% | -30.96% |
| AFRM | Affirm | | Software - Infrastructure | 33.41 | 50 | 0.21% | -31.76% |
| LUMN | Lumen | | Telecom | 1.22 | 53 | 0.83% | -33.15% |
| PRFT | Perficient | | IT | 43.42 | 27 | 1.00% | -34.03% |
| SEDG | SolarEdge | | Semiconductor | 60.05 | 47 | 3.18% | -35.84% |
| EGHT | 8x8 | | Communication | 2.38 | 32 | 4.85% | -37.04% |
| SHEN | Shenandoah Tele | | Telecom | 13.40 | 20 | 0.07% | -38.02% |
| VNET | 21Vianet | | IT | 1.72 | 95 | 8.86% | -40.07% |
| For chart view version of above stock list: Chart View ➞ 0 - 25 , 25 - 50 , 50 - 75 , 75 - 100 , 100 - 125 , 125 - 150 , 150 - 175 , 175 - 200 , 200 - 225 , 225 - 250 | ||
 | Click To Change The Sort Order: By Market Cap or Company Size Performance: Year-to-date, Week and Day |  |
|
Get the most comprehensive stock market coverage daily at 12Stocks.com ➞ Best Stocks Today ➞ Best Stocks Weekly ➞ Best Stocks Year-to-Date ➞ Best Stocks Trends ➞  Best Stocks Today 12Stocks.com Best Nasdaq Stocks ➞ Best S&P 500 Stocks ➞ Best Tech Stocks ➞ Best Biotech Stocks ➞ |
| Detailed Overview of Tech Stocks |
| Tech Technical Overview, Leaders & Laggards, Top Tech ETF Funds & Detailed Tech Stocks List, Charts, Trends & More |
| Tech Sector: Technical Analysis, Trends & YTD Performance | |
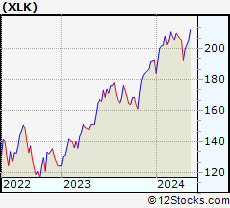
| Technology sector is composed of stocks
from semiconductors, software, web, social media
and services subsectors. Technology sector, as represented by XLK, an exchange-traded fund [ETF] that holds basket of tech stocks (e.g, Intel, Google) is up by 4.27% and is currently underperforming the overall market by -2.26% year-to-date. Below is a quick view of technical charts and trends: |
|
 XLK Weekly Chart |
|
| Long Term Trend: Good | |
| Medium Term Trend: Not Good | |
 XLK Daily Chart |
|
| Short Term Trend: Very Good | |
| Overall Trend Score: 68 | |
| YTD Performance: 4.27% | |
| **Trend Scores & Views Are Only For Educational Purposes And Not For Investing | |
| 12Stocks.com: Top Performing Technology Sector Stocks | ||||||||||||||||||||||||||||||||||||||||||||||||
 The top performing Technology sector stocks year to date are
Now, more recently, over last week, the top performing Technology sector stocks on the move are


|
||||||||||||||||||||||||||||||||||||||||||||||||
| 12Stocks.com: Investing in Tech Sector using Exchange Traded Funds | |
|
The following table shows list of key exchange traded funds (ETF) that
help investors track Tech Index. For detailed view, check out our ETF Funds section of our website. Quick View: Move mouse or cursor over ETF symbol (ticker) to view short-term technical chart and over ETF name to view long term chart. Click on ticker or stock name for detailed view. Click on to add stock symbol to your watchlist and to view watchlist. |
12Stocks.com List of ETFs that track Tech Index
| Ticker | ETF Name | Watchlist | Recent Price | Smart Investing & Trading Score | Change % | Week % | Year-to-date % |
| XLK | Technology | | 200.69 | 68 | 0.43 | 0.43 | 4.27% |
| QQQ | QQQ | | 432.83 | 68 | 0.42 | 0.42 | 5.69% |
| IYW | Technology | | 130.98 | 68 | 0.02 | 0.02 | 6.7% |
| VGT | Information Technology | | 505.97 | 75 | 0.40 | 0.4 | 4.54% |
| IXN | Global Tech | | 71.92 | 58 | 0.17 | 0.17 | 5.49% |
| IGV | Tech-Software | | 80.95 | 35 | -0.17 | -0.17 | -0.21% |
| XSD | Semiconductor | | 226.15 | 100 | 0.65 | 0.65 | 0.61% |
| TQQQ | QQQ | | 55.95 | 68 | 1.22 | 1.22 | 10.36% |
| SQQQ | Short QQQ | | 11.32 | 27 | -0.96 | -0.96 | -15.84% |
| SOXL | Semicondct Bull 3X | | 40.66 | 80 | 2.29 | 2.29 | 29.49% |
| SOXS | Semicondct Bear 3X | | 34.44 | 51 | -1.89 | -1.89 | 491.67% |
| SOXX | PHLX Semiconductor | | 218.52 | 78 | 0.75 | 0.75 | 13.79% |
| QTEC | First -100-Tech | | 183.78 | 75 | -0.11 | -0.11 | 4.74% |
| SMH | Semiconductor | | 218.44 | 63 | 0.37 | 0.37 | 24.91% |
| 12Stocks.com: Charts, Trends, Fundamental Data and Performances of Tech Stocks | |
|
We now take in-depth look at all Tech stocks including charts, multi-period performances and overall trends (as measured by Smart Investing & Trading Score). One can sort Tech stocks (click link to choose) by Daily, Weekly and by Year-to-Date performances. Also, one can sort by size of the company or by market capitalization. |
| Select Your Default Chart Type: | |||||
| |||||
| Click on stock symbol or name for detailed view. Click on to add stock symbol to your watchlist and to view watchlist. Quick View: Move mouse or cursor over "Daily" to quickly view daily technical stock chart and over "Weekly" to view weekly technical stock chart. | |||||


 | GLOB Globant S.A. |
| Sector: Technology | |
| SubSector: Information Technology Services | |
| MarketCap: 2976.88 Millions | |
| Recent Price: 183.60 Smart Investing & Trading Score: 42 | |
| Day Percent Change: 1.53% Day Change: 2.77 | |
| Week Change: 1.53% Year-to-date Change: -22.9% | |
| GLOB Links: Profile News Message Board | |
| Charts:- Daily , Weekly | |
| Add GLOB to Watchlist: View: Get Complete GLOB Trend Analysis ➞ | |
 | BILL Bill.com Holdings, Inc. |
| Sector: Technology | |
| SubSector: Application Software | |
| MarketCap: 3068.42 Millions | |
| Recent Price: 62.93 Smart Investing & Trading Score: 74 | |
| Day Percent Change: 0.78% Day Change: 0.49 | |
| Week Change: 0.78% Year-to-date Change: -22.9% | |
| BILL Links: Profile News Message Board | |
| Charts:- Daily , Weekly | |
| Add BILL to Watchlist: View: Get Complete BILL Trend Analysis ➞ | |
 | VICR Vicor Corporation |
| Sector: Technology | |
| SubSector: Diversified Electronics | |
| MarketCap: 1526.76 Millions | |
| Recent Price: 34.23 Smart Investing & Trading Score: 42 | |
| Day Percent Change: -0.52% Day Change: -0.18 | |
| Week Change: -0.52% Year-to-date Change: -23.8% | |
| VICR Links: Profile News Message Board | |
| Charts:- Daily , Weekly | |
| Add VICR to Watchlist: View: Get Complete VICR Trend Analysis ➞ | |
 | ZG Zillow Group, Inc. |
| Sector: Technology | |
| SubSector: Internet Information Providers | |
| MarketCap: 6536.7 Millions | |
| Recent Price: 43.09 Smart Investing & Trading Score: 42 | |
| Day Percent Change: -0.08% Day Change: -0.04 | |
| Week Change: -0.08% Year-to-date Change: -24.0% | |
| ZG Links: Profile News Message Board | |
| Charts:- Daily , Weekly | |
| Add ZG to Watchlist: View: Get Complete ZG Trend Analysis ➞ | |
 | XRX Xerox Holdings Corporation |
| Sector: Technology | |
| SubSector: Information Technology Services | |
| MarketCap: 4077.48 Millions | |
| Recent Price: 13.86 Smart Investing & Trading Score: 10 | |
| Day Percent Change: -1.00% Day Change: -0.14 | |
| Week Change: -1% Year-to-date Change: -24.4% | |
| XRX Links: Profile News Message Board | |
| Charts:- Daily , Weekly | |
| Add XRX to Watchlist: View: Get Complete XRX Trend Analysis ➞ | |
 | Z Zillow Group, Inc. |
| Sector: Technology | |
| SubSector: Internet Information Providers | |
| MarketCap: 3880.4 Millions | |
| Recent Price: 43.66 Smart Investing & Trading Score: 42 | |
| Day Percent Change: -0.03% Day Change: -0.02 | |
| Week Change: -0.03% Year-to-date Change: -24.6% | |
| Z Links: Profile News Message Board | |
| Charts:- Daily , Weekly | |
| Add Z to Watchlist: View: Get Complete Z Trend Analysis ➞ | |
 | FIVN Five9, Inc. |
| Sector: Technology | |
| SubSector: Application Software | |
| MarketCap: 4253.62 Millions | |
| Recent Price: 59.23 Smart Investing & Trading Score: 27 | |
| Day Percent Change: 0.42% Day Change: 0.25 | |
| Week Change: 0.42% Year-to-date Change: -24.7% | |
| FIVN Links: Profile News Message Board | |
| Charts:- Daily , Weekly | |
| Add FIVN to Watchlist: View: Get Complete FIVN Trend Analysis ➞ | |
 | TUYA Tuya Inc. |
| Sector: Technology | |
| SubSector: Software - Infrastructure | |
| MarketCap: 1050 Millions | |
| Recent Price: 1.73 Smart Investing & Trading Score: 10 | |
| Day Percent Change: -0.86% Day Change: -0.01 | |
| Week Change: -0.86% Year-to-date Change: -24.8% | |
| TUYA Links: Profile News Message Board | |
| Charts:- Daily , Weekly | |
| Add TUYA to Watchlist: View: Get Complete TUYA Trend Analysis ➞ | |
 | PWSC PowerSchool Holdings, Inc. |
| Sector: Technology | |
| SubSector: Software - Application | |
| MarketCap: 3870 Millions | |
| Recent Price: 17.67 Smart Investing & Trading Score: 42 | |
| Day Percent Change: 0.57% Day Change: 0.10 | |
| Week Change: 0.57% Year-to-date Change: -25.3% | |
| PWSC Links: Profile News Message Board | |
| Charts:- Daily , Weekly | |
| Add PWSC to Watchlist: View: Get Complete PWSC Trend Analysis ➞ | |
 | AMBA Ambarella, Inc. |
| Sector: Technology | |
| SubSector: Semiconductor Equipment & Materials | |
| MarketCap: 1509.38 Millions | |
| Recent Price: 45.23 Smart Investing & Trading Score: 49 | |
| Day Percent Change: 4.95% Day Change: 2.13 | |
| Week Change: 4.95% Year-to-date Change: -26.2% | |
| AMBA Links: Profile News Message Board | |
| Charts:- Daily , Weekly | |
| Add AMBA to Watchlist: View: Get Complete AMBA Trend Analysis ➞ | |
 | FSLY Fastly, Inc. |
| Sector: Technology | |
| SubSector: Application Software | |
| MarketCap: 1973.72 Millions | |
| Recent Price: 12.99 Smart Investing & Trading Score: 42 | |
| Day Percent Change: 0.31% Day Change: 0.04 | |
| Week Change: 0.31% Year-to-date Change: -27.0% | |
| FSLY Links: Profile News Message Board | |
| Charts:- Daily , Weekly | |
| Add FSLY to Watchlist: View: Get Complete FSLY Trend Analysis ➞ | |
 | OMCL Omnicell, Inc. |
| Sector: Technology | |
| SubSector: Healthcare Information Services | |
| MarketCap: 2781.05 Millions | |
| Recent Price: 27.38 Smart Investing & Trading Score: 52 | |
| Day Percent Change: -1.72% Day Change: -0.48 | |
| Week Change: -1.72% Year-to-date Change: -27.2% | |
| OMCL Links: Profile News Message Board | |
| Charts:- Daily , Weekly | |
| Add OMCL to Watchlist: View: Get Complete OMCL Trend Analysis ➞ | |
 | INST Instructure Holdings, Inc. |
| Sector: Technology | |
| SubSector: Software - Application | |
| MarketCap: 3580 Millions | |
| Recent Price: 19.48 Smart Investing & Trading Score: 49 | |
| Day Percent Change: -0.87% Day Change: -0.17 | |
| Week Change: -0.87% Year-to-date Change: -27.9% | |
| INST Links: Profile News Message Board | |
| Charts:- Daily , Weekly | |
| Add INST to Watchlist: View: Get Complete INST Trend Analysis ➞ | |
 | IONQ IonQ, Inc. |
| Sector: Technology | |
| SubSector: Computer Hardware | |
| MarketCap: 2680 Millions | |
| Recent Price: 8.91 Smart Investing & Trading Score: 64 | |
| Day Percent Change: -0.67% Day Change: -0.06 | |
| Week Change: -0.67% Year-to-date Change: -28.5% | |
| IONQ Links: Profile News Message Board | |
| Charts:- Daily , Weekly | |
| Add IONQ to Watchlist: View: Get Complete IONQ Trend Analysis ➞ | |
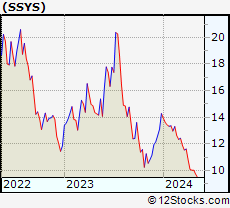 | SSYS Stratasys Ltd. |
| Sector: Technology | |
| SubSector: Computer Peripherals | |
| MarketCap: 1014.89 Millions | |
| Recent Price: 10.02 Smart Investing & Trading Score: 42 | |
| Day Percent Change: 0.00% Day Change: 0.00 | |
| Week Change: 0% Year-to-date Change: -29.8% | |
| SSYS Links: Profile News Message Board | |
| Charts:- Daily , Weekly | |
| Add SSYS to Watchlist: View: Get Complete SSYS Trend Analysis ➞ | |
 | BMBL Bumble Inc. |
| Sector: Technology | |
| SubSector: Software - Application | |
| MarketCap: 2290 Millions | |
| Recent Price: 10.37 Smart Investing & Trading Score: 40 | |
| Day Percent Change: -1.14% Day Change: -0.12 | |
| Week Change: -1.14% Year-to-date Change: -30.2% | |
| BMBL Links: Profile News Message Board | |
| Charts:- Daily , Weekly | |
| Add BMBL to Watchlist: View: Get Complete BMBL Trend Analysis ➞ | |
 | AUR Aurora Innovation, Inc. |
| Sector: Technology | |
| SubSector: Information Technology Services | |
| MarketCap: 3220 Millions | |
| Recent Price: 3.04 Smart Investing & Trading Score: 80 | |
| Day Percent Change: 1.00% Day Change: 0.03 | |
| Week Change: 1% Year-to-date Change: -30.9% | |
| AUR Links: Profile News Message Board | |
| Charts:- Daily , Weekly | |
| Add AUR to Watchlist: View: Get Complete AUR Trend Analysis ➞ | |
 | MLNK MeridianLink, Inc. |
| Sector: Technology | |
| SubSector: Software - Application | |
| MarketCap: 1630 Millions | |
| Recent Price: 17.10 Smart Investing & Trading Score: 24 | |
| Day Percent Change: -2.29% Day Change: -0.40 | |
| Week Change: -2.29% Year-to-date Change: -31.0% | |
| MLNK Links: Profile News Message Board | |
| Charts:- Daily , Weekly | |
| Add MLNK to Watchlist: View: Get Complete MLNK Trend Analysis ➞ | |
 | AFRM Affirm Holdings, Inc. |
| Sector: Technology | |
| SubSector: Software - Infrastructure | |
| MarketCap: 4560 Millions | |
| Recent Price: 33.41 Smart Investing & Trading Score: 50 | |
| Day Percent Change: 0.21% Day Change: 0.07 | |
| Week Change: 0.21% Year-to-date Change: -31.8% | |
| AFRM Links: Profile News Message Board | |
| Charts:- Daily , Weekly | |
| Add AFRM to Watchlist: View: Get Complete AFRM Trend Analysis ➞ | |
 | LUMN Lumen Technologies, Inc. |
| Sector: Technology | |
| SubSector: Telecom Services - Domestic | |
| MarketCap: 1242 Millions | |
| Recent Price: 1.22 Smart Investing & Trading Score: 53 | |
| Day Percent Change: 0.83% Day Change: 0.01 | |
| Week Change: 0.83% Year-to-date Change: -33.2% | |
| LUMN Links: Profile News Message Board | |
| Charts:- Daily , Weekly | |
| Add LUMN to Watchlist: View: Get Complete LUMN Trend Analysis ➞ | |
 | PRFT Perficient, Inc. |
| Sector: Technology | |
| SubSector: Information Technology Services | |
| MarketCap: 1005.68 Millions | |
| Recent Price: 43.42 Smart Investing & Trading Score: 27 | |
| Day Percent Change: 1.00% Day Change: 0.43 | |
| Week Change: 1% Year-to-date Change: -34.0% | |
| PRFT Links: Profile News Message Board | |
| Charts:- Daily , Weekly | |
| Add PRFT to Watchlist: View: Get Complete PRFT Trend Analysis ➞ | |
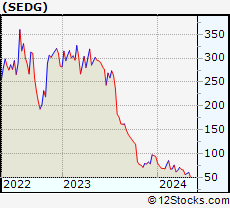 | SEDG SolarEdge Technologies, Inc. |
| Sector: Technology | |
| SubSector: Semiconductor - Specialized | |
| MarketCap: 4008.8 Millions | |
| Recent Price: 60.05 Smart Investing & Trading Score: 47 | |
| Day Percent Change: 3.18% Day Change: 1.85 | |
| Week Change: 3.18% Year-to-date Change: -35.8% | |
| SEDG Links: Profile News Message Board | |
| Charts:- Daily , Weekly | |
| Add SEDG to Watchlist: View: Get Complete SEDG Trend Analysis ➞ | |
 | EGHT 8x8, Inc. |
| Sector: Technology | |
| SubSector: Diversified Communication Services | |
| MarketCap: 1861.64 Millions | |
| Recent Price: 2.38 Smart Investing & Trading Score: 32 | |
| Day Percent Change: 4.85% Day Change: 0.11 | |
| Week Change: 4.85% Year-to-date Change: -37.0% | |
| EGHT Links: Profile News Message Board | |
| Charts:- Daily , Weekly | |
| Add EGHT to Watchlist: View: Get Complete EGHT Trend Analysis ➞ | |
 | SHEN Shenandoah Telecommunications Company |
| Sector: Technology | |
| SubSector: Telecom Services - Domestic | |
| MarketCap: 2329.67 Millions | |
| Recent Price: 13.40 Smart Investing & Trading Score: 20 | |
| Day Percent Change: 0.07% Day Change: 0.01 | |
| Week Change: 0.07% Year-to-date Change: -38.0% | |
| SHEN Links: Profile News Message Board | |
| Charts:- Daily , Weekly | |
| Add SHEN to Watchlist: View: Get Complete SHEN Trend Analysis ➞ | |
 | VNET 21Vianet Group, Inc. |
| Sector: Technology | |
| SubSector: Information Technology Services | |
| MarketCap: 1846.98 Millions | |
| Recent Price: 1.72 Smart Investing & Trading Score: 95 | |
| Day Percent Change: 8.86% Day Change: 0.14 | |
| Week Change: 8.86% Year-to-date Change: -40.1% | |
| VNET Links: Profile News Message Board | |
| Charts:- Daily , Weekly | |
| Add VNET to Watchlist: View: Get Complete VNET Trend Analysis ➞ | |
| For tabular summary view of above stock list: Summary View ➞ 0 - 25 , 25 - 50 , 50 - 75 , 75 - 100 , 100 - 125 , 125 - 150 , 150 - 175 , 175 - 200 , 200 - 225 , 225 - 250 | ||
| Click To Change The Sort Order: By Market Cap or Company Size Performance: Year-to-date, Week and Day | |
| Select Chart Type: | ||
|
Best Stocks Today 12Stocks.com |
© 2024 12Stocks.com Terms & Conditions Privacy Contact Us
All Information Provided Only For Education And Not To Be Used For Investing or Trading. See Terms & Conditions


One More Thing ... Get Best Stocks Delivered Daily!
Never Ever Miss A Move With Our Top Ten Stocks Lists
Find Best Stocks In Any Market - Bull or Bear Market
Take A Peek At Our Top Ten Stocks Lists: Daily, Weekly, Year-to-Date & Top Trends
Find Best Stocks In Any Market - Bull or Bear Market
Take A Peek At Our Top Ten Stocks Lists: Daily, Weekly, Year-to-Date & Top Trends
Technology Stocks With Best Up Trends [0-bearish to 100-bullish]: Bakkt [100], Koninklijke Philips[100], GDS [100], Ouster [100], Baidu [100], Impinj [100], Teradyne [100], Skyworks [100], America Movil[100], Gogo [100], MACOM [100]
Best Technology Stocks Year-to-Date:
Bakkt [364.13%], MediaCo Holding[277.93%], Super Micro[213.31%], Smith Micro[202.66%], Uxin [182.45%], CXApp [171.04%], SoundHound AI[115.42%], NextNav [110.79%], MicroStrategy [104.71%], CuriosityStream [89.78%], GigaCloud [85.58%] Best Technology Stocks This Week:
Bakkt [2489.44%], Koninklijke Philips[26.79%], Phoenix New[20.57%], Velo3D [19.8%], uCloudlink [14.6%], Cogint [11.46%], GDS [9.54%], Quantum [9.12%], 2U [9.03%], 21Vianet [8.86%], SunPower [8.79%] Best Technology Stocks Daily:
Bakkt [2489.44%], Koninklijke Philips[26.79%], Phoenix New[20.57%], Velo3D [19.80%], uCloudlink [14.60%], Cogint [11.46%], GDS [9.54%], Quantum [9.12%], 2U [9.03%], 21Vianet [8.86%], SunPower [8.79%]