
 Login Sign Up


| |||||
 |  | ||||

| 12Stocks.com Market Intelligence |
Best Tech Stocks
| In a hurry? Tech Stocks Lists: Performance & Trends, Stock Charts, FANG Stocks
Sort Tech stocks: Daily, Weekly, Year-to-Date, Market Cap & Trends. Filter Tech stocks list by size:All Tech Large Mid-Range Small and MicroCap |
| 12Stocks.com Tech Stocks Performances & Trends Daily | |||||||||
|
|  The overall Smart Investing & Trading Score is 100 (0-bearish to 100-bullish) which puts Technology sector in short term bullish trend. The Smart Investing & Trading Score from previous trading session is 90 and an improvement of trend continues.
| ||||||||
Here are the Smart Investing & Trading Scores of the most requested Technology stocks at 12Stocks.com (click stock name for detailed review):
|


| 12Stocks.com: Investing in Technology sector with Stocks | |
|
The following table helps investors and traders sort through current performance and trends (as measured by Smart Investing & Trading Score) of various
stocks in the Tech sector. Quick View: Move mouse or cursor over stock symbol (ticker) to view short-term technical chart and over stock name to view long term chart. Click on  to add stock symbol to your watchlist and to add stock symbol to your watchlist and  to view watchlist. Click on any ticker or stock name for detailed market intelligence report for that stock. to view watchlist. Click on any ticker or stock name for detailed market intelligence report for that stock. |
12Stocks.com Performance of Stocks in Tech Sector
| Ticker | Stock Name | Watchlist | Category | Recent Price | Smart Investing & Trading Score | Change % | YTD Change% |
| AMD | Advanced Micro |   | Semiconductors | 169.73 | 90 | 3.49% | 40.70% |
| SHOP | Shopify | | Software - | 151.30 | 80 | 1.16% | 40.70% |
| TTWO | Take-Two Interactive | | Electronic Gaming & Multimedia | 256.93 | 50 | 0.60% | 40.35% |
| ROKU | Roku | | Entertainment | 103.84 | 100 | 0.26% | 39.40% |
| EA | Electronic Arts | | Electronic Gaming & Multimedia | 201.00 | 60 | -0.31% | 38.14% |
| LOGI | Logitech | | Computer Hardware | 112.65 | 80 | 2.57% | 37.98% |
| VOD | Vodafone | | Telecom | 11.42 | 40 | -0.95% | 37.61% |
| AMAT | Applied Materials | | Semiconductor | 223.60 | 100 | 2.69% | 37.15% |
| NVDA | NVIDIA Corp | | Semiconductors | 188.94 | 100 | 0.91% | 36.63% |
| GWRE | Guidewire Software | | Software - | 231.01 | 50 | 0.34% | 36.29% |
| OTEX | Open Text | | Software - | 37.66 | 50 | 1.41% | 35.95% |
| LDOS | Leidos | | IT | 192.89 | 100 | 0.66% | 35.38% |
| VRSN | Verisign | | Software - Infrastructure | 275.44 | 20 | 0.19% | 34.66% |
| MDB | MongoDB | | Software - Infrastructure | 326.29 | 80 | 1.48% | 33.39% |
| IBM | IBM Corp | | IT | 286.72 | 90 | 0.08% | 33.00% |
| QRVO | Qorvo | | Semiconductors | 91.54 | 70 | 1.18% | 31.22% |
| NFLX | Netflix | | Entertainment | 1162.30 | 10 | -0.73% | 31.08% |
| LSCC | Lattice Semiconductor | | Semiconductors | 72.88 | 80 | -0.98% | 30.26% |
| GOOGL | Alphabet | | Internet Content & Information | 245.74 | 80 | 0.34% | 30.03% |
| FFIV | F5 | | Software - Infrastructure | 327.07 | 70 | -0.07% | 29.92% |
| GOOG | Alphabet | | Internet Content & Information | 246.43 | 80 | 0.36% | 29.57% |
| ANET | Arista Networks | | Computer Hardware | 144.46 | 60 | -3.22% | 29.22% |
| KT | KT | | Telecom | 19.88 | 70 | 0.61% | 28.58% |
| DELL | Dell | | Computer Hardware | 147.37 | 100 | -1.54% | 28.31% |
| TEF | Telefonica S.A | | Telecom | 5.02 | 10 | -1.18% | 27.72% |
| For chart view version of above stock list: Chart View ➞ 0 - 25 , 25 - 50 , 50 - 75 , 75 - 100 , 100 - 125 , 125 - 150 , 150 - 175 , 175 - 200 , 200 - 225 , 225 - 250 , 250 - 275 | ||
 | Click To Change The Sort Order: By Market Cap or Company Size Performance: Year-to-date, Week and Day |  |
|
Get the most comprehensive stock market coverage daily at 12Stocks.com ➞ Best Stocks Today ➞ Best Stocks Weekly ➞ Best Stocks Year-to-Date ➞ Best Stocks Trends ➞  Best Stocks Today 12Stocks.com Best Nasdaq Stocks ➞ Best S&P 500 Stocks ➞ Best Tech Stocks ➞ Best Biotech Stocks ➞ |
| Detailed Overview of Tech Stocks |
| Tech Technical Overview, Leaders & Laggards, Top Tech ETF Funds & Detailed Tech Stocks List, Charts, Trends & More |
| Tech Sector: Technical Analysis, Trends & YTD Performance | |
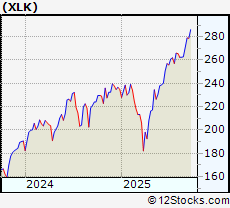
| Technology sector is composed of stocks
from semiconductors, software, web, social media
and services subsectors. Technology sector, as represented by XLK, an exchange-traded fund [ETF] that holds basket of tech stocks (e.g, Intel, Google) is up by 23.7823% and is currently outperforming the overall market by 9.0244% year-to-date. Below is a quick view of technical charts and trends: |
|
 XLK Weekly Chart |
|
| Long Term Trend: Very Good | |
| Medium Term Trend: Good | |
 XLK Daily Chart |
|
| Short Term Trend: Very Good | |
| Overall Trend Score: 100 | |
| YTD Performance: 23.7823% | |
| **Trend Scores & Views Are Only For Educational Purposes And Not For Investing | |
| 12Stocks.com: Top Performing Technology Sector Stocks | ||||||||||||||||||||||||||||||||||||||||||||||||
 The top performing Technology sector stocks year to date are
Now, more recently, over last week, the top performing Technology sector stocks on the move are


|
||||||||||||||||||||||||||||||||||||||||||||||||
| 12Stocks.com: Investing in Tech Sector using Exchange Traded Funds | |
|
The following table shows list of key exchange traded funds (ETF) that
help investors track Tech Index. For detailed view, check out our ETF Funds section of our website. Quick View: Move mouse or cursor over ETF symbol (ticker) to view short-term technical chart and over ETF name to view long term chart. Click on ticker or stock name for detailed view. Click on to add stock symbol to your watchlist and to view watchlist. |
12Stocks.com List of ETFs that track Tech Index
| Ticker | ETF Name | Watchlist | Recent Price | Smart Investing & Trading Score | Change % | Week % | Year-to-date % |
| IGN | Tech-Multimd Ntwk | | 53.86 | 40 | 0.918119 | -20.6435 | 0% |
| 12Stocks.com: Charts, Trends, Fundamental Data and Performances of Tech Stocks | |
|
We now take in-depth look at all Tech stocks including charts, multi-period performances and overall trends (as measured by Smart Investing & Trading Score). One can sort Tech stocks (click link to choose) by Daily, Weekly and by Year-to-Date performances. Also, one can sort by size of the company or by market capitalization. |
| Select Your Default Chart Type: | |||||
| |||||
| Click on stock symbol or name for detailed view. Click on to add stock symbol to your watchlist and to view watchlist. Quick View: Move mouse or cursor over "Daily" to quickly view daily technical stock chart and over "Weekly" to view weekly technical stock chart. | |||||


 | AMD Advanced Micro Devices Inc |
| Sector: Technology | |
| SubSector: Semiconductors | |
| MarketCap: 245277 Millions | |
| Recent Price: 169.73 Smart Investing & Trading Score: 90 | |
| Day Percent Change: 3.48759% Day Change: 6.03 | |
| Week Change: 5.50099% Year-to-date Change: 40.7% | |
| AMD Links: Profile News Message Board | |
| Charts:- Daily , Weekly | |
| Add AMD to Watchlist: View: Get Complete AMD Trend Analysis ➞ | |
 | SHOP Shopify Inc |
| Sector: Technology | |
| SubSector: Software - Application | |
| MarketCap: 190816 Millions | |
| Recent Price: 151.30 Smart Investing & Trading Score: 80 | |
| Day Percent Change: 1.15665% Day Change: 0.03 | |
| Week Change: 1.65961% Year-to-date Change: 40.7% | |
| SHOP Links: Profile News Message Board | |
| Charts:- Daily , Weekly | |
| Add SHOP to Watchlist: View: Get Complete SHOP Trend Analysis ➞ | |
 | TTWO Take-Two Interactive Software, Inc |
| Sector: Technology | |
| SubSector: Electronic Gaming & Multimedia | |
| MarketCap: 44213.8 Millions | |
| Recent Price: 256.93 Smart Investing & Trading Score: 50 | |
| Day Percent Change: 0.59906% Day Change: 1.39 | |
| Week Change: 5.24742% Year-to-date Change: 40.3% | |
| TTWO Links: Profile News Message Board | |
| Charts:- Daily , Weekly | |
| Add TTWO to Watchlist: View: Get Complete TTWO Trend Analysis ➞ | |
 | ROKU Roku Inc |
| Sector: Technology | |
| SubSector: Entertainment | |
| MarketCap: 14031.8 Millions | |
| Recent Price: 103.84 Smart Investing & Trading Score: 100 | |
| Day Percent Change: 0.260693% Day Change: 1.57 | |
| Week Change: 5.73261% Year-to-date Change: 39.4% | |
| ROKU Links: Profile News Message Board | |
| Charts:- Daily , Weekly | |
| Add ROKU to Watchlist: View: Get Complete ROKU Trend Analysis ➞ | |
 | EA Electronic Arts, Inc |
| Sector: Technology | |
| SubSector: Electronic Gaming & Multimedia | |
| MarketCap: 42189.9 Millions | |
| Recent Price: 201.00 Smart Investing & Trading Score: 60 | |
| Day Percent Change: -0.312454% Day Change: -0.68 | |
| Week Change: 20.1076% Year-to-date Change: 38.1% | |
| EA Links: Profile News Message Board | |
| Charts:- Daily , Weekly | |
| Add EA to Watchlist: View: Get Complete EA Trend Analysis ➞ | |
 | LOGI Logitech International S.A |
| Sector: Technology | |
| SubSector: Computer Hardware | |
| MarketCap: 15824.7 Millions | |
| Recent Price: 112.65 Smart Investing & Trading Score: 80 | |
| Day Percent Change: 2.5676% Day Change: 2.58 | |
| Week Change: 3.54812% Year-to-date Change: 38.0% | |
| LOGI Links: Profile News Message Board | |
| Charts:- Daily , Weekly | |
| Add LOGI to Watchlist: View: Get Complete LOGI Trend Analysis ➞ | |
 | VOD Vodafone Group plc ADR |
| Sector: Technology | |
| SubSector: Telecom Services | |
| MarketCap: 28493.3 Millions | |
| Recent Price: 11.42 Smart Investing & Trading Score: 40 | |
| Day Percent Change: -0.954033% Day Change: -0.11 | |
| Week Change: 0.794351% Year-to-date Change: 37.6% | |
| VOD Links: Profile News Message Board | |
| Charts:- Daily , Weekly | |
| Add VOD to Watchlist: View: Get Complete VOD Trend Analysis ➞ | |
 | AMAT Applied Materials Inc |
| Sector: Technology | |
| SubSector: Semiconductor Equipment & Materials | |
| MarketCap: 129654 Millions | |
| Recent Price: 223.60 Smart Investing & Trading Score: 100 | |
| Day Percent Change: 2.69128% Day Change: 6.97 | |
| Week Change: 11.0008% Year-to-date Change: 37.2% | |
| AMAT Links: Profile News Message Board | |
| Charts:- Daily , Weekly | |
| Add AMAT to Watchlist: View: Get Complete AMAT Trend Analysis ➞ | |
 | NVDA NVIDIA Corp |
| Sector: Technology | |
| SubSector: Semiconductors | |
| MarketCap: 4058590 Millions | |
| Recent Price: 188.94 Smart Investing & Trading Score: 100 | |
| Day Percent Change: 0.907926% Day Change: 1.55 | |
| Week Change: 6.76386% Year-to-date Change: 36.6% | |
| NVDA Links: Profile News Message Board | |
| Charts:- Daily , Weekly | |
| Add NVDA to Watchlist: View: Get Complete NVDA Trend Analysis ➞ | |
 | GWRE Guidewire Software Inc |
| Sector: Technology | |
| SubSector: Software - Application | |
| MarketCap: 21950.5 Millions | |
| Recent Price: 231.01 Smart Investing & Trading Score: 50 | |
| Day Percent Change: 0.338792% Day Change: 1.03 | |
| Week Change: -2.39152% Year-to-date Change: 36.3% | |
| GWRE Links: Profile News Message Board | |
| Charts:- Daily , Weekly | |
| Add GWRE to Watchlist: View: Get Complete GWRE Trend Analysis ➞ | |
 | OTEX Open Text Corp |
| Sector: Technology | |
| SubSector: Software - Application | |
| MarketCap: 8451.05 Millions | |
| Recent Price: 37.66 Smart Investing & Trading Score: 50 | |
| Day Percent Change: 1.41357% Day Change: 0.32 | |
| Week Change: -1.29717% Year-to-date Change: 35.9% | |
| OTEX Links: Profile News Message Board | |
| Charts:- Daily , Weekly | |
| Add OTEX to Watchlist: View: Get Complete OTEX Trend Analysis ➞ | |
 | LDOS Leidos Holdings Inc |
| Sector: Technology | |
| SubSector: Information Technology Services | |
| MarketCap: 22965.2 Millions | |
| Recent Price: 192.89 Smart Investing & Trading Score: 100 | |
| Day Percent Change: 0.657517% Day Change: 1.09 | |
| Week Change: 2.92956% Year-to-date Change: 35.4% | |
| LDOS Links: Profile News Message Board | |
| Charts:- Daily , Weekly | |
| Add LDOS to Watchlist: View: Get Complete LDOS Trend Analysis ➞ | |
 | VRSN Verisign Inc |
| Sector: Technology | |
| SubSector: Software - Infrastructure | |
| MarketCap: 26162.8 Millions | |
| Recent Price: 275.44 Smart Investing & Trading Score: 20 | |
| Day Percent Change: 0.189146% Day Change: 0.27 | |
| Week Change: -3.44247% Year-to-date Change: 34.7% | |
| VRSN Links: Profile News Message Board | |
| Charts:- Daily , Weekly | |
| Add VRSN to Watchlist: View: Get Complete VRSN Trend Analysis ➞ | |
 | MDB MongoDB Inc |
| Sector: Technology | |
| SubSector: Software - Infrastructure | |
| MarketCap: 26419.8 Millions | |
| Recent Price: 326.29 Smart Investing & Trading Score: 80 | |
| Day Percent Change: 1.48042% Day Change: 4.09 | |
| Week Change: 3.48557% Year-to-date Change: 33.4% | |
| MDB Links: Profile News Message Board | |
| Charts:- Daily , Weekly | |
| Add MDB to Watchlist: View: Get Complete MDB Trend Analysis ➞ | |
 | IBM International Business Machines Corp |
| Sector: Technology | |
| SubSector: Information Technology Services | |
| MarketCap: 231510 Millions | |
| Recent Price: 286.72 Smart Investing & Trading Score: 90 | |
| Day Percent Change: 0.080282% Day Change: 0.96 | |
| Week Change: 7.17303% Year-to-date Change: 33.0% | |
| IBM Links: Profile News Message Board | |
| Charts:- Daily , Weekly | |
| Add IBM to Watchlist: View: Get Complete IBM Trend Analysis ➞ | |
 | QRVO Qorvo Inc |
| Sector: Technology | |
| SubSector: Semiconductors | |
| MarketCap: 8606.65 Millions | |
| Recent Price: 91.54 Smart Investing & Trading Score: 70 | |
| Day Percent Change: 1.18271% Day Change: 1.26 | |
| Week Change: -1.85483% Year-to-date Change: 31.2% | |
| QRVO Links: Profile News Message Board | |
| Charts:- Daily , Weekly | |
| Add QRVO to Watchlist: View: Get Complete QRVO Trend Analysis ➞ | |
 | NFLX Netflix Inc |
| Sector: Technology | |
| SubSector: Entertainment | |
| MarketCap: 528532 Millions | |
| Recent Price: 1162.30 Smart Investing & Trading Score: 10 | |
| Day Percent Change: -0.734478% Day Change: -11.9 | |
| Week Change: -3.45945% Year-to-date Change: 31.1% | |
| NFLX Links: Profile News Message Board | |
| Charts:- Daily , Weekly | |
| Add NFLX to Watchlist: View: Get Complete NFLX Trend Analysis ➞ | |
 | LSCC Lattice Semiconductor Corp |
| Sector: Technology | |
| SubSector: Semiconductors | |
| MarketCap: 9050.17 Millions | |
| Recent Price: 72.88 Smart Investing & Trading Score: 80 | |
| Day Percent Change: -0.978261% Day Change: -0.6 | |
| Week Change: 1.01178% Year-to-date Change: 30.3% | |
| LSCC Links: Profile News Message Board | |
| Charts:- Daily , Weekly | |
| Add LSCC to Watchlist: View: Get Complete LSCC Trend Analysis ➞ | |
 | GOOGL Alphabet Inc |
| Sector: Technology | |
| SubSector: Internet Content & Information | |
| MarketCap: 2843010 Millions | |
| Recent Price: 245.74 Smart Investing & Trading Score: 80 | |
| Day Percent Change: 0.342997% Day Change: -0.59 | |
| Week Change: -0.566481% Year-to-date Change: 30.0% | |
| GOOGL Links: Profile News Message Board | |
| Charts:- Daily , Weekly | |
| Add GOOGL to Watchlist: View: Get Complete GOOGL Trend Analysis ➞ | |
 | FFIV F5 Inc |
| Sector: Technology | |
| SubSector: Software - Infrastructure | |
| MarketCap: 18147 Millions | |
| Recent Price: 327.07 Smart Investing & Trading Score: 70 | |
| Day Percent Change: -0.0672187% Day Change: 0.34 | |
| Week Change: 0.801307% Year-to-date Change: 29.9% | |
| FFIV Links: Profile News Message Board | |
| Charts:- Daily , Weekly | |
| Add FFIV to Watchlist: View: Get Complete FFIV Trend Analysis ➞ | |
 | GOOG Alphabet Inc |
| Sector: Technology | |
| SubSector: Internet Content & Information | |
| MarketCap: 2843010 Millions | |
| Recent Price: 246.43 Smart Investing & Trading Score: 80 | |
| Day Percent Change: 0.362466% Day Change: -0.56 | |
| Week Change: -0.564903% Year-to-date Change: 29.6% | |
| GOOG Links: Profile News Message Board | |
| Charts:- Daily , Weekly | |
| Add GOOG to Watchlist: View: Get Complete GOOG Trend Analysis ➞ | |
 | ANET Arista Networks Inc |
| Sector: Technology | |
| SubSector: Computer Hardware | |
| MarketCap: 179543 Millions | |
| Recent Price: 144.46 Smart Investing & Trading Score: 60 | |
| Day Percent Change: -3.22235% Day Change: -4.88 | |
| Week Change: 1.27594% Year-to-date Change: 29.2% | |
| ANET Links: Profile News Message Board | |
| Charts:- Daily , Weekly | |
| Add ANET to Watchlist: View: Get Complete ANET Trend Analysis ➞ | |
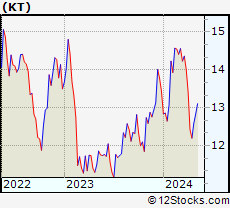 | KT KT Corporation ADR |
| Sector: Technology | |
| SubSector: Telecom Services | |
| MarketCap: 9778.81 Millions | |
| Recent Price: 19.88 Smart Investing & Trading Score: 70 | |
| Day Percent Change: 0.607287% Day Change: 0.06 | |
| Week Change: 2.00103% Year-to-date Change: 28.6% | |
| KT Links: Profile News Message Board | |
| Charts:- Daily , Weekly | |
| Add KT to Watchlist: View: Get Complete KT Trend Analysis ➞ | |
 | DELL Dell Technologies Inc |
| Sector: Technology | |
| SubSector: Computer Hardware | |
| MarketCap: 84740.8 Millions | |
| Recent Price: 147.37 Smart Investing & Trading Score: 100 | |
| Day Percent Change: -1.54329% Day Change: -0.65 | |
| Week Change: 11.5679% Year-to-date Change: 28.3% | |
| DELL Links: Profile News Message Board | |
| Charts:- Daily , Weekly | |
| Add DELL to Watchlist: View: Get Complete DELL Trend Analysis ➞ | |
 | TEF Telefonica S.A ADR |
| Sector: Technology | |
| SubSector: Telecom Services | |
| MarketCap: 30106.5 Millions | |
| Recent Price: 5.02 Smart Investing & Trading Score: 10 | |
| Day Percent Change: -1.1811% Day Change: -0.07 | |
| Week Change: -1.1811% Year-to-date Change: 27.7% | |
| TEF Links: Profile News Message Board | |
| Charts:- Daily , Weekly | |
| Add TEF to Watchlist: View: Get Complete TEF Trend Analysis ➞ | |
| For tabular summary view of above stock list: Summary View ➞ 0 - 25 , 25 - 50 , 50 - 75 , 75 - 100 , 100 - 125 , 125 - 150 , 150 - 175 , 175 - 200 , 200 - 225 , 225 - 250 , 250 - 275 | ||
| Click To Change The Sort Order: By Market Cap or Company Size Performance: Year-to-date, Week and Day | |
| Select Chart Type: | ||
|
Best Stocks Today 12Stocks.com |
© 2025 12Stocks.com Terms & Conditions Privacy Contact Us
All Information Provided Only For Education And Not To Be Used For Investing or Trading. See Terms & Conditions


One More Thing ... Get Best Stocks Delivered Daily!
Never Ever Miss A Move With Our Top Ten Stocks Lists
Find Best Stocks In Any Market - Bull or Bear Market
Take A Peek At Our Top Ten Stocks Lists: Daily, Weekly, Year-to-Date & Top Trends
Find Best Stocks In Any Market - Bull or Bear Market
Take A Peek At Our Top Ten Stocks Lists: Daily, Weekly, Year-to-Date & Top Trends
Technology Stocks With Best Up Trends [0-bearish to 100-bullish]: Sony [100], Bakkt [100], Rigetti Computing[100], Fair Isaac[100], Arqit Quantum[100], D-Wave Quantum[100], Navitas Semiconductor[100], Shoals [100], Vuzix [100], Arteris [100], Lantronix [100]
Best Technology Stocks Year-to-Date:
Xunlei [370.476%], Sify [315.033%], Wolfspeed [307.01%], Digital Turbine[265.057%], EchoStar Corp[247.253%], CuriosityStream [241.605%], Viasat [224.029%], Pagaya [222.638%], Oneconnect Financial[209.053%], D-Wave Quantum[203.954%], CommScope Holding[203.101%] Best Technology Stocks This Week:
GTT [443626%], Barracuda Networks[71050%], Mobile TeleSystems[10483.5%], Nam Tai[5033.33%], Ebix [4200.85%], Fang [4150%], NantHealth [3114.02%], Hemisphere Media[2981.82%], Yandex N.V[2935.27%], Wolfspeed [1961.98%], Castlight Health[1751.96%] Best Technology Stocks Daily:
Sony [194.565%], Bakkt [28.6091%], Rigetti Computing[18.4925%], Fair Isaac[17.979%], Arqit Quantum[17.9369%], Marti [17%], Latch [16.6667%], Oclaro [14.734%], D-Wave Quantum[13.968%], Arbe Robotics[13.0178%], Navitas Semiconductor[12.3288%]