
 Login Sign Up


| |||||
 |  | ||||

| 12Stocks.com Market Intelligence |
Best Tech Stocks
| In a hurry? Tech Stocks Lists: Performance & Trends, Stock Charts, FANG Stocks
Sort Tech stocks: Daily, Weekly, Year-to-Date, Market Cap & Trends. Filter Tech stocks list by size:All Tech Large Mid-Range Small and MicroCap |
| 12Stocks.com Tech Stocks Performances & Trends Daily | |||||||||
|
|  The overall Smart Investing & Trading Score is 100 (0-bearish to 100-bullish) which puts Technology sector in short term bullish trend. The Smart Investing & Trading Score from previous trading session is 90 and an improvement of trend continues.
| ||||||||
Here are the Smart Investing & Trading Scores of the most requested Technology stocks at 12Stocks.com (click stock name for detailed review):
|


| 12Stocks.com: Investing in Technology sector with Stocks | |
|
The following table helps investors and traders sort through current performance and trends (as measured by Smart Investing & Trading Score) of various
stocks in the Tech sector. Quick View: Move mouse or cursor over stock symbol (ticker) to view short-term technical chart and over stock name to view long term chart. Click on  to add stock symbol to your watchlist and to add stock symbol to your watchlist and  to view watchlist. Click on any ticker or stock name for detailed market intelligence report for that stock. to view watchlist. Click on any ticker or stock name for detailed market intelligence report for that stock. |
12Stocks.com Performance of Stocks in Tech Sector
| Ticker | Stock Name | Watchlist | Category | Recent Price | Smart Investing & Trading Score | Change % | Weekly Change% |
| SOHU | Sohu.com . |   | Electronic Gaming & Multimedia | 15.51 | 50 | -1.15% | 1.70% |
| AMBA | Ambarella | | Semiconductor | 86.12 | 90 | 1.22% | 1.70% |
| GDS | GDS | | IT | 41.35 | 100 | 2.80% | 1.68% |
| NTCT | Netscout Systems | | Software - Infrastructure | 26.32 | 100 | 0.17% | 1.66% |
| SHOP | Shopify | | Software - | 151.30 | 80 | 1.16% | 1.66% |
| SABR | Sabre Corp | | Software - Infrastructure | 1.84 | 30 | -1.08% | 1.66% |
| JFIN | Jiayin | | Internet Content & Information | 11.39 | 60 | 4.88% | 1.61% |
| CLBT | Cellebrite DI | | Software - Infrastructure | 18.75 | 80 | 1.35% | 1.57% |
| PLUS | ePlus | | Software - | 72.79 | 70 | 1.31% | 1.53% |
| PD | Pagerduty | | Software - | 16.47 | 70 | 0.98% | 1.48% |
| TKC | Turkcell Iletisim | | Telecom | 6.18 | 100 | 0.98% | 1.48% |
| CSCO | Cisco Systems | | Communication | 68.31 | 70 | -0.64% | 1.47% |
| RCI | Rogers | | Telecom | 35.15 | 60 | 0.89% | 1.47% |
| ACIW | ACI Worldwide | | Software - Infrastructure | 53.02 | 90 | 0.53% | 1.42% |
| NUAN | Nuance | | Software | 55.99 | 70 | 0.00% | 1.39% |
| SEDG | Solaredge | | Solar | 37.99 | 80 | -1.63% | 1.39% |
| ULTI | Ultimate Software | | Internet | 25.63 | 60 | -0.27% | 1.38% |
| ATEN | A10 Networks | | Software - Infrastructure | 18.49 | 90 | 1.09% | 1.37% |
| NVEI | Nuvei | | Software - Infrastructure | 33.99 | 50 | 0.00% | 1.31% |
| ANET | Arista Networks | | Computer Hardware | 144.46 | 60 | -3.22% | 1.28% |
| ARW | Arrow Electronics | | Electronics & Computer Distribution | 122.45 | 60 | 0.62% | 1.26% |
| PERI | Perion Network | | Internet Content & Information | 9.65 | 70 | 2.12% | 1.26% |
| MANU | Manchester United | | Entertainment | 15.41 | 40 | 1.05% | 1.25% |
| WPP | WPP . | | Advertising Agencies | 24.28 | 30 | -2.18% | 1.21% |
| SLAB | Silicon | | Semiconductors | 133.59 | 50 | 2.14% | 1.20% |
| For chart view version of above stock list: Chart View ➞ 0 - 25 , 25 - 50 , 50 - 75 , 75 - 100 , 100 - 125 , 125 - 150 , 150 - 175 , 175 - 200 , 200 - 225 , 225 - 250 , 250 - 275 , 275 - 300 , 300 - 325 , 325 - 350 , 350 - 375 , 375 - 400 , 400 - 425 , 425 - 450 , 450 - 475 , 475 - 500 , 500 - 525 , 525 - 550 , 550 - 575 , 575 - 600 , 600 - 625 , 625 - 650 , 650 - 675 , 675 - 700 , 700 - 725 , 725 - 750 , 750 - 775 , 775 - 800 , 800 - 825 , 825 - 850 , 850 - 875 , 875 - 900 | ||
 | Click To Change The Sort Order: By Market Cap or Company Size Performance: Year-to-date, Week and Day |  |
|
Get the most comprehensive stock market coverage daily at 12Stocks.com ➞ Best Stocks Today ➞ Best Stocks Weekly ➞ Best Stocks Year-to-Date ➞ Best Stocks Trends ➞  Best Stocks Today 12Stocks.com Best Nasdaq Stocks ➞ Best S&P 500 Stocks ➞ Best Tech Stocks ➞ Best Biotech Stocks ➞ |
| Detailed Overview of Tech Stocks |
| Tech Technical Overview, Leaders & Laggards, Top Tech ETF Funds & Detailed Tech Stocks List, Charts, Trends & More |
| Tech Sector: Technical Analysis, Trends & YTD Performance | |
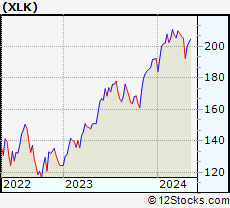
| Technology sector is composed of stocks
from semiconductors, software, web, social media
and services subsectors. Technology sector, as represented by XLK, an exchange-traded fund [ETF] that holds basket of tech stocks (e.g, Intel, Google) is up by 23.7823% and is currently outperforming the overall market by 9.0244% year-to-date. Below is a quick view of technical charts and trends: |
|
 XLK Weekly Chart |
|
| Long Term Trend: Very Good | |
| Medium Term Trend: Good | |
 XLK Daily Chart |
|
| Short Term Trend: Very Good | |
| Overall Trend Score: 100 | |
| YTD Performance: 23.7823% | |
| **Trend Scores & Views Are Only For Educational Purposes And Not For Investing | |
| 12Stocks.com: Top Performing Technology Sector Stocks | ||||||||||||||||||||||||||||||||||||||||||||||||
 The top performing Technology sector stocks year to date are
Now, more recently, over last week, the top performing Technology sector stocks on the move are


|
||||||||||||||||||||||||||||||||||||||||||||||||
| 12Stocks.com: Investing in Tech Sector using Exchange Traded Funds | |
|
The following table shows list of key exchange traded funds (ETF) that
help investors track Tech Index. For detailed view, check out our ETF Funds section of our website. Quick View: Move mouse or cursor over ETF symbol (ticker) to view short-term technical chart and over ETF name to view long term chart. Click on ticker or stock name for detailed view. Click on to add stock symbol to your watchlist and to view watchlist. |
12Stocks.com List of ETFs that track Tech Index
| Ticker | ETF Name | Watchlist | Recent Price | Smart Investing & Trading Score | Change % | Week % | Year-to-date % |
| IGN | Tech-Multimd Ntwk | | 53.86 | 40 | 0.918119 | -20.6435 | 0% |
| 12Stocks.com: Charts, Trends, Fundamental Data and Performances of Tech Stocks | |
|
We now take in-depth look at all Tech stocks including charts, multi-period performances and overall trends (as measured by Smart Investing & Trading Score). One can sort Tech stocks (click link to choose) by Daily, Weekly and by Year-to-Date performances. Also, one can sort by size of the company or by market capitalization. |
| Select Your Default Chart Type: | |||||
| |||||
| Click on stock symbol or name for detailed view. Click on to add stock symbol to your watchlist and to view watchlist. Quick View: Move mouse or cursor over "Daily" to quickly view daily technical stock chart and over "Weekly" to view weekly technical stock chart. | |||||


 | SOHU Sohu.com Ltd. ADR |
| Sector: Technology | |
| SubSector: Electronic Gaming & Multimedia | |
| MarketCap: 467.29 Millions | |
| Recent Price: 15.51 Smart Investing & Trading Score: 50 | |
| Day Percent Change: -1.14723% Day Change: 0.27 | |
| Week Change: 1.70492% Year-to-date Change: 20.5% | |
| SOHU Links: Profile News Message Board | |
| Charts:- Daily , Weekly | |
| Add SOHU to Watchlist: View: Get Complete SOHU Trend Analysis ➞ | |
 | AMBA Ambarella Inc |
| Sector: Technology | |
| SubSector: Semiconductor Equipment & Materials | |
| MarketCap: 3536.14 Millions | |
| Recent Price: 86.12 Smart Investing & Trading Score: 90 | |
| Day Percent Change: 1.22238% Day Change: 0.45 | |
| Week Change: 1.70052% Year-to-date Change: 16.2% | |
| AMBA Links: Profile News Message Board | |
| Charts:- Daily , Weekly | |
| Add AMBA to Watchlist: View: Get Complete AMBA Trend Analysis ➞ | |
 | GDS GDS Holdings Limited ADR |
| Sector: Technology | |
| SubSector: Information Technology Services | |
| MarketCap: 6664.85 Millions | |
| Recent Price: 41.35 Smart Investing & Trading Score: 100 | |
| Day Percent Change: 2.79642% Day Change: 1.21 | |
| Week Change: 1.68429% Year-to-date Change: 78.4% | |
| GDS Links: Profile News Message Board | |
| Charts:- Daily , Weekly | |
| Add GDS to Watchlist: View: Get Complete GDS Trend Analysis ➞ | |
 | NTCT Netscout Systems Inc |
| Sector: Technology | |
| SubSector: Software - Infrastructure | |
| MarketCap: 1786.82 Millions | |
| Recent Price: 26.32 Smart Investing & Trading Score: 100 | |
| Day Percent Change: 0.171265% Day Change: 0.08 | |
| Week Change: 1.66087% Year-to-date Change: 22.1% | |
| NTCT Links: Profile News Message Board | |
| Charts:- Daily , Weekly | |
| Add NTCT to Watchlist: View: Get Complete NTCT Trend Analysis ➞ | |
 | SHOP Shopify Inc |
| Sector: Technology | |
| SubSector: Software - Application | |
| MarketCap: 190816 Millions | |
| Recent Price: 151.30 Smart Investing & Trading Score: 80 | |
| Day Percent Change: 1.15665% Day Change: 0.03 | |
| Week Change: 1.65961% Year-to-date Change: 40.7% | |
| SHOP Links: Profile News Message Board | |
| Charts:- Daily , Weekly | |
| Add SHOP to Watchlist: View: Get Complete SHOP Trend Analysis ➞ | |
 | SABR Sabre Corp |
| Sector: Technology | |
| SubSector: Software - Infrastructure | |
| MarketCap: 674.62 Millions | |
| Recent Price: 1.84 Smart Investing & Trading Score: 30 | |
| Day Percent Change: -1.07527% Day Change: -0.04 | |
| Week Change: 1.65746% Year-to-date Change: -48.5% | |
| SABR Links: Profile News Message Board | |
| Charts:- Daily , Weekly | |
| Add SABR to Watchlist: View: Get Complete SABR Trend Analysis ➞ | |
 | JFIN Jiayin Group Inc ADR |
| Sector: Technology | |
| SubSector: Internet Content & Information | |
| MarketCap: 305.89 Millions | |
| Recent Price: 11.39 Smart Investing & Trading Score: 60 | |
| Day Percent Change: 4.88029% Day Change: 1.03 | |
| Week Change: 1.60571% Year-to-date Change: 81.8% | |
| JFIN Links: Profile News Message Board | |
| Charts:- Daily , Weekly | |
| Add JFIN to Watchlist: View: Get Complete JFIN Trend Analysis ➞ | |
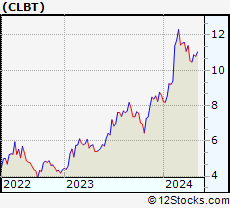 | CLBT Cellebrite DI Ltd |
| Sector: Technology | |
| SubSector: Software - Infrastructure | |
| MarketCap: 3977.6 Millions | |
| Recent Price: 18.75 Smart Investing & Trading Score: 80 | |
| Day Percent Change: 1.35135% Day Change: 0.43 | |
| Week Change: 1.57096% Year-to-date Change: -13.4% | |
| CLBT Links: Profile News Message Board | |
| Charts:- Daily , Weekly | |
| Add CLBT to Watchlist: View: Get Complete CLBT Trend Analysis ➞ | |
 | PLUS ePlus Inc |
| Sector: Technology | |
| SubSector: Software - Application | |
| MarketCap: 1886.69 Millions | |
| Recent Price: 72.79 Smart Investing & Trading Score: 70 | |
| Day Percent Change: 1.30828% Day Change: -0.49 | |
| Week Change: 1.53438% Year-to-date Change: -1.6% | |
| PLUS Links: Profile News Message Board | |
| Charts:- Daily , Weekly | |
| Add PLUS to Watchlist: View: Get Complete PLUS Trend Analysis ➞ | |
 | PD Pagerduty Inc |
| Sector: Technology | |
| SubSector: Software - Application | |
| MarketCap: 1535.77 Millions | |
| Recent Price: 16.47 Smart Investing & Trading Score: 70 | |
| Day Percent Change: 0.980993% Day Change: -0.24 | |
| Week Change: 1.47874% Year-to-date Change: -8.5% | |
| PD Links: Profile News Message Board | |
| Charts:- Daily , Weekly | |
| Add PD to Watchlist: View: Get Complete PD Trend Analysis ➞ | |
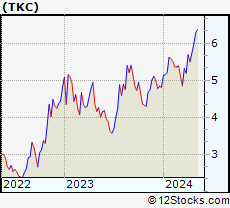 | TKC Turkcell Iletisim Hizmetleri A.S. ADR |
| Sector: Technology | |
| SubSector: Telecom Services | |
| MarketCap: 4828.89 Millions | |
| Recent Price: 6.18 Smart Investing & Trading Score: 100 | |
| Day Percent Change: 0.980392% Day Change: 0.05 | |
| Week Change: 1.47783% Year-to-date Change: -5.5% | |
| TKC Links: Profile News Message Board | |
| Charts:- Daily , Weekly | |
| Add TKC to Watchlist: View: Get Complete TKC Trend Analysis ➞ | |
 | CSCO Cisco Systems, Inc |
| Sector: Technology | |
| SubSector: Communication Equipment | |
| MarketCap: 264469 Millions | |
| Recent Price: 68.31 Smart Investing & Trading Score: 70 | |
| Day Percent Change: -0.644364% Day Change: -0.08 | |
| Week Change: 1.46613% Year-to-date Change: 17.8% | |
| CSCO Links: Profile News Message Board | |
| Charts:- Daily , Weekly | |
| Add CSCO to Watchlist: View: Get Complete CSCO Trend Analysis ➞ | |
 | RCI Rogers Communications Inc |
| Sector: Technology | |
| SubSector: Telecom Services | |
| MarketCap: 19388.8 Millions | |
| Recent Price: 35.15 Smart Investing & Trading Score: 60 | |
| Day Percent Change: 0.889782% Day Change: -0.13 | |
| Week Change: 1.47229% Year-to-date Change: 18.8% | |
| RCI Links: Profile News Message Board | |
| Charts:- Daily , Weekly | |
| Add RCI to Watchlist: View: Get Complete RCI Trend Analysis ➞ | |
 | ACIW ACI Worldwide Inc |
| Sector: Technology | |
| SubSector: Software - Infrastructure | |
| MarketCap: 5185.4 Millions | |
| Recent Price: 53.02 Smart Investing & Trading Score: 90 | |
| Day Percent Change: 0.530906% Day Change: 0.78 | |
| Week Change: 1.41546% Year-to-date Change: 0.8% | |
| ACIW Links: Profile News Message Board | |
| Charts:- Daily , Weekly | |
| Add ACIW to Watchlist: View: Get Complete ACIW Trend Analysis ➞ | |
 | NUAN Nuance Communications, Inc. |
| Sector: Technology | |
| SubSector: Application Software | |
| MarketCap: 4423.32 Millions | |
| Recent Price: 55.99 Smart Investing & Trading Score: 70 | |
| Day Percent Change: 0% Day Change: -9999 | |
| Week Change: 1.39442% Year-to-date Change: 0.0% | |
| NUAN Links: Profile News Message Board | |
| Charts:- Daily , Weekly | |
| Add NUAN to Watchlist: View: Get Complete NUAN Trend Analysis ➞ | |
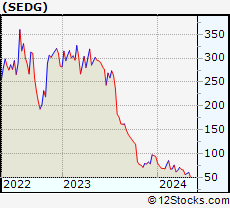 | SEDG Solaredge Technologies Inc |
| Sector: Technology | |
| SubSector: Solar | |
| MarketCap: 2043.68 Millions | |
| Recent Price: 37.99 Smart Investing & Trading Score: 80 | |
| Day Percent Change: -1.63128% Day Change: -1.85 | |
| Week Change: 1.38778% Year-to-date Change: 156.7% | |
| SEDG Links: Profile News Message Board | |
| Charts:- Daily , Weekly | |
| Add SEDG to Watchlist: View: Get Complete SEDG Trend Analysis ➞ | |
 | ULTI The Ultimate Software Group, Inc. |
| Sector: Technology | |
| SubSector: Internet Software & Services | |
| MarketCap: 5792.18 Millions | |
| Recent Price: 25.63 Smart Investing & Trading Score: 60 | |
| Day Percent Change: -0.272374% Day Change: -9999 | |
| Week Change: 1.38449% Year-to-date Change: 0.0% | |
| ULTI Links: Profile News Message Board | |
| Charts:- Daily , Weekly | |
| Add ULTI to Watchlist: View: Get Complete ULTI Trend Analysis ➞ | |
 | ATEN A10 Networks Inc |
| Sector: Technology | |
| SubSector: Software - Infrastructure | |
| MarketCap: 1272.77 Millions | |
| Recent Price: 18.49 Smart Investing & Trading Score: 90 | |
| Day Percent Change: 1.09349% Day Change: -0.02 | |
| Week Change: 1.37061% Year-to-date Change: 2.5% | |
| ATEN Links: Profile News Message Board | |
| Charts:- Daily , Weekly | |
| Add ATEN to Watchlist: View: Get Complete ATEN Trend Analysis ➞ | |
 | NVEI Nuvei Corporation |
| Sector: Technology | |
| SubSector: Software - Infrastructure | |
| MarketCap: 5490 Millions | |
| Recent Price: 33.99 Smart Investing & Trading Score: 50 | |
| Day Percent Change: 0% Day Change: -9999 | |
| Week Change: 1.31148% Year-to-date Change: 0.0% | |
| NVEI Links: Profile News Message Board | |
| Charts:- Daily , Weekly | |
| Add NVEI to Watchlist: View: Get Complete NVEI Trend Analysis ➞ | |
 | ANET Arista Networks Inc |
| Sector: Technology | |
| SubSector: Computer Hardware | |
| MarketCap: 179543 Millions | |
| Recent Price: 144.46 Smart Investing & Trading Score: 60 | |
| Day Percent Change: -3.22235% Day Change: -4.88 | |
| Week Change: 1.27594% Year-to-date Change: 29.2% | |
| ANET Links: Profile News Message Board | |
| Charts:- Daily , Weekly | |
| Add ANET to Watchlist: View: Get Complete ANET Trend Analysis ➞ | |
 | ARW Arrow Electronics Inc |
| Sector: Technology | |
| SubSector: Electronics & Computer Distribution | |
| MarketCap: 6573.68 Millions | |
| Recent Price: 122.45 Smart Investing & Trading Score: 60 | |
| Day Percent Change: 0.624538% Day Change: 0.51 | |
| Week Change: 1.25693% Year-to-date Change: 9.9% | |
| ARW Links: Profile News Message Board | |
| Charts:- Daily , Weekly | |
| Add ARW to Watchlist: View: Get Complete ARW Trend Analysis ➞ | |
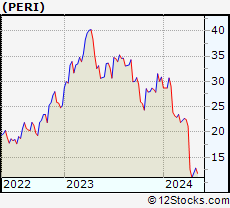 | PERI Perion Network Ltd |
| Sector: Technology | |
| SubSector: Internet Content & Information | |
| MarketCap: 412.54 Millions | |
| Recent Price: 9.65 Smart Investing & Trading Score: 70 | |
| Day Percent Change: 2.1164% Day Change: 0.11 | |
| Week Change: 1.25918% Year-to-date Change: 11.0% | |
| PERI Links: Profile News Message Board | |
| Charts:- Daily , Weekly | |
| Add PERI to Watchlist: View: Get Complete PERI Trend Analysis ➞ | |
 | MANU Manchester United Plc |
| Sector: Technology | |
| SubSector: Entertainment | |
| MarketCap: 2711.87 Millions | |
| Recent Price: 15.41 Smart Investing & Trading Score: 40 | |
| Day Percent Change: 1.04918% Day Change: -0.2 | |
| Week Change: 1.24836% Year-to-date Change: -9.2% | |
| MANU Links: Profile News Message Board | |
| Charts:- Daily , Weekly | |
| Add MANU to Watchlist: View: Get Complete MANU Trend Analysis ➞ | |
 | WPP WPP Plc. ADR |
| Sector: Technology | |
| SubSector: Advertising Agencies | |
| MarketCap: 5825.25 Millions | |
| Recent Price: 24.28 Smart Investing & Trading Score: 30 | |
| Day Percent Change: -2.17566% Day Change: -0.67 | |
| Week Change: 1.20884% Year-to-date Change: -50.5% | |
| WPP Links: Profile News Message Board | |
| Charts:- Daily , Weekly | |
| Add WPP to Watchlist: View: Get Complete WPP Trend Analysis ➞ | |
 | SLAB Silicon Laboratories Inc |
| Sector: Technology | |
| SubSector: Semiconductors | |
| MarketCap: 4445.82 Millions | |
| Recent Price: 133.59 Smart Investing & Trading Score: 50 | |
| Day Percent Change: 2.14084% Day Change: 1.26 | |
| Week Change: 1.20455% Year-to-date Change: 6.8% | |
| SLAB Links: Profile News Message Board | |
| Charts:- Daily , Weekly | |
| Add SLAB to Watchlist: View: Get Complete SLAB Trend Analysis ➞ | |
| For tabular summary view of above stock list: Summary View ➞ 0 - 25 , 25 - 50 , 50 - 75 , 75 - 100 , 100 - 125 , 125 - 150 , 150 - 175 , 175 - 200 , 200 - 225 , 225 - 250 , 250 - 275 , 275 - 300 , 300 - 325 , 325 - 350 , 350 - 375 , 375 - 400 , 400 - 425 , 425 - 450 , 450 - 475 , 475 - 500 , 500 - 525 , 525 - 550 , 550 - 575 , 575 - 600 , 600 - 625 , 625 - 650 , 650 - 675 , 675 - 700 , 700 - 725 , 725 - 750 , 750 - 775 , 775 - 800 , 800 - 825 , 825 - 850 , 850 - 875 , 875 - 900 | ||
| Click To Change The Sort Order: By Market Cap or Company Size Performance: Year-to-date, Week and Day | |
| Select Chart Type: | ||
|
Best Stocks Today 12Stocks.com |
© 2025 12Stocks.com Terms & Conditions Privacy Contact Us
All Information Provided Only For Education And Not To Be Used For Investing or Trading. See Terms & Conditions


One More Thing ... Get Best Stocks Delivered Daily!
Never Ever Miss A Move With Our Top Ten Stocks Lists
Find Best Stocks In Any Market - Bull or Bear Market
Take A Peek At Our Top Ten Stocks Lists: Daily, Weekly, Year-to-Date & Top Trends
Find Best Stocks In Any Market - Bull or Bear Market
Take A Peek At Our Top Ten Stocks Lists: Daily, Weekly, Year-to-Date & Top Trends
Technology Stocks With Best Up Trends [0-bearish to 100-bullish]: Sony [100], Bakkt [100], Rigetti Computing[100], Fair Isaac[100], Arqit Quantum[100], D-Wave Quantum[100], Navitas Semiconductor[100], Shoals [100], Vuzix [100], Arteris [100], Lantronix [100]
Best Technology Stocks Year-to-Date:
Xunlei [370.476%], Sify [315.033%], Wolfspeed [307.01%], Digital Turbine[265.057%], EchoStar Corp[247.253%], CuriosityStream [241.605%], Viasat [224.029%], Pagaya [222.638%], Oneconnect Financial[209.053%], D-Wave Quantum[203.954%], CommScope Holding[203.101%] Best Technology Stocks This Week:
GTT [443626%], Barracuda Networks[71050%], Mobile TeleSystems[10483.5%], Nam Tai[5033.33%], Ebix [4200.85%], Fang [4150%], NantHealth [3114.02%], Hemisphere Media[2981.82%], Yandex N.V[2935.27%], Wolfspeed [1961.98%], Castlight Health[1751.96%] Best Technology Stocks Daily:
Sony [194.565%], Bakkt [28.6091%], Rigetti Computing[18.4925%], Fair Isaac[17.979%], Arqit Quantum[17.9369%], Marti [17%], Latch [16.6667%], Oclaro [14.734%], D-Wave Quantum[13.968%], Arbe Robotics[13.0178%], Navitas Semiconductor[12.3288%]