
 Login Sign Up


| |||||
 |  | ||||

| 12Stocks.com Market Intelligence |
Best Tech Stocks
| In a hurry? Tech Stocks Lists: Performance & Trends, Stock Charts, FANG Stocks
Sort Tech stocks: Daily, Weekly, Year-to-Date, Market Cap & Trends. Filter Tech stocks list by size:All Tech Large Mid-Range Small and MicroCap |
| 12Stocks.com Tech Stocks Performances & Trends Daily | |||||||||
|
|  The overall Smart Investing & Trading Score is 0 (0-bearish to 100-bullish) which puts Technology sector in short term bearish trend. The Smart Investing & Trading Score from previous trading session is 13 and hence a deterioration of trend.
| ||||||||
Here are the Smart Investing & Trading Scores of the most requested Technology stocks at 12Stocks.com (click stock name for detailed review):
|


| 12Stocks.com: Investing in Technology sector with Stocks | |
|
The following table helps investors and traders sort through current performance and trends (as measured by Smart Investing & Trading Score) of various
stocks in the Tech sector. Quick View: Move mouse or cursor over stock symbol (ticker) to view short-term technical chart and over stock name to view long term chart. Click on  to add stock symbol to your watchlist and to add stock symbol to your watchlist and  to view watchlist. Click on any ticker or stock name for detailed market intelligence report for that stock. to view watchlist. Click on any ticker or stock name for detailed market intelligence report for that stock. |
12Stocks.com Performance of Stocks in Tech Sector
| Ticker | Stock Name | Watchlist | Category | Recent Price | Smart Investing & Trading Score | Change % | Weekly Change% |
| TDC | Teradata |   | IT | 36.42 | 35 | -0.90% | 0.30% |
| ACN | Accenture | | IT | 316.06 | 25 | 0.02% | 0.21% |
| CCOI | Cogent | | Communication | 63.13 | 30 | -0.01% | 0.20% |
| YMM | Full Truck | | Software - | 7.72 | 93 | 1.38% | 0.19% |
| DOX | Amdocs | | Software | 85.85 | 32 | 0.87% | 0.16% |
| SKM | SK Telecom | | Wireless | 20.04 | 18 | -0.20% | 0.15% |
| ARQQ | Arqit Quantum | | Software - Infrastructure | 0.50 | 46 | -1.97% | 0.06% |
| ESTC | Elastic N.V | | Software | 97.29 | 42 | 2.08% | 0.05% |
| EVBG | Everbridge | | Software | 34.88 | 61 | -0.01% | 0.04% |
| CACI | CACI | | IT | 367.84 | 49 | 1.04% | 0.03% |
| SY | So-Young | | Healthcare Information | 1.17 | 83 | -2.50% | 0.00% |
| SNX | SYNNEX | | IT | 113.14 | 51 | -0.54% | -0.01% |
| KE | Kimball Electronics | | Electronics | 20.70 | 27 | -1.10% | -0.05% |
| MLNK | MeridianLink | | Software - | 17.12 | 17 | -2.17% | -0.06% |
| NSIT | Insight Enterprises | | IT | 182.55 | 25 | 0.86% | -0.07% |
| SMI | Semiconductor | | Semiconductor | 45.67 | 36 | -0.05% | -0.07% |
| COGT | Cogint | | Software | 6.50 | 12 | -1.59% | -0.08% |
| LBTYK | Liberty Global | | CATV | 17.30 | 42 | 0.67% | -0.09% |
| TU | TELUS | | Wireless | 15.84 | 52 | 0.35% | -0.09% |
| TASK | TaskUs | | IT | 11.36 | 37 | 2.53% | -0.09% |
| OSPN | OneSpan | | Software | 10.01 | 35 | 0.91% | -0.10% |
| OESX | Orion Energy | | Electronics | 0.88 | 35 | 1.50% | -0.11% |
| JFIN | Jiayin | | Internet | 6.45 | 58 | 1.49% | -0.15% |
| DSGX | Descartes Systems | | Software | 89.90 | 48 | -0.26% | -0.17% |
| HSTM | HealthStream | | Healthcare Information | 24.71 | 17 | 3.00% | -0.20% |
| For chart view version of above stock list: Chart View ➞ 0 - 25 , 25 - 50 , 50 - 75 , 75 - 100 , 100 - 125 , 125 - 150 , 150 - 175 , 175 - 200 , 200 - 225 , 225 - 250 , 250 - 275 , 275 - 300 , 300 - 325 , 325 - 350 , 350 - 375 , 375 - 400 , 400 - 425 , 425 - 450 , 450 - 475 , 475 - 500 , 500 - 525 , 525 - 550 , 550 - 575 , 575 - 600 , 600 - 625 , 625 - 650 | ||
 | Click To Change The Sort Order: By Market Cap or Company Size Performance: Year-to-date, Week and Day |  |
|
Get the most comprehensive stock market coverage daily at 12Stocks.com ➞ Best Stocks Today ➞ Best Stocks Weekly ➞ Best Stocks Year-to-Date ➞ Best Stocks Trends ➞  Best Stocks Today 12Stocks.com Best Nasdaq Stocks ➞ Best S&P 500 Stocks ➞ Best Tech Stocks ➞ Best Biotech Stocks ➞ |
| Detailed Overview of Tech Stocks |
| Tech Technical Overview, Leaders & Laggards, Top Tech ETF Funds & Detailed Tech Stocks List, Charts, Trends & More |
| Tech Sector: Technical Analysis, Trends & YTD Performance | |
| Technology sector is composed of stocks
from semiconductors, software, web, social media
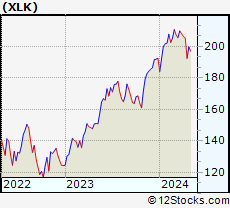
and services subsectors. Technology sector, as represented by XLK, an exchange-traded fund [ETF] that holds basket of tech stocks (e.g, Intel, Google) is up by 0.02% and is currently underperforming the overall market by -3.13% year-to-date. Below is a quick view of technical charts and trends: |
|
 XLK Weekly Chart |
|
| Long Term Trend: Not Good | |
| Medium Term Trend: Not Good | |
 XLK Daily Chart |
|
| Short Term Trend: Not Good | |
| Overall Trend Score: 0 | |
| YTD Performance: 0.02% | |
| **Trend Scores & Views Are Only For Educational Purposes And Not For Investing | |
| 12Stocks.com: Top Performing Technology Sector Stocks | ||||||||||||||||||||||||||||||||||||||||||||||||
 The top performing Technology sector stocks year to date are
Now, more recently, over last week, the top performing Technology sector stocks on the move are


|
||||||||||||||||||||||||||||||||||||||||||||||||
| 12Stocks.com: Investing in Tech Sector using Exchange Traded Funds | |
|
The following table shows list of key exchange traded funds (ETF) that
help investors track Tech Index. For detailed view, check out our ETF Funds section of our website. Quick View: Move mouse or cursor over ETF symbol (ticker) to view short-term technical chart and over ETF name to view long term chart. Click on ticker or stock name for detailed view. Click on to add stock symbol to your watchlist and to view watchlist. |
12Stocks.com List of ETFs that track Tech Index
| Ticker | ETF Name | Watchlist | Recent Price | Smart Investing & Trading Score | Change % | Week % | Year-to-date % |
| XLK | Technology | | 192.51 | 0 | -2.07 | -6.28 | 0.02% |
| QQQ | QQQ | | 414.22 | 13 | -2.17 | -5.49 | 1.15% |
| IYW | Technology | | 124.63 | 36 | -2.94 | -6.96 | 1.53% |
| VGT | Information Technology | | 479.37 | 23 | -2.76 | -6.86 | -0.96% |
| IXN | Global Tech | | 69.03 | 36 | -2.21 | -6.46 | 1.25% |
| IGV | Tech-Software | | 78.30 | 10 | -1.51 | -5.39 | -3.49% |
| XSD | Semiconductor | | 204.00 | 23 | -2.94 | -8.59 | -9.25% |
| TQQQ | QQQ | | 49.26 | 0 | -6.63 | -16.12 | -2.85% |
| SQQQ | Short QQQ | | 12.90 | 95 | 6.88 | 18.46 | -4.09% |
| SOXL | Semicondct Bull 3X | | 30.61 | 0 | -12.32 | -26.26 | -2.52% |
| SOXS | Semicondct Bear 3X | | 46.23 | 90 | 12.02 | 1213.35 | 694.33% |
| SOXX | PHLX Semiconductor | | 198.11 | 36 | -4.12 | -9.15 | 3.16% |
| QTEC | First -100-Tech | | 173.54 | 10 | -2.44 | -6.71 | -1.1% |
| SMH | Semiconductor | | 199.54 | 26 | -4.35 | -9.58 | 14.11% |
| 12Stocks.com: Charts, Trends, Fundamental Data and Performances of Tech Stocks | |
|
We now take in-depth look at all Tech stocks including charts, multi-period performances and overall trends (as measured by Smart Investing & Trading Score). One can sort Tech stocks (click link to choose) by Daily, Weekly and by Year-to-Date performances. Also, one can sort by size of the company or by market capitalization. |
| Select Your Default Chart Type: | |||||
| |||||
| Click on stock symbol or name for detailed view. Click on to add stock symbol to your watchlist and to view watchlist. Quick View: Move mouse or cursor over "Daily" to quickly view daily technical stock chart and over "Weekly" to view weekly technical stock chart. | |||||


 | TDC Teradata Corporation |
| Sector: Technology | |
| SubSector: Information Technology Services | |
| MarketCap: 2229.48 Millions | |
| Recent Price: 36.42 Smart Investing & Trading Score: 35 | |
| Day Percent Change: -0.90% Day Change: -0.33 | |
| Week Change: 0.3% Year-to-date Change: -16.3% | |
| TDC Links: Profile News Message Board | |
| Charts:- Daily , Weekly | |
| Add TDC to Watchlist: View: Get Complete TDC Trend Analysis ➞ | |
 | ACN Accenture plc |
| Sector: Technology | |
| SubSector: Information Technology Services | |
| MarketCap: 106627 Millions | |
| Recent Price: 316.06 Smart Investing & Trading Score: 25 | |
| Day Percent Change: 0.02% Day Change: 0.06 | |
| Week Change: 0.21% Year-to-date Change: -9.9% | |
| ACN Links: Profile News Message Board | |
| Charts:- Daily , Weekly | |
| Add ACN to Watchlist: View: Get Complete ACN Trend Analysis ➞ | |
 | CCOI Cogent Communications Holdings, Inc. |
| Sector: Technology | |
| SubSector: Diversified Communication Services | |
| MarketCap: 3868.14 Millions | |
| Recent Price: 63.13 Smart Investing & Trading Score: 30 | |
| Day Percent Change: -0.01% Day Change: -0.01 | |
| Week Change: 0.2% Year-to-date Change: -17.0% | |
| CCOI Links: Profile News Message Board | |
| Charts:- Daily , Weekly | |
| Add CCOI to Watchlist: View: Get Complete CCOI Trend Analysis ➞ | |
 | YMM Full Truck Alliance Co. Ltd. |
| Sector: Technology | |
| SubSector: Software - Application | |
| MarketCap: 6960 Millions | |
| Recent Price: 7.72 Smart Investing & Trading Score: 93 | |
| Day Percent Change: 1.38% Day Change: 0.10 | |
| Week Change: 0.19% Year-to-date Change: 10.4% | |
| YMM Links: Profile News Message Board | |
| Charts:- Daily , Weekly | |
| Add YMM to Watchlist: View: Get Complete YMM Trend Analysis ➞ | |
 | DOX Amdocs Limited |
| Sector: Technology | |
| SubSector: Business Software & Services | |
| MarketCap: 6895.48 Millions | |
| Recent Price: 85.85 Smart Investing & Trading Score: 32 | |
| Day Percent Change: 0.87% Day Change: 0.74 | |
| Week Change: 0.16% Year-to-date Change: -2.3% | |
| DOX Links: Profile News Message Board | |
| Charts:- Daily , Weekly | |
| Add DOX to Watchlist: View: Get Complete DOX Trend Analysis ➞ | |
 | SKM SK Telecom Co.,Ltd |
| Sector: Technology | |
| SubSector: Wireless Communications | |
| MarketCap: 12332.1 Millions | |
| Recent Price: 20.04 Smart Investing & Trading Score: 18 | |
| Day Percent Change: -0.20% Day Change: -0.04 | |
| Week Change: 0.15% Year-to-date Change: -6.4% | |
| SKM Links: Profile News Message Board | |
| Charts:- Daily , Weekly | |
| Add SKM to Watchlist: View: Get Complete SKM Trend Analysis ➞ | |
 | ARQQ Arqit Quantum Inc. |
| Sector: Technology | |
| SubSector: Software - Infrastructure | |
| MarketCap: 165 Millions | |
| Recent Price: 0.50 Smart Investing & Trading Score: 46 | |
| Day Percent Change: -1.97% Day Change: -0.01 | |
| Week Change: 0.06% Year-to-date Change: 8.8% | |
| ARQQ Links: Profile News Message Board | |
| Charts:- Daily , Weekly | |
| Add ARQQ to Watchlist: View: Get Complete ARQQ Trend Analysis ➞ | |
 | ESTC Elastic N.V. |
| Sector: Technology | |
| SubSector: Application Software | |
| MarketCap: 4420.92 Millions | |
| Recent Price: 97.29 Smart Investing & Trading Score: 42 | |
| Day Percent Change: 2.08% Day Change: 1.98 | |
| Week Change: 0.05% Year-to-date Change: -13.7% | |
| ESTC Links: Profile News Message Board | |
| Charts:- Daily , Weekly | |
| Add ESTC to Watchlist: View: Get Complete ESTC Trend Analysis ➞ | |
 | EVBG Everbridge, Inc. |
| Sector: Technology | |
| SubSector: Application Software | |
| MarketCap: 3697.92 Millions | |
| Recent Price: 34.88 Smart Investing & Trading Score: 61 | |
| Day Percent Change: -0.01% Day Change: -0.01 | |
| Week Change: 0.04% Year-to-date Change: 43.5% | |
| EVBG Links: Profile News Message Board | |
| Charts:- Daily , Weekly | |
| Add EVBG to Watchlist: View: Get Complete EVBG Trend Analysis ➞ | |
 | CACI CACI International Inc |
| Sector: Technology | |
| SubSector: Information Technology Services | |
| MarketCap: 5211.58 Millions | |
| Recent Price: 367.84 Smart Investing & Trading Score: 49 | |
| Day Percent Change: 1.04% Day Change: 3.78 | |
| Week Change: 0.03% Year-to-date Change: 13.6% | |
| CACI Links: Profile News Message Board | |
| Charts:- Daily , Weekly | |
| Add CACI to Watchlist: View: Get Complete CACI Trend Analysis ➞ | |
 | SY So-Young International Inc. |
| Sector: Technology | |
| SubSector: Healthcare Information Services | |
| MarketCap: 1000.55 Millions | |
| Recent Price: 1.17 Smart Investing & Trading Score: 83 | |
| Day Percent Change: -2.50% Day Change: -0.03 | |
| Week Change: 0% Year-to-date Change: -9.3% | |
| SY Links: Profile News Message Board | |
| Charts:- Daily , Weekly | |
| Add SY to Watchlist: View: Get Complete SY Trend Analysis ➞ | |
 | SNX SYNNEX Corporation |
| Sector: Technology | |
| SubSector: Information Technology Services | |
| MarketCap: 4519.48 Millions | |
| Recent Price: 113.14 Smart Investing & Trading Score: 51 | |
| Day Percent Change: -0.54% Day Change: -0.61 | |
| Week Change: -0.01% Year-to-date Change: 5.1% | |
| SNX Links: Profile News Message Board | |
| Charts:- Daily , Weekly | |
| Add SNX to Watchlist: View: Get Complete SNX Trend Analysis ➞ | |
 | KE Kimball Electronics, Inc. |
| Sector: Technology | |
| SubSector: Diversified Electronics | |
| MarketCap: 308.896 Millions | |
| Recent Price: 20.70 Smart Investing & Trading Score: 27 | |
| Day Percent Change: -1.10% Day Change: -0.23 | |
| Week Change: -0.05% Year-to-date Change: -23.2% | |
| KE Links: Profile News Message Board | |
| Charts:- Daily , Weekly | |
| Add KE to Watchlist: View: Get Complete KE Trend Analysis ➞ | |
 | MLNK MeridianLink, Inc. |
| Sector: Technology | |
| SubSector: Software - Application | |
| MarketCap: 1630 Millions | |
| Recent Price: 17.12 Smart Investing & Trading Score: 17 | |
| Day Percent Change: -2.17% Day Change: -0.38 | |
| Week Change: -0.06% Year-to-date Change: -30.9% | |
| MLNK Links: Profile News Message Board | |
| Charts:- Daily , Weekly | |
| Add MLNK to Watchlist: View: Get Complete MLNK Trend Analysis ➞ | |
 | NSIT Insight Enterprises, Inc. |
| Sector: Technology | |
| SubSector: Information Technology Services | |
| MarketCap: 1498.48 Millions | |
| Recent Price: 182.55 Smart Investing & Trading Score: 25 | |
| Day Percent Change: 0.86% Day Change: 1.55 | |
| Week Change: -0.07% Year-to-date Change: 3.0% | |
| NSIT Links: Profile News Message Board | |
| Charts:- Daily , Weekly | |
| Add NSIT to Watchlist: View: Get Complete NSIT Trend Analysis ➞ | |
 | SMI Semiconductor Manufacturing International Corporation |
| Sector: Technology | |
| SubSector: Semiconductor - Integrated Circuits | |
| MarketCap: 6287.56 Millions | |
| Recent Price: 45.67 Smart Investing & Trading Score: 36 | |
| Day Percent Change: -0.05% Day Change: -0.02 | |
| Week Change: -0.07% Year-to-date Change: -1.7% | |
| SMI Links: Profile News Message Board | |
| Charts:- Daily , Weekly | |
| Add SMI to Watchlist: View: Get Complete SMI Trend Analysis ➞ | |
 | COGT Cogint, Inc. |
| Sector: Technology | |
| SubSector: Business Software & Services | |
| MarketCap: 214.55 Millions | |
| Recent Price: 6.50 Smart Investing & Trading Score: 12 | |
| Day Percent Change: -1.59% Day Change: -0.11 | |
| Week Change: -0.08% Year-to-date Change: 10.6% | |
| COGT Links: Profile News Message Board | |
| Charts:- Daily , Weekly | |
| Add COGT to Watchlist: View: Get Complete COGT Trend Analysis ➞ | |
 | LBTYK Liberty Global plc |
| Sector: Technology | |
| SubSector: CATV Systems | |
| MarketCap: 7253.02 Millions | |
| Recent Price: 17.30 Smart Investing & Trading Score: 42 | |
| Day Percent Change: 0.67% Day Change: 0.12 | |
| Week Change: -0.09% Year-to-date Change: -7.2% | |
| LBTYK Links: Profile News Message Board | |
| Charts:- Daily , Weekly | |
| Add LBTYK to Watchlist: View: Get Complete LBTYK Trend Analysis ➞ | |
 | TU TELUS Corporation |
| Sector: Technology | |
| SubSector: Wireless Communications | |
| MarketCap: 10864.7 Millions | |
| Recent Price: 15.84 Smart Investing & Trading Score: 52 | |
| Day Percent Change: 0.35% Day Change: 0.06 | |
| Week Change: -0.09% Year-to-date Change: -11.0% | |
| TU Links: Profile News Message Board | |
| Charts:- Daily , Weekly | |
| Add TU to Watchlist: View: Get Complete TU Trend Analysis ➞ | |
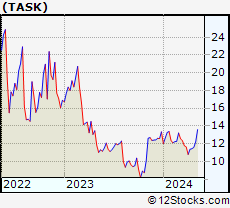 | TASK TaskUs, Inc. |
| Sector: Technology | |
| SubSector: Information Technology Services | |
| MarketCap: 1050 Millions | |
| Recent Price: 11.36 Smart Investing & Trading Score: 37 | |
| Day Percent Change: 2.53% Day Change: 0.28 | |
| Week Change: -0.09% Year-to-date Change: -14.8% | |
| TASK Links: Profile News Message Board | |
| Charts:- Daily , Weekly | |
| Add TASK to Watchlist: View: Get Complete TASK Trend Analysis ➞ | |
 | OSPN OneSpan Inc. |
| Sector: Technology | |
| SubSector: Application Software | |
| MarketCap: 657.762 Millions | |
| Recent Price: 10.01 Smart Investing & Trading Score: 35 | |
| Day Percent Change: 0.91% Day Change: 0.09 | |
| Week Change: -0.1% Year-to-date Change: -6.6% | |
| OSPN Links: Profile News Message Board | |
| Charts:- Daily , Weekly | |
| Add OSPN to Watchlist: View: Get Complete OSPN Trend Analysis ➞ | |
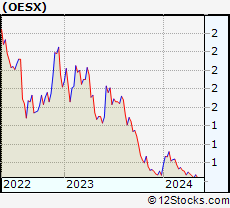 | OESX Orion Energy Systems, Inc. |
| Sector: Technology | |
| SubSector: Diversified Electronics | |
| MarketCap: 121.396 Millions | |
| Recent Price: 0.88 Smart Investing & Trading Score: 35 | |
| Day Percent Change: 1.50% Day Change: 0.01 | |
| Week Change: -0.11% Year-to-date Change: 1.4% | |
| OESX Links: Profile News Message Board | |
| Charts:- Daily , Weekly | |
| Add OESX to Watchlist: View: Get Complete OESX Trend Analysis ➞ | |
 | JFIN Jiayin Group Inc. |
| Sector: Technology | |
| SubSector: Internet Information Providers | |
| MarketCap: 131.48 Millions | |
| Recent Price: 6.45 Smart Investing & Trading Score: 58 | |
| Day Percent Change: 1.49% Day Change: 0.09 | |
| Week Change: -0.15% Year-to-date Change: 24.5% | |
| JFIN Links: Profile News Message Board | |
| Charts:- Daily , Weekly | |
| Add JFIN to Watchlist: View: Get Complete JFIN Trend Analysis ➞ | |
 | DSGX The Descartes Systems Group Inc |
| Sector: Technology | |
| SubSector: Business Software & Services | |
| MarketCap: 2830.58 Millions | |
| Recent Price: 89.90 Smart Investing & Trading Score: 48 | |
| Day Percent Change: -0.26% Day Change: -0.23 | |
| Week Change: -0.17% Year-to-date Change: 7.0% | |
| DSGX Links: Profile News Message Board | |
| Charts:- Daily , Weekly | |
| Add DSGX to Watchlist: View: Get Complete DSGX Trend Analysis ➞ | |
 | HSTM HealthStream, Inc. |
| Sector: Technology | |
| SubSector: Healthcare Information Services | |
| MarketCap: 770.255 Millions | |
| Recent Price: 24.71 Smart Investing & Trading Score: 17 | |
| Day Percent Change: 3.00% Day Change: 0.72 | |
| Week Change: -0.2% Year-to-date Change: -8.6% | |
| HSTM Links: Profile News Message Board | |
| Charts:- Daily , Weekly | |
| Add HSTM to Watchlist: View: Get Complete HSTM Trend Analysis ➞ | |
| For tabular summary view of above stock list: Summary View ➞ 0 - 25 , 25 - 50 , 50 - 75 , 75 - 100 , 100 - 125 , 125 - 150 , 150 - 175 , 175 - 200 , 200 - 225 , 225 - 250 , 250 - 275 , 275 - 300 , 300 - 325 , 325 - 350 , 350 - 375 , 375 - 400 , 400 - 425 , 425 - 450 , 450 - 475 , 475 - 500 , 500 - 525 , 525 - 550 , 550 - 575 , 575 - 600 , 600 - 625 , 625 - 650 | ||
| Click To Change The Sort Order: By Market Cap or Company Size Performance: Year-to-date, Week and Day | |
| Select Chart Type: | ||
|
Best Stocks Today 12Stocks.com |
© 2024 12Stocks.com Terms & Conditions Privacy Contact Us
All Information Provided Only For Education And Not To Be Used For Investing or Trading. See Terms & Conditions


One More Thing ... Get Best Stocks Delivered Daily!
Never Ever Miss A Move With Our Top Ten Stocks Lists
Find Best Stocks In Any Market - Bull or Bear Market
Take A Peek At Our Top Ten Stocks Lists: Daily, Weekly, Year-to-Date & Top Trends
Find Best Stocks In Any Market - Bull or Bear Market
Take A Peek At Our Top Ten Stocks Lists: Daily, Weekly, Year-to-Date & Top Trends
Technology Stocks With Best Up Trends [0-bearish to 100-bullish]: Cricut [100], Karooooo [100], Payoneer Global[100], Badger Meter[100], Turkcell Iletisim[93], Zuora [93], Full Truck[93], Grab [93], GigaCloud [88], GDS [88], So-Young [83]
Best Technology Stocks Year-to-Date:
MediaCo Holding[544.37%], Smith Micro[163.32%], CXApp [157.92%], Super Micro[155.54%], Uxin [141.08%], CuriosityStream [107.37%], GigaCloud [95.49%], MicroStrategy [87.95%], NextNav [78.88%], D-Wave Quantum[74.38%], AppLovin [67.63%] Best Technology Stocks This Week:
Snap One[29.61%], Badger Meter[15.82%], Mynaric AG[11.76%], Expensify [10.2%], SYLA [9.96%], Iridium [9.53%], Zuora [9.36%], Quhuo [8.87%], Encore Wire[8.81%], Bentley Systems[7.96%], NextNav [7.42%] Best Technology Stocks Daily:
CuriosityStream [10.89%], Markforged Holding[6.04%], CXApp [5.36%], Cheetah Mobile[4.15%], Tigo Energy[3.86%], Cricut [3.69%], Iridium [3.68%], MediaCo Holding[3.58%], Karooooo [3.20%], HealthStream [3.00%], DXC [2.86%]