
 Login Sign Up


| |||||
 |  | ||||

| 12Stocks.com Market Intelligence |
Best SmallCap Stocks
|
| In a hurry? Small Cap Stock Lists: Performance Trends Table, Stock Charts
Sort Small Cap stocks: Daily, Weekly, Year-to-Date, Market Cap & Trends. Filter Small Cap stocks list by sector: Show all, Tech, Finance, Energy, Staples, Retail, Industrial, Materials, Utilities and HealthCare Filter Small Cap stocks list by size: All Large Medium Small and MicroCap |
| 12Stocks.com Small Cap Stocks Performances & Trends Daily | |||||||||
|
|  The overall Smart Investing & Trading Score is 49 (0-bearish to 100-bullish) which puts Small Cap index in short term neutral trend. The Smart Investing & Trading Score from previous trading session is 14 and hence an improvement of trend.
| ||||||||
Here are the Smart Investing & Trading Scores of the most requested small cap stocks at 12Stocks.com (click stock name for detailed review):
|


| 12Stocks.com: Investing in Smallcap Index with Stocks | |
|
The following table helps investors and traders sort through current performance and trends (as measured by Smart Investing & Trading Score) of various
stocks in the Smallcap Index. Quick View: Move mouse or cursor over stock symbol (ticker) to view short-term technical chart and over stock name to view long term chart. Click on  to add stock symbol to your watchlist and to add stock symbol to your watchlist and  to view watchlist. Click on any ticker or stock name for detailed market intelligence report for that stock. to view watchlist. Click on any ticker or stock name for detailed market intelligence report for that stock. |
12Stocks.com Performance of Stocks in Smallcap Index
| Ticker | Stock Name | Watchlist | Category | Recent Price | Smart Investing & Trading Score | Change % | YTD Change% |
| SKIN | Beauty Health |   | Consumer Staples | 3.35 | 34 | 5.68% | 5.85% |
| HNI | HNI | | Consumer Staples | 43.96 | 57 | 1.41% | 5.09% |
| HBI | Hanesbrands | | Consumer Staples | 4.68 | 32 | 0.21% | 4.93% |
| EPC | Edgewell Personal | | Consumer Staples | 38.25 | 82 | 0.74% | 4.42% |
| COCO | Vita Coco | | Consumer Staples | 26.84 | 100 | -0.33% | 4.23% |
| LMNR | Limoneira | | Consumer Staples | 21.45 | 100 | 0.00% | 3.97% |
| AMWD | American Woodmark | | Consumer Staples | 96.29 | 32 | 3.13% | 3.70% |
| WEST | Westrock Coffee | | Consumer Staples | 10.53 | 100 | 1.01% | 3.64% |
| STKL | SunOpta | | Consumer Staples | 5.61 | 0 | 2.28% | 2.47% |
| SNBR | Sleep Number | | Consumer Staples | 15.18 | 33 | 11.86% | 2.36% |
| MPX | Marine Products | | Consumer Staples | 11.60 | 42 | 1.93% | 1.75% |
| CALM | Cal-Maine Foods | | Consumer Staples | 57.27 | 48 | -0.43% | -0.20% |
| CLAR | Clarus | | Consumer Staples | 6.88 | 58 | 11.69% | -0.22% |
| DOLE | Dole | | Consumer Staples | 12.30 | 68 | 0.53% | -0.28% |
| THRM | Gentherm | | Consumer Staples | 51.81 | 49 | 0.61% | -1.06% |
| ALCO | Alico | | Consumer Staples | 28.70 | 81 | 0.00% | -1.31% |
| CVGW | Calavo Growers | | Consumer Staples | 28.91 | 87 | 0.00% | -1.70% |
| ANDE | Andersons | | Consumer Staples | 56.37 | 43 | 0.62% | -2.03% |
| JBSS | John B. | | Consumer Staples | 100.86 | 50 | -0.50% | -2.12% |
| AFRI | Forafric Global | | Consumer Staples | 10.30 | 65 | -1.72% | -2.74% |
| SHOO | Steven Madden | | Consumer Staples | 40.56 | 30 | 1.12% | -3.43% |
| GEF | Greif | | Consumer Staples | 62.68 | 32 | 0.64% | -4.44% |
| WEYS | Weyco Group | | Consumer Staples | 29.69 | 64 | 0.00% | -5.33% |
| FIZZ | National Beverage | | Consumer Staples | 47.02 | 67 | 0.26% | -5.43% |
| HY | Hyster-Yale Materials | | Consumer Staples | 58.59 | 10 | 0.58% | -5.79% |
| For chart view version of above stock list: Chart View ➞ 0 - 25 , 25 - 50 , 50 - 75 , 75 - 100 , 100 - 125 | ||
 | Click To Change The Sort Order: By Market Cap or Company Size Performance: Year-to-date, Week and Day |  |
| Too many stocks? View smallcap stocks filtered by marketcap & sector |
| Marketcap: All SmallCap Stocks (default-no microcap), Large, Mid-Range, Small |
| Smallcap Sector: Tech, Finance, Energy, Staples, Retail, Industrial, Materials, & Medical |
|
Get the most comprehensive stock market coverage daily at 12Stocks.com ➞ Best Stocks Today ➞ Best Stocks Weekly ➞ Best Stocks Year-to-Date ➞ Best Stocks Trends ➞  Best Stocks Today 12Stocks.com Best Nasdaq Stocks ➞ Best S&P 500 Stocks ➞ Best Tech Stocks ➞ Best Biotech Stocks ➞ |
| Detailed Overview of SmallCap Stocks |
| SmallCap Technical Overview, Leaders & Laggards, Top SmallCap ETF Funds & Detailed SmallCap Stocks List, Charts, Trends & More |
| Smallcap: Technical Analysis, Trends & YTD Performance | |
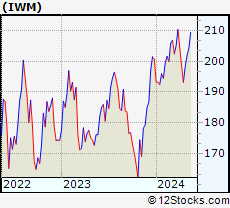
| SmallCap segment as represented by
IWM, an exchange-traded fund [ETF], holds basket of thousands of smallcap stocks from across all major sectors of the US stock market. The smallcap index (contains stocks like Riverbed & Sotheby's) is up by 1.11% and is currently underperforming the overall market by -5.68% year-to-date. Below is a quick view of technical charts and trends: | |
 IWM Weekly Chart |
|
| Long Term Trend: Not Good | |
| Medium Term Trend: Good | |
 IWM Daily Chart |
|
| Short Term Trend: Deteriorating | |
| Overall Trend Score: 49 | |
| YTD Performance: 1.11% | |
| **Trend Scores & Views Are Only For Educational Purposes And Not For Investing | |
| 12Stocks.com: Top Performing Small Cap Index Stocks | ||||||||||||||||||||||||||||||||||||||||||||||||
 The top performing Small Cap Index stocks year to date are
Now, more recently, over last week, the top performing Small Cap Index stocks on the move are


|
||||||||||||||||||||||||||||||||||||||||||||||||
| 12Stocks.com: Investing in Smallcap Index using Exchange Traded Funds | |
|
The following table shows list of key exchange traded funds (ETF) that
help investors track Smallcap index. The following list also includes leveraged ETF funds that track twice or thrice the daily returns of Smallcap indices. Short or inverse ETF funds move in the opposite direction to the index they track and are useful during market pullbacks or during bear markets. Quick View: Move mouse or cursor over ETF symbol (ticker) to view short-term technical chart and over ETF name to view long term chart. Click on ticker or stock name for detailed view. Click on to add stock symbol to your watchlist and to view watchlist. |
12Stocks.com List of ETFs that track Smallcap Index
| Ticker | ETF Name | Watchlist | Recent Price | Smart Investing & Trading Score | Change % | Week % | Year-to-date % |
| IWM | iShares Russell 2000 | | 202.94 | 49 | 1.51 | 2.29 | 1.11% |
| SDD | ProShares UltraShort SmallCap600 | | 18.35 | 56 | -4.97 | -5.17 | -0.42% |
| SBB | ProShares Short SmallCap600 | | 16.33 | 49 | -0.25 | -0.34 | 2.51% |
| SAA | ProShares Ultra SmallCap600 | | 23.93 | 42 | 4.36 | 3.88 | -4.07% |
| 12Stocks.com: Charts, Trends, Fundamental Data and Performances of SmallCap Stocks | |
|
We now take in-depth look at all SmallCap stocks including charts, multi-period performances and overall trends (as measured by Smart Investing & Trading Score). One can sort SmallCap stocks (click link to choose) by Daily, Weekly and by Year-to-Date performances. Also, one can sort by size of the company or by market capitalization. |
| Select Your Default Chart Type: | |||||
| |||||
| Click on stock symbol or name for detailed view. Click on to add stock symbol to your watchlist and to view watchlist. Quick View: Move mouse or cursor over "Daily" to quickly view daily technical stock chart and over "Weekly" to view weekly technical stock chart. | |||||

 | SKIN The Beauty Health Company |
| Sector: Consumer Staples | |
| SubSector: Household & Personal Products | |
| MarketCap: 1070 Millions | |
| Recent Price: 3.35 Smart Investing & Trading Score: 34 | |
| Day Percent Change: 5.68% Day Change: 0.18 | |
| Week Change: 3.72% Year-to-date Change: 5.9% | |
| SKIN Links: Profile News Message Board | |
| Charts:- Daily , Weekly | |
| Add SKIN to Watchlist: View: Get Complete SKIN Trend Analysis ➞ | |
 | HNI HNI Corporation |
| Sector: Consumer Staples | |
| SubSector: Business Equipment | |
| MarketCap: 1053.67 Millions | |
| Recent Price: 43.96 Smart Investing & Trading Score: 57 | |
| Day Percent Change: 1.41% Day Change: 0.61 | |
| Week Change: 3.44% Year-to-date Change: 5.1% | |
| HNI Links: Profile News Message Board | |
| Charts:- Daily , Weekly | |
| Add HNI to Watchlist: View: Get Complete HNI Trend Analysis ➞ | |
 | HBI Hanesbrands Inc. |
| Sector: Consumer Staples | |
| SubSector: Textile - Apparel Clothing | |
| MarketCap: 3559.75 Millions | |
| Recent Price: 4.68 Smart Investing & Trading Score: 32 | |
| Day Percent Change: 0.21% Day Change: 0.01 | |
| Week Change: 4.46% Year-to-date Change: 4.9% | |
| HBI Links: Profile News Message Board | |
| Charts:- Daily , Weekly | |
| Add HBI to Watchlist: View: Get Complete HBI Trend Analysis ➞ | |
 | EPC Edgewell Personal Care Company |
| Sector: Consumer Staples | |
| SubSector: Personal Products | |
| MarketCap: 1605.95 Millions | |
| Recent Price: 38.25 Smart Investing & Trading Score: 82 | |
| Day Percent Change: 0.74% Day Change: 0.28 | |
| Week Change: 2.19% Year-to-date Change: 4.4% | |
| EPC Links: Profile News Message Board | |
| Charts:- Daily , Weekly | |
| Add EPC to Watchlist: View: Get Complete EPC Trend Analysis ➞ | |
 | COCO The Vita Coco Company, Inc. |
| Sector: Consumer Staples | |
| SubSector: Beverages - Non-Alcoholic | |
| MarketCap: 1510 Millions | |
| Recent Price: 26.84 Smart Investing & Trading Score: 100 | |
| Day Percent Change: -0.33% Day Change: -0.09 | |
| Week Change: 8.53% Year-to-date Change: 4.2% | |
| COCO Links: Profile News Message Board | |
| Charts:- Daily , Weekly | |
| Add COCO to Watchlist: View: Get Complete COCO Trend Analysis ➞ | |
 | LMNR Limoneira Company |
| Sector: Consumer Staples | |
| SubSector: Farm Products | |
| MarketCap: 324.987 Millions | |
| Recent Price: 21.45 Smart Investing & Trading Score: 100 | |
| Day Percent Change: 0.00% Day Change: 0.00 | |
| Week Change: 8.06% Year-to-date Change: 4.0% | |
| LMNR Links: Profile News Message Board | |
| Charts:- Daily , Weekly | |
| Add LMNR to Watchlist: View: Get Complete LMNR Trend Analysis ➞ | |
 | AMWD American Woodmark Corporation |
| Sector: Consumer Staples | |
| SubSector: Home Furnishings & Fixtures | |
| MarketCap: 958.435 Millions | |
| Recent Price: 96.29 Smart Investing & Trading Score: 32 | |
| Day Percent Change: 3.13% Day Change: 2.92 | |
| Week Change: 3.63% Year-to-date Change: 3.7% | |
| AMWD Links: Profile News Message Board | |
| Charts:- Daily , Weekly | |
| Add AMWD to Watchlist: View: Get Complete AMWD Trend Analysis ➞ | |
 | WEST Westrock Coffee Company, LLC |
| Sector: Consumer Staples | |
| SubSector: Packaged Foods | |
| MarketCap: 799 Millions | |
| Recent Price: 10.53 Smart Investing & Trading Score: 100 | |
| Day Percent Change: 1.01% Day Change: 0.10 | |
| Week Change: 5.09% Year-to-date Change: 3.6% | |
| WEST Links: Profile News Message Board | |
| Charts:- Daily , Weekly | |
| Add WEST to Watchlist: View: Get Complete WEST Trend Analysis ➞ | |
 | STKL SunOpta Inc. |
| Sector: Consumer Staples | |
| SubSector: Processed & Packaged Goods | |
| MarketCap: 174.548 Millions | |
| Recent Price: 5.61 Smart Investing & Trading Score: 0 | |
| Day Percent Change: 2.28% Day Change: 0.13 | |
| Week Change: -16.22% Year-to-date Change: 2.5% | |
| STKL Links: Profile News Message Board | |
| Charts:- Daily , Weekly | |
| Add STKL to Watchlist: View: Get Complete STKL Trend Analysis ➞ | |
 | SNBR Sleep Number Corporation |
| Sector: Consumer Staples | |
| SubSector: Home Furnishings & Fixtures | |
| MarketCap: 692.735 Millions | |
| Recent Price: 15.18 Smart Investing & Trading Score: 33 | |
| Day Percent Change: 11.86% Day Change: 1.61 | |
| Week Change: 7.05% Year-to-date Change: 2.4% | |
| SNBR Links: Profile News Message Board | |
| Charts:- Daily , Weekly | |
| Add SNBR to Watchlist: View: Get Complete SNBR Trend Analysis ➞ | |
 | MPX Marine Products Corporation |
| Sector: Consumer Staples | |
| SubSector: Recreational Vehicles | |
| MarketCap: 316.059 Millions | |
| Recent Price: 11.60 Smart Investing & Trading Score: 42 | |
| Day Percent Change: 1.93% Day Change: 0.22 | |
| Week Change: 0.87% Year-to-date Change: 1.8% | |
| MPX Links: Profile News Message Board | |
| Charts:- Daily , Weekly | |
| Add MPX to Watchlist: View: Get Complete MPX Trend Analysis ➞ | |
 | CALM Cal-Maine Foods, Inc. |
| Sector: Consumer Staples | |
| SubSector: Food - Major Diversified | |
| MarketCap: 2177.13 Millions | |
| Recent Price: 57.27 Smart Investing & Trading Score: 48 | |
| Day Percent Change: -0.43% Day Change: -0.25 | |
| Week Change: 0.71% Year-to-date Change: -0.2% | |
| CALM Links: Profile News Message Board | |
| Charts:- Daily , Weekly | |
| Add CALM to Watchlist: View: Get Complete CALM Trend Analysis ➞ | |
 | CLAR Clarus Corporation |
| Sector: Consumer Staples | |
| SubSector: Sporting Goods | |
| MarketCap: 290.144 Millions | |
| Recent Price: 6.88 Smart Investing & Trading Score: 58 | |
| Day Percent Change: 11.69% Day Change: 0.72 | |
| Week Change: 9.55% Year-to-date Change: -0.2% | |
| CLAR Links: Profile News Message Board | |
| Charts:- Daily , Weekly | |
| Add CLAR to Watchlist: View: Get Complete CLAR Trend Analysis ➞ | |
 | DOLE Dole plc |
| Sector: Consumer Staples | |
| SubSector: Farm Products | |
| MarketCap: 1300 Millions | |
| Recent Price: 12.30 Smart Investing & Trading Score: 68 | |
| Day Percent Change: 0.53% Day Change: 0.07 | |
| Week Change: 0.99% Year-to-date Change: -0.3% | |
| DOLE Links: Profile News Message Board | |
| Charts:- Daily , Weekly | |
| Add DOLE to Watchlist: View: Get Complete DOLE Trend Analysis ➞ | |
 | THRM Gentherm Incorporated |
| Sector: Consumer Staples | |
| SubSector: Auto Parts | |
| MarketCap: 1032.59 Millions | |
| Recent Price: 51.81 Smart Investing & Trading Score: 49 | |
| Day Percent Change: 0.61% Day Change: 0.31 | |
| Week Change: 2.4% Year-to-date Change: -1.1% | |
| THRM Links: Profile News Message Board | |
| Charts:- Daily , Weekly | |
| Add THRM to Watchlist: View: Get Complete THRM Trend Analysis ➞ | |
 | ALCO Alico, Inc. |
| Sector: Consumer Staples | |
| SubSector: Farm Products | |
| MarketCap: 221.187 Millions | |
| Recent Price: 28.70 Smart Investing & Trading Score: 81 | |
| Day Percent Change: 0.00% Day Change: 0.00 | |
| Week Change: -0.24% Year-to-date Change: -1.3% | |
| ALCO Links: Profile News Message Board | |
| Charts:- Daily , Weekly | |
| Add ALCO to Watchlist: View: Get Complete ALCO Trend Analysis ➞ | |
 | CVGW Calavo Growers, Inc. |
| Sector: Consumer Staples | |
| SubSector: Farm Products | |
| MarketCap: 935.287 Millions | |
| Recent Price: 28.91 Smart Investing & Trading Score: 87 | |
| Day Percent Change: 0.00% Day Change: 0.00 | |
| Week Change: 6.96% Year-to-date Change: -1.7% | |
| CVGW Links: Profile News Message Board | |
| Charts:- Daily , Weekly | |
| Add CVGW to Watchlist: View: Get Complete CVGW Trend Analysis ➞ | |
 | ANDE The Andersons, Inc. |
| Sector: Consumer Staples | |
| SubSector: Farm Products | |
| MarketCap: 630.887 Millions | |
| Recent Price: 56.37 Smart Investing & Trading Score: 43 | |
| Day Percent Change: 0.62% Day Change: 0.35 | |
| Week Change: -0.95% Year-to-date Change: -2.0% | |
| ANDE Links: Profile News Message Board | |
| Charts:- Daily , Weekly | |
| Add ANDE to Watchlist: View: Get Complete ANDE Trend Analysis ➞ | |
 | JBSS John B. Sanfilippo & Son, Inc. |
| Sector: Consumer Staples | |
| SubSector: Processed & Packaged Goods | |
| MarketCap: 899.748 Millions | |
| Recent Price: 100.86 Smart Investing & Trading Score: 50 | |
| Day Percent Change: -0.50% Day Change: -0.51 | |
| Week Change: 1.61% Year-to-date Change: -2.1% | |
| JBSS Links: Profile News Message Board | |
| Charts:- Daily , Weekly | |
| Add JBSS to Watchlist: View: Get Complete JBSS Trend Analysis ➞ | |
 | AFRI Forafric Global PLC |
| Sector: Consumer Staples | |
| SubSector: Farm Products | |
| MarketCap: 295 Millions | |
| Recent Price: 10.30 Smart Investing & Trading Score: 65 | |
| Day Percent Change: -1.72% Day Change: -0.18 | |
| Week Change: -1.25% Year-to-date Change: -2.7% | |
| AFRI Links: Profile News Message Board | |
| Charts:- Daily , Weekly | |
| Add AFRI to Watchlist: View: Get Complete AFRI Trend Analysis ➞ | |
 | SHOO Steven Madden, Ltd. |
| Sector: Consumer Staples | |
| SubSector: Textile - Apparel Footwear & Accessories | |
| MarketCap: 1756.3 Millions | |
| Recent Price: 40.56 Smart Investing & Trading Score: 30 | |
| Day Percent Change: 1.12% Day Change: 0.45 | |
| Week Change: 0.2% Year-to-date Change: -3.4% | |
| SHOO Links: Profile News Message Board | |
| Charts:- Daily , Weekly | |
| Add SHOO to Watchlist: View: Get Complete SHOO Trend Analysis ➞ | |
 | GEF Greif, Inc. |
| Sector: Consumer Staples | |
| SubSector: Packaging & Containers | |
| MarketCap: 1563.03 Millions | |
| Recent Price: 62.68 Smart Investing & Trading Score: 32 | |
| Day Percent Change: 0.64% Day Change: 0.40 | |
| Week Change: 1.23% Year-to-date Change: -4.4% | |
| GEF Links: Profile News Message Board | |
| Charts:- Daily , Weekly | |
| Add GEF to Watchlist: View: Get Complete GEF Trend Analysis ➞ | |
 | WEYS Weyco Group, Inc. |
| Sector: Consumer Staples | |
| SubSector: Textile - Apparel Footwear & Accessories | |
| MarketCap: 198.87 Millions | |
| Recent Price: 29.69 Smart Investing & Trading Score: 64 | |
| Day Percent Change: 0.00% Day Change: 0.00 | |
| Week Change: 1.61% Year-to-date Change: -5.3% | |
| WEYS Links: Profile News Message Board | |
| Charts:- Daily , Weekly | |
| Add WEYS to Watchlist: View: Get Complete WEYS Trend Analysis ➞ | |
 | FIZZ National Beverage Corp. |
| Sector: Consumer Staples | |
| SubSector: Beverages - Soft Drinks | |
| MarketCap: 2031.4 Millions | |
| Recent Price: 47.02 Smart Investing & Trading Score: 67 | |
| Day Percent Change: 0.26% Day Change: 0.12 | |
| Week Change: 7.94% Year-to-date Change: -5.4% | |
| FIZZ Links: Profile News Message Board | |
| Charts:- Daily , Weekly | |
| Add FIZZ to Watchlist: View: Get Complete FIZZ Trend Analysis ➞ | |
 | HY Hyster-Yale Materials Handling, Inc. |
| Sector: Consumer Staples | |
| SubSector: Trucks & Other Vehicles | |
| MarketCap: 660 Millions | |
| Recent Price: 58.59 Smart Investing & Trading Score: 10 | |
| Day Percent Change: 0.58% Day Change: 0.34 | |
| Week Change: -0.15% Year-to-date Change: -5.8% | |
| HY Links: Profile News Message Board | |
| Charts:- Daily , Weekly | |
| Add HY to Watchlist: View: Get Complete HY Trend Analysis ➞ | |
| For tabular summary view of above stock list: Summary View ➞ 0 - 25 , 25 - 50 , 50 - 75 , 75 - 100 , 100 - 125 | ||
| Click To Change The Sort Order: By Market Cap or Company Size Performance: Year-to-date, Week and Day | |
| Select Chart Type: | ||
| Too many stocks? View smallcap stocks filtered by marketcap & sector |
| Marketcap: All SmallCap Stocks (default-no microcap), Large, Mid-Range, Small & MicroCap |
| Sector: Tech, Finance, Energy, Staples, Retail, Industrial, Materials, Utilities & Medical |
|
Best Stocks Today 12Stocks.com |
© 2024 12Stocks.com Terms & Conditions Privacy Contact Us
All Information Provided Only For Education And Not To Be Used For Investing or Trading. See Terms & Conditions


One More Thing ... Get Best Stocks Delivered Daily!
Never Ever Miss A Move With Our Top Ten Stocks Lists
Find Best Stocks In Any Market - Bull or Bear Market
Take A Peek At Our Top Ten Stocks Lists: Daily, Weekly, Year-to-Date & Top Trends
Find Best Stocks In Any Market - Bull or Bear Market
Take A Peek At Our Top Ten Stocks Lists: Daily, Weekly, Year-to-Date & Top Trends
Smallcap Stocks With Best Up Trends [0-bearish to 100-bullish]: Origin Materials[100], Clearfield [100], Fluence Energy[100], Emergent BioSolutions[100], TPI Composites[100], ALLETE [100], E.W. Scripps[100], Conduent [100], Cutera [100], Bloom Energy[100], Super Group[100]
Best Smallcap Stocks Year-to-Date:
Janux [458.63%], Longboard [289.77%], Alpine Immune[239.36%], Avidity Biosciences[198.01%], Bakkt [194.84%], Vera [187.73%], Cullinan Oncology[177.78%], Super Micro[177.56%], Arcutis Bio[169.66%], Y-mAbs [154.69%], Sana [148.85%] Best Smallcap Stocks This Week:
Emergent BioSolutions[88.54%], Deciphera [73.28%], Origin Materials[59.41%], Eyenovia [59.18%], Enovix [54.87%], Codexis [46.8%], Cue Biopharma[41.39%], WideOpenWest [41.07%], TPI Composites[40.65%], Seres [39.39%], Carvana Co[39.19%] Best Smallcap Stocks Daily:
WideOpenWest [29.16%], Alignment Healthcare[24.23%], Ardelyx [23.42%], Twist Bioscience[23.18%], El Pollo[21.45%], IES [20.21%], Vaxxinity [17.64%], Enovix [17.26%], Origin Materials[17.01%], Codexis [16.92%], Adtalem Global[16.86%]