
 Login Sign Up


| |||||
 |  | ||||

| 12Stocks.com Market Intelligence |
Best SmallCap Stocks
|
| In a hurry? Small Cap Stock Lists: Performance Trends Table, Stock Charts
Sort Small Cap stocks: Daily, Weekly, Year-to-Date, Market Cap & Trends. Filter Small Cap stocks list by sector: Show all, Tech, Finance, Energy, Staples, Retail, Industrial, Materials, Utilities and HealthCare Filter Small Cap stocks list by size: All Large Medium Small and MicroCap |
| 12Stocks.com Small Cap Stocks Performances & Trends Daily | |||||||||
|
|  The overall Smart Investing & Trading Score is 58 (0-bearish to 100-bullish) which puts Small Cap index in short term neutral trend. The Smart Investing & Trading Score from previous trading session is 63 and hence a deterioration of trend.
| ||||||||
Here are the Smart Investing & Trading Scores of the most requested small cap stocks at 12Stocks.com (click stock name for detailed review):
|


| 12Stocks.com: Investing in Smallcap Index with Stocks | |
|
The following table helps investors and traders sort through current performance and trends (as measured by Smart Investing & Trading Score) of various
stocks in the Smallcap Index. Quick View: Move mouse or cursor over stock symbol (ticker) to view short-term technical chart and over stock name to view long term chart. Click on  to add stock symbol to your watchlist and to add stock symbol to your watchlist and  to view watchlist. Click on any ticker or stock name for detailed market intelligence report for that stock. to view watchlist. Click on any ticker or stock name for detailed market intelligence report for that stock. |
12Stocks.com Performance of Stocks in Smallcap Index
| Ticker | Stock Name | Watchlist | Category | Recent Price | Smart Investing & Trading Score | Change % | YTD Change% |
| LIND | Lindblad Expeditions |   | Consumer Staples | 7.64 | 39 | 4.01 | -32.17% |
| VRA | Vera Bradley | | Consumer Staples | 6.81 | 49 | 2.87 | -11.56% |
| FL | Foot Locker | | Consumer Staples | 22.87 | 49 | 2.83 | -26.58% |
| XPEL | XPEL | | Consumer Staples | 55.96 | 68 | 2.72 | 3.92% |
| KTB | Kontoor Brands | | Consumer Staples | 61.86 | 75 | 2.71 | -0.90% |
| ADNT | Adient | | Consumer Staples | 29.69 | 42 | 2.59 | -18.34% |
| CLAR | Clarus | | Consumer Staples | 6.29 | 61 | 2.28 | -8.77% |
| MOD | Modine | | Consumer Staples | 90.99 | 70 | 2.18 | 52.41% |
| SENEA | Seneca Foods | | Consumer Staples | 58.36 | 80 | 2.08 | 11.29% |
| MBUU | Malibu Boats | | Consumer Staples | 34.70 | 25 | 2.03 | -36.70% |
| LMNR | Limoneira | | Consumer Staples | 20.11 | 80 | 2.00 | -2.54% |
| STKL | SunOpta | | Consumer Staples | 6.68 | 100 | 1.98 | 22.12% |
| WWW | Wolverine World | | Consumer Staples | 10.62 | 100 | 1.92 | 19.46% |
| COCO | Vita Coco | | Consumer Staples | 24.09 | 51 | 1.86 | -6.45% |
| LOVE | Lovesac | | Consumer Staples | 22.43 | 52 | 1.77 | -12.21% |
| NC | NACCO Industries | | Consumer Staples | 28.64 | 17 | 1.74 | -21.53% |
| SMPL | Simply Good | | Consumer Staples | 34.35 | 44 | 1.60 | -13.26% |
| VITL | Vital Farms | | Consumer Staples | 26.62 | 95 | 1.41 | 69.55% |
| EPC | Edgewell Personal | | Consumer Staples | 38.23 | 100 | 1.38 | 4.37% |
| WKHS | Workhorse Group | | Consumer Staples | 0.16 | 25 | 1.31 | -54.72% |
| COKE | Coca-Cola Consolidated | | Consumer Staples | 841.43 | 64 | 1.25 | -9.37% |
| MCFT | MasterCraft Boat | | Consumer Staples | 21.31 | 61 | 1.24 | -5.87% |
| VC | Visteon | | Consumer Staples | 111.08 | 67 | 1.16 | -11.06% |
| FNKO | Funko | | Consumer Staples | 6.18 | 67 | 1.15 | -20.05% |
| LANC | Lancaster Colony | | Consumer Staples | 188.96 | 51 | 1.12 | 13.56% |
| For chart view version of above stock list: Chart View ➞ 0 - 25 , 25 - 50 , 50 - 75 , 75 - 100 , 100 - 125 | ||
 | Click To Change The Sort Order: By Market Cap or Company Size Performance: Year-to-date, Week and Day |  |
| Too many stocks? View smallcap stocks filtered by marketcap & sector |
| Marketcap: All SmallCap Stocks (default-no microcap), Large, Mid-Range, Small |
| Smallcap Sector: Tech, Finance, Energy, Staples, Retail, Industrial, Materials, & Medical |
|
Get the most comprehensive stock market coverage daily at 12Stocks.com ➞ Best Stocks Today ➞ Best Stocks Weekly ➞ Best Stocks Year-to-Date ➞ Best Stocks Trends ➞  Best Stocks Today 12Stocks.com Best Nasdaq Stocks ➞ Best S&P 500 Stocks ➞ Best Tech Stocks ➞ Best Biotech Stocks ➞ |
| Detailed Overview of SmallCap Stocks |
| SmallCap Technical Overview, Leaders & Laggards, Top SmallCap ETF Funds & Detailed SmallCap Stocks List, Charts, Trends & More |
| Smallcap: Technical Analysis, Trends & YTD Performance | |
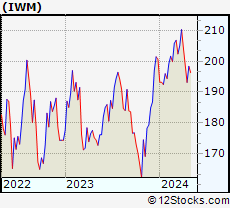
| SmallCap segment as represented by
IWM, an exchange-traded fund [ETF], holds basket of thousands of smallcap stocks from across all major sectors of the US stock market. The smallcap index (contains stocks like Riverbed & Sotheby's) is down by -1.51% and is currently underperforming the overall market by -7.17% year-to-date. Below is a quick view of technical charts and trends: | |
 IWM Weekly Chart |
|
| Long Term Trend: Good | |
| Medium Term Trend: Not Good | |
 IWM Daily Chart |
|
| Short Term Trend: Very Good | |
| Overall Trend Score: 58 | |
| YTD Performance: -1.51% | |
| **Trend Scores & Views Are Only For Educational Purposes And Not For Investing | |
| 12Stocks.com: Top Performing Small Cap Index Stocks | ||||||||||||||||||||||||||||||||||||||||||||||||
 The top performing Small Cap Index stocks year to date are
Now, more recently, over last week, the top performing Small Cap Index stocks on the move are


|
||||||||||||||||||||||||||||||||||||||||||||||||
| 12Stocks.com: Investing in Smallcap Index using Exchange Traded Funds | |
|
The following table shows list of key exchange traded funds (ETF) that
help investors track Smallcap index. The following list also includes leveraged ETF funds that track twice or thrice the daily returns of Smallcap indices. Short or inverse ETF funds move in the opposite direction to the index they track and are useful during market pullbacks or during bear markets. Quick View: Move mouse or cursor over ETF symbol (ticker) to view short-term technical chart and over ETF name to view long term chart. Click on ticker or stock name for detailed view. Click on to add stock symbol to your watchlist and to view watchlist. |
12Stocks.com List of ETFs that track Smallcap Index
| Ticker | ETF Name | Watchlist | Recent Price | Smart Investing & Trading Score | Change % | Week % | Year-to-date % |
| IWM | iShares Russell 2000 | | 197.68 | 58 | -0.45 | 2.35 | -1.51% |
| IJR | iShares Core S&P Small-Cap | | 105.71 | 85 | -0.24 | 2.41 | -2.35% |
| VTWO | Vanguard Russell 2000 ETF | | 79.95 | 48 | -0.42 | 2.39 | -1.42% |
| IWN | iShares Russell 2000 Value | | 151.28 | 75 | -0.30 | 2.37 | -2.61% |
| IWO | iShares Russell 2000 Growth | | 251.27 | 58 | -0.44 | 2.44 | -0.38% |
| IJS | iShares S&P Small-Cap 600 Value | | 97.71 | 45 | -0.43 | 2.2 | -5.2% |
| IJT | iShares S&P Small-Cap 600 Growth | | 125.60 | 48 | -0.10 | 2.77 | 0.37% |
| XSLV | PowerShares S&P SmallCap Low Volatil ETF | | 42.81 | 48 | -0.57 | 1.48 | -3.05% |
| SBB | ProShares Short SmallCap600 | | 16.37 | 33 | -0.02 | -2.79 | 2.76% |
| SMLV | SPDR SSGA US Small Cap Low Volatil ETF | | 108.43 | 73 | -0.31 | 2.21 | -3.63% |
| SAA | ProShares Ultra SmallCap600 | | 23.01 | 58 | -0.60 | 5.55 | -7.78% |
| SDD | ProShares UltraShort SmallCap600 | | 19.49 | 42 | 1.35 | -4.18 | 5.77% |
| 12Stocks.com: Charts, Trends, Fundamental Data and Performances of SmallCap Stocks | |
|
We now take in-depth look at all SmallCap stocks including charts, multi-period performances and overall trends (as measured by Smart Investing & Trading Score). One can sort SmallCap stocks (click link to choose) by Daily, Weekly and by Year-to-Date performances. Also, one can sort by size of the company or by market capitalization. |
| Select Your Default Chart Type: | |||||
| |||||
| Click on stock symbol or name for detailed view. Click on to add stock symbol to your watchlist and to view watchlist. Quick View: Move mouse or cursor over "Daily" to quickly view daily technical stock chart and over "Weekly" to view weekly technical stock chart. | |||||

 | LIND Lindblad Expeditions Holdings, Inc. |
| Sector: Consumer Staples | |
| SubSector: Recreational Goods, Other | |
| MarketCap: 220.259 Millions | |
| Recent Price: 7.64 Smart Investing & Trading Score: 39 | |
| Day Percent Change: 4.01% Day Change: 0.29 | |
| Week Change: 5.89% Year-to-date Change: -32.2% | |
| LIND Links: Profile News Message Board | |
| Charts:- Daily , Weekly | |
| Add LIND to Watchlist: View: Get Complete LIND Trend Analysis ➞ | |
 | VRA Vera Bradley, Inc. |
| Sector: Consumer Staples | |
| SubSector: Textile - Apparel Footwear & Accessories | |
| MarketCap: 151.17 Millions | |
| Recent Price: 6.81 Smart Investing & Trading Score: 49 | |
| Day Percent Change: 2.87% Day Change: 0.19 | |
| Week Change: 5.75% Year-to-date Change: -11.6% | |
| VRA Links: Profile News Message Board | |
| Charts:- Daily , Weekly | |
| Add VRA to Watchlist: View: Get Complete VRA Trend Analysis ➞ | |
 | FL Foot Locker, Inc. |
| Sector: Consumer Staples | |
| SubSector: Textile - Apparel Footwear & Accessories | |
| MarketCap: 2463.6 Millions | |
| Recent Price: 22.87 Smart Investing & Trading Score: 49 | |
| Day Percent Change: 2.83% Day Change: 0.63 | |
| Week Change: 5.34% Year-to-date Change: -26.6% | |
| FL Links: Profile News Message Board | |
| Charts:- Daily , Weekly | |
| Add FL to Watchlist: View: Get Complete FL Trend Analysis ➞ | |
 | XPEL XPEL, Inc. |
| Sector: Consumer Staples | |
| SubSector: Auto Parts | |
| MarketCap: 290.239 Millions | |
| Recent Price: 55.96 Smart Investing & Trading Score: 68 | |
| Day Percent Change: 2.72% Day Change: 1.48 | |
| Week Change: 5.67% Year-to-date Change: 3.9% | |
| XPEL Links: Profile News Message Board | |
| Charts:- Daily , Weekly | |
| Add XPEL to Watchlist: View: Get Complete XPEL Trend Analysis ➞ | |
 | KTB Kontoor Brands, Inc. |
| Sector: Consumer Staples | |
| SubSector: Textile - Apparel Clothing | |
| MarketCap: 1668.65 Millions | |
| Recent Price: 61.86 Smart Investing & Trading Score: 75 | |
| Day Percent Change: 2.71% Day Change: 1.63 | |
| Week Change: 9.58% Year-to-date Change: -0.9% | |
| KTB Links: Profile News Message Board | |
| Charts:- Daily , Weekly | |
| Add KTB to Watchlist: View: Get Complete KTB Trend Analysis ➞ | |
 | ADNT Adient plc |
| Sector: Consumer Staples | |
| SubSector: Auto Parts | |
| MarketCap: 1003.39 Millions | |
| Recent Price: 29.69 Smart Investing & Trading Score: 42 | |
| Day Percent Change: 2.59% Day Change: 0.75 | |
| Week Change: 2.98% Year-to-date Change: -18.3% | |
| ADNT Links: Profile News Message Board | |
| Charts:- Daily , Weekly | |
| Add ADNT to Watchlist: View: Get Complete ADNT Trend Analysis ➞ | |
 | CLAR Clarus Corporation |
| Sector: Consumer Staples | |
| SubSector: Sporting Goods | |
| MarketCap: 290.144 Millions | |
| Recent Price: 6.29 Smart Investing & Trading Score: 61 | |
| Day Percent Change: 2.28% Day Change: 0.14 | |
| Week Change: 0.96% Year-to-date Change: -8.8% | |
| CLAR Links: Profile News Message Board | |
| Charts:- Daily , Weekly | |
| Add CLAR to Watchlist: View: Get Complete CLAR Trend Analysis ➞ | |
 | MOD Modine Manufacturing Company |
| Sector: Consumer Staples | |
| SubSector: Auto Parts | |
| MarketCap: 177.339 Millions | |
| Recent Price: 90.99 Smart Investing & Trading Score: 70 | |
| Day Percent Change: 2.18% Day Change: 1.94 | |
| Week Change: 8.72% Year-to-date Change: 52.4% | |
| MOD Links: Profile News Message Board | |
| Charts:- Daily , Weekly | |
| Add MOD to Watchlist: View: Get Complete MOD Trend Analysis ➞ | |
 | SENEA Seneca Foods Corporation |
| Sector: Consumer Staples | |
| SubSector: Processed & Packaged Goods | |
| MarketCap: 326.348 Millions | |
| Recent Price: 58.36 Smart Investing & Trading Score: 80 | |
| Day Percent Change: 2.08% Day Change: 1.19 | |
| Week Change: 0.95% Year-to-date Change: 11.3% | |
| SENEA Links: Profile News Message Board | |
| Charts:- Daily , Weekly | |
| Add SENEA to Watchlist: View: Get Complete SENEA Trend Analysis ➞ | |
 | MBUU Malibu Boats, Inc. |
| Sector: Consumer Staples | |
| SubSector: Recreational Goods, Other | |
| MarketCap: 561.059 Millions | |
| Recent Price: 34.70 Smart Investing & Trading Score: 25 | |
| Day Percent Change: 2.03% Day Change: 0.69 | |
| Week Change: 0.64% Year-to-date Change: -36.7% | |
| MBUU Links: Profile News Message Board | |
| Charts:- Daily , Weekly | |
| Add MBUU to Watchlist: View: Get Complete MBUU Trend Analysis ➞ | |
 | LMNR Limoneira Company |
| Sector: Consumer Staples | |
| SubSector: Farm Products | |
| MarketCap: 324.987 Millions | |
| Recent Price: 20.11 Smart Investing & Trading Score: 80 | |
| Day Percent Change: 2.00% Day Change: 0.39 | |
| Week Change: 2.63% Year-to-date Change: -2.5% | |
| LMNR Links: Profile News Message Board | |
| Charts:- Daily , Weekly | |
| Add LMNR to Watchlist: View: Get Complete LMNR Trend Analysis ➞ | |
 | STKL SunOpta Inc. |
| Sector: Consumer Staples | |
| SubSector: Processed & Packaged Goods | |
| MarketCap: 174.548 Millions | |
| Recent Price: 6.68 Smart Investing & Trading Score: 100 | |
| Day Percent Change: 1.98% Day Change: 0.13 | |
| Week Change: 12.08% Year-to-date Change: 22.1% | |
| STKL Links: Profile News Message Board | |
| Charts:- Daily , Weekly | |
| Add STKL to Watchlist: View: Get Complete STKL Trend Analysis ➞ | |
 | WWW Wolverine World Wide, Inc. |
| Sector: Consumer Staples | |
| SubSector: Textile - Apparel Footwear & Accessories | |
| MarketCap: 1390.7 Millions | |
| Recent Price: 10.62 Smart Investing & Trading Score: 100 | |
| Day Percent Change: 1.92% Day Change: 0.20 | |
| Week Change: 8.59% Year-to-date Change: 19.5% | |
| WWW Links: Profile News Message Board | |
| Charts:- Daily , Weekly | |
| Add WWW to Watchlist: View: Get Complete WWW Trend Analysis ➞ | |
 | COCO The Vita Coco Company, Inc. |
| Sector: Consumer Staples | |
| SubSector: Beverages - Non-Alcoholic | |
| MarketCap: 1510 Millions | |
| Recent Price: 24.09 Smart Investing & Trading Score: 51 | |
| Day Percent Change: 1.86% Day Change: 0.44 | |
| Week Change: 3.04% Year-to-date Change: -6.5% | |
| COCO Links: Profile News Message Board | |
| Charts:- Daily , Weekly | |
| Add COCO to Watchlist: View: Get Complete COCO Trend Analysis ➞ | |
 | LOVE The Lovesac Company |
| Sector: Consumer Staples | |
| SubSector: Home Furnishings & Fixtures | |
| MarketCap: 112.835 Millions | |
| Recent Price: 22.43 Smart Investing & Trading Score: 52 | |
| Day Percent Change: 1.77% Day Change: 0.39 | |
| Week Change: 7.84% Year-to-date Change: -12.2% | |
| LOVE Links: Profile News Message Board | |
| Charts:- Daily , Weekly | |
| Add LOVE to Watchlist: View: Get Complete LOVE Trend Analysis ➞ | |
 | NC NACCO Industries, Inc. |
| Sector: Consumer Staples | |
| SubSector: Home Furnishings & Fixtures | |
| MarketCap: 179.835 Millions | |
| Recent Price: 28.64 Smart Investing & Trading Score: 17 | |
| Day Percent Change: 1.74% Day Change: 0.49 | |
| Week Change: 1.17% Year-to-date Change: -21.5% | |
| NC Links: Profile News Message Board | |
| Charts:- Daily , Weekly | |
| Add NC to Watchlist: View: Get Complete NC Trend Analysis ➞ | |
 | SMPL The Simply Good Foods Company |
| Sector: Consumer Staples | |
| SubSector: Food - Major Diversified | |
| MarketCap: 1501.63 Millions | |
| Recent Price: 34.35 Smart Investing & Trading Score: 44 | |
| Day Percent Change: 1.60% Day Change: 0.54 | |
| Week Change: 3.53% Year-to-date Change: -13.3% | |
| SMPL Links: Profile News Message Board | |
| Charts:- Daily , Weekly | |
| Add SMPL to Watchlist: View: Get Complete SMPL Trend Analysis ➞ | |
 | VITL Vital Farms, Inc. |
| Sector: Consumer Staples | |
| SubSector: Farm Products | |
| MarketCap: 10347 Millions | |
| Recent Price: 26.62 Smart Investing & Trading Score: 95 | |
| Day Percent Change: 1.41% Day Change: 0.37 | |
| Week Change: 5.89% Year-to-date Change: 69.6% | |
| VITL Links: Profile News Message Board | |
| Charts:- Daily , Weekly | |
| Add VITL to Watchlist: View: Get Complete VITL Trend Analysis ➞ | |
 | EPC Edgewell Personal Care Company |
| Sector: Consumer Staples | |
| SubSector: Personal Products | |
| MarketCap: 1605.95 Millions | |
| Recent Price: 38.23 Smart Investing & Trading Score: 100 | |
| Day Percent Change: 1.38% Day Change: 0.52 | |
| Week Change: 4.31% Year-to-date Change: 4.4% | |
| EPC Links: Profile News Message Board | |
| Charts:- Daily , Weekly | |
| Add EPC to Watchlist: View: Get Complete EPC Trend Analysis ➞ | |
 | WKHS Workhorse Group Inc. |
| Sector: Consumer Staples | |
| SubSector: Auto Parts | |
| MarketCap: 129.839 Millions | |
| Recent Price: 0.16 Smart Investing & Trading Score: 25 | |
| Day Percent Change: 1.31% Day Change: 0.00 | |
| Week Change: 1.05% Year-to-date Change: -54.7% | |
| WKHS Links: Profile News Message Board | |
| Charts:- Daily , Weekly | |
| Add WKHS to Watchlist: View: Get Complete WKHS Trend Analysis ➞ | |
 | COKE Coca-Cola Consolidated, Inc. |
| Sector: Consumer Staples | |
| SubSector: Beverages - Soft Drinks | |
| MarketCap: 1392.2 Millions | |
| Recent Price: 841.43 Smart Investing & Trading Score: 64 | |
| Day Percent Change: 1.25% Day Change: 10.42 | |
| Week Change: 2.97% Year-to-date Change: -9.4% | |
| COKE Links: Profile News Message Board | |
| Charts:- Daily , Weekly | |
| Add COKE to Watchlist: View: Get Complete COKE Trend Analysis ➞ | |
 | MCFT MasterCraft Boat Holdings, Inc. |
| Sector: Consumer Staples | |
| SubSector: Recreational Vehicles | |
| MarketCap: 152.059 Millions | |
| Recent Price: 21.31 Smart Investing & Trading Score: 61 | |
| Day Percent Change: 1.24% Day Change: 0.26 | |
| Week Change: 1% Year-to-date Change: -5.9% | |
| MCFT Links: Profile News Message Board | |
| Charts:- Daily , Weekly | |
| Add MCFT to Watchlist: View: Get Complete MCFT Trend Analysis ➞ | |
 | VC Visteon Corporation |
| Sector: Consumer Staples | |
| SubSector: Auto Parts | |
| MarketCap: 1441.49 Millions | |
| Recent Price: 111.08 Smart Investing & Trading Score: 67 | |
| Day Percent Change: 1.16% Day Change: 1.27 | |
| Week Change: 2.7% Year-to-date Change: -11.1% | |
| VC Links: Profile News Message Board | |
| Charts:- Daily , Weekly | |
| Add VC to Watchlist: View: Get Complete VC Trend Analysis ➞ | |
 | FNKO Funko, Inc. |
| Sector: Consumer Staples | |
| SubSector: Toys & Games | |
| MarketCap: 246.38 Millions | |
| Recent Price: 6.18 Smart Investing & Trading Score: 67 | |
| Day Percent Change: 1.15% Day Change: 0.07 | |
| Week Change: 2.83% Year-to-date Change: -20.1% | |
| FNKO Links: Profile News Message Board | |
| Charts:- Daily , Weekly | |
| Add FNKO to Watchlist: View: Get Complete FNKO Trend Analysis ➞ | |
 | LANC Lancaster Colony Corporation |
| Sector: Consumer Staples | |
| SubSector: Food - Major Diversified | |
| MarketCap: 4060.83 Millions | |
| Recent Price: 188.96 Smart Investing & Trading Score: 51 | |
| Day Percent Change: 1.12% Day Change: 2.10 | |
| Week Change: 1.12% Year-to-date Change: 13.6% | |
| LANC Links: Profile News Message Board | |
| Charts:- Daily , Weekly | |
| Add LANC to Watchlist: View: Get Complete LANC Trend Analysis ➞ | |
| For tabular summary view of above stock list: Summary View ➞ 0 - 25 , 25 - 50 , 50 - 75 , 75 - 100 , 100 - 125 | ||
| Click To Change The Sort Order: By Market Cap or Company Size Performance: Year-to-date, Week and Day | |
| Select Chart Type: | ||
| Too many stocks? View smallcap stocks filtered by marketcap & sector |
| Marketcap: All SmallCap Stocks (default-no microcap), Large, Mid-Range, Small & MicroCap |
| Sector: Tech, Finance, Energy, Staples, Retail, Industrial, Materials, Utilities & Medical |
|
Best Stocks Today 12Stocks.com |
© 2024 12Stocks.com Terms & Conditions Privacy Contact Us
All Information Provided Only For Education And Not To Be Used For Investing or Trading. See Terms & Conditions


One More Thing ... Get Best Stocks Delivered Daily!
Never Ever Miss A Move With Our Top Ten Stocks Lists
Find Best Stocks In Any Market - Bull or Bear Market
Take A Peek At Our Top Ten Stocks Lists: Daily, Weekly, Year-to-Date & Top Trends
Find Best Stocks In Any Market - Bull or Bear Market
Take A Peek At Our Top Ten Stocks Lists: Daily, Weekly, Year-to-Date & Top Trends
Smallcap Stocks With Best Up Trends [0-bearish to 100-bullish]: B. Riley[100], Ribbon [100], Group 1[100], Trustmark [100], MBIA [100], Integer [100], EchoStar [100], Vishay Inter[100], Comstock Resources[100], Jamf Holding[100], SunOpta [100]
Best Smallcap Stocks Year-to-Date:
CareMax [574.23%], Janux [352.07%], Viking [249.44%], Alpine Immune[239.13%], Longboard [223.4%], Avidity Biosciences[177.71%], Arcutis Bio[171.21%], Super Micro[165.69%], Vera [149.61%], Hippo [130.79%], Y-mAbs [123.75%] Best Smallcap Stocks This Week:
Matterport [166.09%], B. Riley[49.37%], Seres [30.29%], Riot Blockchain[30.07%], CareMax [27.24%], Ribbon [25.78%], ProKidney [23.28%], SoundHound AI[22.54%], Cipher Mining[22.14%], Hibbett Sports[21.56%], Cullinan Oncology[20.69%] Best Smallcap Stocks Daily:
B. Riley[37.48%], Ribbon [26.26%], Babcock & Wilcox Enterprises[15.57%], Cullinan Oncology[13.55%], Amneal [12.41%], Gritstone Oncology[11.01%], Comtech Tele[10.76%], Innodata [9.76%], Navitas Semiconductor[8.83%], Eyenovia [8.68%], K12 [8.64%]