
 Login Sign Up


| |||||
 |  | ||||

| 12Stocks.com Market Intelligence |
Best SmallCap Stocks
|
| In a hurry? Small Cap Stock Lists: Performance Trends Table, Stock Charts
Sort Small Cap stocks: Daily, Weekly, Year-to-Date, Market Cap & Trends. Filter Small Cap stocks list by sector: Show all, Tech, Finance, Energy, Staples, Retail, Industrial, Materials, Utilities and HealthCare Filter Small Cap stocks list by size: All Large Medium Small and MicroCap |
| 12Stocks.com Small Cap Stocks Performances & Trends Daily | |||||||||
|
|  The overall Smart Investing & Trading Score is 13 (0-bearish to 100-bullish) which puts Small Cap index in short term bearish trend. The Smart Investing & Trading Score from previous trading session is 26 and hence a deterioration of trend.
| ||||||||
Here are the Smart Investing & Trading Scores of the most requested small cap stocks at 12Stocks.com (click stock name for detailed review):
|


| 12Stocks.com: Investing in Smallcap Index with Stocks | |
|
The following table helps investors and traders sort through current performance and trends (as measured by Smart Investing & Trading Score) of various
stocks in the Smallcap Index. Quick View: Move mouse or cursor over stock symbol (ticker) to view short-term technical chart and over stock name to view long term chart. Click on  to add stock symbol to your watchlist and to add stock symbol to your watchlist and  to view watchlist. Click on any ticker or stock name for detailed market intelligence report for that stock. to view watchlist. Click on any ticker or stock name for detailed market intelligence report for that stock. |
12Stocks.com Performance of Stocks in Smallcap Index
| Ticker | Stock Name | Watchlist | Category | Recent Price | Smart Investing & Trading Score | Change % | Weekly Change% |
| CVGW | Calavo Growers |   | Consumer Staples | 26.16 | 60 | 0.48% | 7.02% |
| ESCA | Escalade | | Consumer Staples | 13.81 | 57 | -5.93% | 6.97% |
| WWW | Wolverine World | | Consumer Staples | 9.51 | 68 | 0.96% | 4.28% |
| NUS | Nu Skin | | Consumer Staples | 12.57 | 52 | 1.66% | 4.27% |
| ISPR | Ispire | | Consumer Staples | 5.71 | 42 | 0.88% | 4.20% |
| HLF | Herbalife Nutrition | | Consumer Staples | 8.41 | 42 | 2.25% | 3.89% |
| UVV | Universal | | Consumer Staples | 50.25 | 42 | 1.80% | 3.50% |
| LOVE | Lovesac | | Consumer Staples | 19.95 | 32 | -1.14% | 2.26% |
| SPTN | SpartanNash | | Consumer Staples | 19.07 | 59 | 0.10% | 1.82% |
| VRA | Vera Bradley | | Consumer Staples | 6.45 | 25 | 0.86% | 1.50% |
| VGR | Vector Group | | Consumer Staples | 9.99 | 32 | 0.05% | 1.47% |
| SENEA | Seneca Foods | | Consumer Staples | 56.45 | 63 | 0.48% | 1.46% |
| PRMW | Primo Water | | Consumer Staples | 18.01 | 61 | 1.12% | 1.41% |
| AVO | Mission Produce | | Consumer Staples | 11.48 | 68 | 0.48% | 1.37% |
| WEST | Westrock Coffee | | Consumer Staples | 10.13 | 25 | 0.85% | 1.35% |
| RCKY | Rocky Brands | | Consumer Staples | 26.84 | 45 | 0.86% | 1.24% |
| ELF | e.l.f. Beauty | | Consumer Staples | 164.86 | 58 | -0.84% | 1.20% |
| ENR | Energizer | | Consumer Staples | 27.74 | 35 | 0.87% | 1.09% |
| MGPI | MGP Ingredients | | Consumer Staples | 78.39 | 35 | 0.78% | 1.01% |
| DOLE | Dole | | Consumer Staples | 11.77 | 51 | 1.12% | 0.86% |
| FDP | Fresh Del | | Consumer Staples | 25.08 | 61 | 0.97% | 0.60% |
| JJSF | J & J Snack Foods | | Consumer Staples | 135.28 | 28 | 0.79% | 0.52% |
| AFRI | Forafric Global | | Consumer Staples | 10.34 | 52 | -0.10% | 0.49% |
| OI | O-I Glass | | Consumer Staples | 15.34 | 43 | 1.66% | 0.26% |
| VITL | Vital Farms | | Consumer Staples | 25.10 | 66 | 0.02% | 0.12% |
| For chart view version of above stock list: Chart View ➞ 0 - 25 , 25 - 50 , 50 - 75 , 75 - 100 , 100 - 125 | ||
 | Click To Change The Sort Order: By Market Cap or Company Size Performance: Year-to-date, Week and Day |  |
| Too many stocks? View smallcap stocks filtered by marketcap & sector |
| Marketcap: All SmallCap Stocks (default-no microcap), Large, Mid-Range, Small |
| Smallcap Sector: Tech, Finance, Energy, Staples, Retail, Industrial, Materials, & Medical |
|
Get the most comprehensive stock market coverage daily at 12Stocks.com ➞ Best Stocks Today ➞ Best Stocks Weekly ➞ Best Stocks Year-to-Date ➞ Best Stocks Trends ➞  Best Stocks Today 12Stocks.com Best Nasdaq Stocks ➞ Best S&P 500 Stocks ➞ Best Tech Stocks ➞ Best Biotech Stocks ➞ |
| Detailed Overview of SmallCap Stocks |
| SmallCap Technical Overview, Leaders & Laggards, Top SmallCap ETF Funds & Detailed SmallCap Stocks List, Charts, Trends & More |
| Smallcap: Technical Analysis, Trends & YTD Performance | |
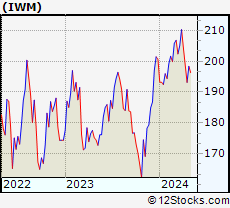
| SmallCap segment as represented by
IWM, an exchange-traded fund [ETF], holds basket of thousands of smallcap stocks from across all major sectors of the US stock market. The smallcap index (contains stocks like Riverbed & Sotheby's) is down by -3.56% and is currently underperforming the overall market by -8.11% year-to-date. Below is a quick view of technical charts and trends: | |
 IWM Weekly Chart |
|
| Long Term Trend: Good | |
| Medium Term Trend: Not Good | |
 IWM Daily Chart |
|
| Short Term Trend: Not Good | |
| Overall Trend Score: 13 | |
| YTD Performance: -3.56% | |
| **Trend Scores & Views Are Only For Educational Purposes And Not For Investing | |
| 12Stocks.com: Top Performing Small Cap Index Stocks | ||||||||||||||||||||||||||||||||||||||||||||||||
 The top performing Small Cap Index stocks year to date are
Now, more recently, over last week, the top performing Small Cap Index stocks on the move are


|
||||||||||||||||||||||||||||||||||||||||||||||||
| 12Stocks.com: Investing in Smallcap Index using Exchange Traded Funds | |
|
The following table shows list of key exchange traded funds (ETF) that
help investors track Smallcap index. The following list also includes leveraged ETF funds that track twice or thrice the daily returns of Smallcap indices. Short or inverse ETF funds move in the opposite direction to the index they track and are useful during market pullbacks or during bear markets. Quick View: Move mouse or cursor over ETF symbol (ticker) to view short-term technical chart and over ETF name to view long term chart. Click on ticker or stock name for detailed view. Click on to add stock symbol to your watchlist and to view watchlist. |
12Stocks.com List of ETFs that track Smallcap Index
| Ticker | ETF Name | Watchlist | Recent Price | Smart Investing & Trading Score | Change % | Week % | Year-to-date % |
| IWM | iShares Russell 2000 | | 193.56 | 13 | 0.29 | -2.58 | -3.56% |
| IJR | iShares Core S&P Small-Cap | | 102.65 | 7 | 0.51 | -1.78 | -5.17% |
| IWN | iShares Russell 2000 Value | | 146.73 | 0 | 0.48 | -2.43 | -5.54% |
| IWO | iShares Russell 2000 Growth | | 248.39 | 26 | 0.15 | -2.73 | -1.52% |
| IJS | iShares S&P Small-Cap 600 Value | | 94.21 | 7 | 0.10 | -2.04 | -8.6% |
| XSLV | PowerShares S&P SmallCap Low Volatil ETF | | 41.58 | 0 | 0.39 | -1.21 | -5.82% |
| 12Stocks.com: Charts, Trends, Fundamental Data and Performances of SmallCap Stocks | |
|
We now take in-depth look at all SmallCap stocks including charts, multi-period performances and overall trends (as measured by Smart Investing & Trading Score). One can sort SmallCap stocks (click link to choose) by Daily, Weekly and by Year-to-Date performances. Also, one can sort by size of the company or by market capitalization. |
| Select Your Default Chart Type: | |||||
| |||||
| Click on stock symbol or name for detailed view. Click on to add stock symbol to your watchlist and to view watchlist. Quick View: Move mouse or cursor over "Daily" to quickly view daily technical stock chart and over "Weekly" to view weekly technical stock chart. | |||||

 | CVGW Calavo Growers, Inc. |
| Sector: Consumer Staples | |
| SubSector: Farm Products | |
| MarketCap: 935.287 Millions | |
| Recent Price: 26.16 Smart Investing & Trading Score: 60 | |
| Day Percent Change: 0.48% Day Change: 0.13 | |
| Week Change: 7.02% Year-to-date Change: -11.1% | |
| CVGW Links: Profile News Message Board | |
| Charts:- Daily , Weekly | |
| Add CVGW to Watchlist: View: Get Complete CVGW Trend Analysis ➞ | |
 | ESCA Escalade, Incorporated |
| Sector: Consumer Staples | |
| SubSector: Sporting Goods | |
| MarketCap: 87.8144 Millions | |
| Recent Price: 13.81 Smart Investing & Trading Score: 57 | |
| Day Percent Change: -5.93% Day Change: -0.87 | |
| Week Change: 6.97% Year-to-date Change: -31.3% | |
| ESCA Links: Profile News Message Board | |
| Charts:- Daily , Weekly | |
| Add ESCA to Watchlist: View: Get Complete ESCA Trend Analysis ➞ | |
 | WWW Wolverine World Wide, Inc. |
| Sector: Consumer Staples | |
| SubSector: Textile - Apparel Footwear & Accessories | |
| MarketCap: 1390.7 Millions | |
| Recent Price: 9.51 Smart Investing & Trading Score: 68 | |
| Day Percent Change: 0.96% Day Change: 0.09 | |
| Week Change: 4.28% Year-to-date Change: 7.0% | |
| WWW Links: Profile News Message Board | |
| Charts:- Daily , Weekly | |
| Add WWW to Watchlist: View: Get Complete WWW Trend Analysis ➞ | |
 | NUS Nu Skin Enterprises, Inc. |
| Sector: Consumer Staples | |
| SubSector: Personal Products | |
| MarketCap: 1230.85 Millions | |
| Recent Price: 12.57 Smart Investing & Trading Score: 52 | |
| Day Percent Change: 1.66% Day Change: 0.21 | |
| Week Change: 4.27% Year-to-date Change: -35.3% | |
| NUS Links: Profile News Message Board | |
| Charts:- Daily , Weekly | |
| Add NUS to Watchlist: View: Get Complete NUS Trend Analysis ➞ | |
 | ISPR Ispire Technology Inc. |
| Sector: Consumer Staples | |
| SubSector: Tobacco | |
| MarketCap: 447 Millions | |
| Recent Price: 5.71 Smart Investing & Trading Score: 42 | |
| Day Percent Change: 0.88% Day Change: 0.05 | |
| Week Change: 4.2% Year-to-date Change: -53.2% | |
| ISPR Links: Profile News Message Board | |
| Charts:- Daily , Weekly | |
| Add ISPR to Watchlist: View: Get Complete ISPR Trend Analysis ➞ | |
 | HLF Herbalife Nutrition Ltd. |
| Sector: Consumer Staples | |
| SubSector: Personal Products | |
| MarketCap: 4884.65 Millions | |
| Recent Price: 8.41 Smart Investing & Trading Score: 42 | |
| Day Percent Change: 2.25% Day Change: 0.18 | |
| Week Change: 3.89% Year-to-date Change: -44.9% | |
| HLF Links: Profile News Message Board | |
| Charts:- Daily , Weekly | |
| Add HLF to Watchlist: View: Get Complete HLF Trend Analysis ➞ | |
 | UVV Universal Corporation |
| Sector: Consumer Staples | |
| SubSector: Tobacco Products, Other | |
| MarketCap: 1107.7 Millions | |
| Recent Price: 50.25 Smart Investing & Trading Score: 42 | |
| Day Percent Change: 1.80% Day Change: 0.89 | |
| Week Change: 3.5% Year-to-date Change: -25.4% | |
| UVV Links: Profile News Message Board | |
| Charts:- Daily , Weekly | |
| Add UVV to Watchlist: View: Get Complete UVV Trend Analysis ➞ | |
 | LOVE The Lovesac Company |
| Sector: Consumer Staples | |
| SubSector: Home Furnishings & Fixtures | |
| MarketCap: 112.835 Millions | |
| Recent Price: 19.95 Smart Investing & Trading Score: 32 | |
| Day Percent Change: -1.14% Day Change: -0.23 | |
| Week Change: 2.26% Year-to-date Change: -21.9% | |
| LOVE Links: Profile News Message Board | |
| Charts:- Daily , Weekly | |
| Add LOVE to Watchlist: View: Get Complete LOVE Trend Analysis ➞ | |
 | SPTN SpartanNash Company |
| Sector: Consumer Staples | |
| SubSector: Food Wholesale | |
| MarketCap: 671.229 Millions | |
| Recent Price: 19.07 Smart Investing & Trading Score: 59 | |
| Day Percent Change: 0.10% Day Change: 0.02 | |
| Week Change: 1.82% Year-to-date Change: -16.9% | |
| SPTN Links: Profile News Message Board | |
| Charts:- Daily , Weekly | |
| Add SPTN to Watchlist: View: Get Complete SPTN Trend Analysis ➞ | |
 | VRA Vera Bradley, Inc. |
| Sector: Consumer Staples | |
| SubSector: Textile - Apparel Footwear & Accessories | |
| MarketCap: 151.17 Millions | |
| Recent Price: 6.45 Smart Investing & Trading Score: 25 | |
| Day Percent Change: 0.86% Day Change: 0.06 | |
| Week Change: 1.5% Year-to-date Change: -16.3% | |
| VRA Links: Profile News Message Board | |
| Charts:- Daily , Weekly | |
| Add VRA to Watchlist: View: Get Complete VRA Trend Analysis ➞ | |
 | VGR Vector Group Ltd. |
| Sector: Consumer Staples | |
| SubSector: Cigarettes | |
| MarketCap: 1676.53 Millions | |
| Recent Price: 9.99 Smart Investing & Trading Score: 32 | |
| Day Percent Change: 0.05% Day Change: 0.00 | |
| Week Change: 1.47% Year-to-date Change: -11.4% | |
| VGR Links: Profile News Message Board | |
| Charts:- Daily , Weekly | |
| Add VGR to Watchlist: View: Get Complete VGR Trend Analysis ➞ | |
 | SENEA Seneca Foods Corporation |
| Sector: Consumer Staples | |
| SubSector: Processed & Packaged Goods | |
| MarketCap: 326.348 Millions | |
| Recent Price: 56.45 Smart Investing & Trading Score: 63 | |
| Day Percent Change: 0.48% Day Change: 0.27 | |
| Week Change: 1.46% Year-to-date Change: 7.7% | |
| SENEA Links: Profile News Message Board | |
| Charts:- Daily , Weekly | |
| Add SENEA to Watchlist: View: Get Complete SENEA Trend Analysis ➞ | |
 | PRMW Primo Water Corporation |
| Sector: Consumer Staples | |
| SubSector: Beverages - Soft Drinks | |
| MarketCap: 1479.7 Millions | |
| Recent Price: 18.01 Smart Investing & Trading Score: 61 | |
| Day Percent Change: 1.12% Day Change: 0.20 | |
| Week Change: 1.41% Year-to-date Change: 19.7% | |
| PRMW Links: Profile News Message Board | |
| Charts:- Daily , Weekly | |
| Add PRMW to Watchlist: View: Get Complete PRMW Trend Analysis ➞ | |
 | AVO Mission Produce, Inc. |
| Sector: Consumer Staples | |
| SubSector: Farm Products | |
| MarketCap: 91347 Millions | |
| Recent Price: 11.48 Smart Investing & Trading Score: 68 | |
| Day Percent Change: 0.48% Day Change: 0.05 | |
| Week Change: 1.37% Year-to-date Change: 13.5% | |
| AVO Links: Profile News Message Board | |
| Charts:- Daily , Weekly | |
| Add AVO to Watchlist: View: Get Complete AVO Trend Analysis ➞ | |
 | WEST Westrock Coffee Company, LLC |
| Sector: Consumer Staples | |
| SubSector: Packaged Foods | |
| MarketCap: 799 Millions | |
| Recent Price: 10.13 Smart Investing & Trading Score: 25 | |
| Day Percent Change: 0.85% Day Change: 0.09 | |
| Week Change: 1.35% Year-to-date Change: -0.3% | |
| WEST Links: Profile News Message Board | |
| Charts:- Daily , Weekly | |
| Add WEST to Watchlist: View: Get Complete WEST Trend Analysis ➞ | |
 | RCKY Rocky Brands, Inc. |
| Sector: Consumer Staples | |
| SubSector: Textile - Apparel Footwear & Accessories | |
| MarketCap: 137.47 Millions | |
| Recent Price: 26.84 Smart Investing & Trading Score: 45 | |
| Day Percent Change: 0.86% Day Change: 0.23 | |
| Week Change: 1.24% Year-to-date Change: -11.1% | |
| RCKY Links: Profile News Message Board | |
| Charts:- Daily , Weekly | |
| Add RCKY to Watchlist: View: Get Complete RCKY Trend Analysis ➞ | |
 | ELF e.l.f. Beauty, Inc. |
| Sector: Consumer Staples | |
| SubSector: Personal Products | |
| MarketCap: 497.985 Millions | |
| Recent Price: 164.86 Smart Investing & Trading Score: 58 | |
| Day Percent Change: -0.84% Day Change: -1.40 | |
| Week Change: 1.2% Year-to-date Change: 14.2% | |
| ELF Links: Profile News Message Board | |
| Charts:- Daily , Weekly | |
| Add ELF to Watchlist: View: Get Complete ELF Trend Analysis ➞ | |
 | ENR Energizer Holdings, Inc. |
| Sector: Consumer Staples | |
| SubSector: Personal Products | |
| MarketCap: 2469.55 Millions | |
| Recent Price: 27.74 Smart Investing & Trading Score: 35 | |
| Day Percent Change: 0.87% Day Change: 0.24 | |
| Week Change: 1.09% Year-to-date Change: -12.4% | |
| ENR Links: Profile News Message Board | |
| Charts:- Daily , Weekly | |
| Add ENR to Watchlist: View: Get Complete ENR Trend Analysis ➞ | |
 | MGPI MGP Ingredients, Inc. |
| Sector: Consumer Staples | |
| SubSector: Beverages - Wineries & Distillers | |
| MarketCap: 502.635 Millions | |
| Recent Price: 78.39 Smart Investing & Trading Score: 35 | |
| Day Percent Change: 0.78% Day Change: 0.61 | |
| Week Change: 1.01% Year-to-date Change: -20.4% | |
| MGPI Links: Profile News Message Board | |
| Charts:- Daily , Weekly | |
| Add MGPI to Watchlist: View: Get Complete MGPI Trend Analysis ➞ | |
 | DOLE Dole plc |
| Sector: Consumer Staples | |
| SubSector: Farm Products | |
| MarketCap: 1300 Millions | |
| Recent Price: 11.77 Smart Investing & Trading Score: 51 | |
| Day Percent Change: 1.12% Day Change: 0.13 | |
| Week Change: 0.86% Year-to-date Change: -4.6% | |
| DOLE Links: Profile News Message Board | |
| Charts:- Daily , Weekly | |
| Add DOLE to Watchlist: View: Get Complete DOLE Trend Analysis ➞ | |
 | FDP Fresh Del Monte Produce Inc. |
| Sector: Consumer Staples | |
| SubSector: Farm Products | |
| MarketCap: 1862.37 Millions | |
| Recent Price: 25.08 Smart Investing & Trading Score: 61 | |
| Day Percent Change: 0.97% Day Change: 0.24 | |
| Week Change: 0.6% Year-to-date Change: -4.5% | |
| FDP Links: Profile News Message Board | |
| Charts:- Daily , Weekly | |
| Add FDP to Watchlist: View: Get Complete FDP Trend Analysis ➞ | |
 | JJSF J & J Snack Foods Corp. |
| Sector: Consumer Staples | |
| SubSector: Processed & Packaged Goods | |
| MarketCap: 2706.28 Millions | |
| Recent Price: 135.28 Smart Investing & Trading Score: 28 | |
| Day Percent Change: 0.79% Day Change: 1.06 | |
| Week Change: 0.52% Year-to-date Change: -19.1% | |
| JJSF Links: Profile News Message Board | |
| Charts:- Daily , Weekly | |
| Add JJSF to Watchlist: View: Get Complete JJSF Trend Analysis ➞ | |
 | AFRI Forafric Global PLC |
| Sector: Consumer Staples | |
| SubSector: Farm Products | |
| MarketCap: 295 Millions | |
| Recent Price: 10.34 Smart Investing & Trading Score: 52 | |
| Day Percent Change: -0.10% Day Change: -0.01 | |
| Week Change: 0.49% Year-to-date Change: -2.4% | |
| AFRI Links: Profile News Message Board | |
| Charts:- Daily , Weekly | |
| Add AFRI to Watchlist: View: Get Complete AFRI Trend Analysis ➞ | |
 | OI O-I Glass, Inc. |
| Sector: Consumer Staples | |
| SubSector: Packaging & Containers | |
| MarketCap: 881.853 Millions | |
| Recent Price: 15.34 Smart Investing & Trading Score: 43 | |
| Day Percent Change: 1.66% Day Change: 0.25 | |
| Week Change: 0.26% Year-to-date Change: -6.4% | |
| OI Links: Profile News Message Board | |
| Charts:- Daily , Weekly | |
| Add OI to Watchlist: View: Get Complete OI Trend Analysis ➞ | |
 | VITL Vital Farms, Inc. |
| Sector: Consumer Staples | |
| SubSector: Farm Products | |
| MarketCap: 10347 Millions | |
| Recent Price: 25.10 Smart Investing & Trading Score: 66 | |
| Day Percent Change: 0.02% Day Change: 0.01 | |
| Week Change: 0.12% Year-to-date Change: 59.9% | |
| VITL Links: Profile News Message Board | |
| Charts:- Daily , Weekly | |
| Add VITL to Watchlist: View: Get Complete VITL Trend Analysis ➞ | |
| For tabular summary view of above stock list: Summary View ➞ 0 - 25 , 25 - 50 , 50 - 75 , 75 - 100 , 100 - 125 | ||
| Click To Change The Sort Order: By Market Cap or Company Size Performance: Year-to-date, Week and Day | |
| Select Chart Type: | ||
| Too many stocks? View smallcap stocks filtered by marketcap & sector |
| Marketcap: All SmallCap Stocks (default-no microcap), Large, Mid-Range, Small & MicroCap |
| Sector: Tech, Finance, Energy, Staples, Retail, Industrial, Materials, Utilities & Medical |
|
Best Stocks Today 12Stocks.com |
© 2024 12Stocks.com Terms & Conditions Privacy Contact Us
All Information Provided Only For Education And Not To Be Used For Investing or Trading. See Terms & Conditions


One More Thing ... Get Best Stocks Delivered Daily!
Never Ever Miss A Move With Our Top Ten Stocks Lists
Find Best Stocks In Any Market - Bull or Bear Market
Take A Peek At Our Top Ten Stocks Lists: Daily, Weekly, Year-to-Date & Top Trends
Find Best Stocks In Any Market - Bull or Bear Market
Take A Peek At Our Top Ten Stocks Lists: Daily, Weekly, Year-to-Date & Top Trends
Smallcap Stocks With Best Up Trends [0-bearish to 100-bullish]: Envestnet [100], IMAX [100], PrimeEnergy Resources[100], ALX Oncology[100], Vanda [100], Intra-Cellular Therapies[100], ProKidney [100], Oscar Health[95], Dorian LPG[95], Macatawa Bank[93], Encore Wire[93]
Best Smallcap Stocks Year-to-Date:
CareMax [417.53%], Janux [344.67%], Viking [250.51%], Alpine Immune[238.58%], Super Micro[232.34%], Longboard [171.69%], Avidity Biosciences[157.3%], Vera [153.59%], Hippo [124.26%], Verde Clean[112.02%], Veritone [111.54%] Best Smallcap Stocks This Week:
Macatawa Bank[42.96%], Snap One[29.73%], ProKidney [26.57%], Vertex Energy[22.6%], Vanda [22.33%], ALX Oncology[20.11%], Cullinan Oncology[13.98%], Expensify [12.93%], Children s[11.86%], Citius [11.75%], Humacyte [11.46%] Best Smallcap Stocks Daily:
23andMe Holding[37.10%], Vertex Energy[30.21%], Zura Bio[12.58%], Badger Meter[10.35%], Expensify [9.93%], Apogee Enterprises[8.74%], Barnes Group[8.15%], Citius [7.87%], Tellurian [7.58%], Duolingo [7.23%], Cullinan Oncology[6.50%]