
 Login Sign Up


| |||||
 |  | ||||

| 12Stocks.com Market Intelligence |
Best SmallCap Stocks
|
| In a hurry? Small Cap Stock Lists: Performance Trends Table, Stock Charts
Sort Small Cap stocks: Daily, Weekly, Year-to-Date, Market Cap & Trends. Filter Small Cap stocks list by sector: Show all, Tech, Finance, Energy, Staples, Retail, Industrial, Materials, Utilities and HealthCare Filter Small Cap stocks list by size: All Large Medium Small and MicroCap |
| 12Stocks.com Small Cap Stocks Performances & Trends Daily | |||||||||
|
|  The overall Smart Investing & Trading Score is 69 (0-bearish to 100-bullish) which puts Small Cap index in short term neutral to bullish trend. The Smart Investing & Trading Score from previous trading session is 49 and hence an improvement of trend.
| ||||||||
Here are the Smart Investing & Trading Scores of the most requested small cap stocks at 12Stocks.com (click stock name for detailed review):
|


| 12Stocks.com: Investing in Smallcap Index with Stocks | |
|
The following table helps investors and traders sort through current performance and trends (as measured by Smart Investing & Trading Score) of various
stocks in the Smallcap Index. Quick View: Move mouse or cursor over stock symbol (ticker) to view short-term technical chart and over stock name to view long term chart. Click on  to add stock symbol to your watchlist and to add stock symbol to your watchlist and  to view watchlist. Click on any ticker or stock name for detailed market intelligence report for that stock. to view watchlist. Click on any ticker or stock name for detailed market intelligence report for that stock. |
12Stocks.com Performance of Stocks in Smallcap Index
| Ticker | Stock Name | Watchlist | Category | Recent Price | Smart Investing & Trading Score | Change % | YTD Change% |
| CCBG | Capital City |   | Financials | 27.47 | 74 | -0.07% | -6.66% |
| TALO | Talos Energy | | Energy | 13.26 | 48 | 0.45% | -6.82% |
| FMBH | First Mid | | Financials | 32.26 | 100 | -0.09% | -6.92% |
| DC | Dakota Gold | | Materials | 2.42 | 53 | 0.00% | -6.92% |
| OSBC | Old Second | | Financials | 14.36 | 100 | 1.48% | -6.99% |
| INN | Summit Hotel | | Financials | 6.25 | 52 | 1.13% | -6.99% |
| SPOK | Spok | | Technology | 14.38 | 0 | -0.48% | -7.11% |
| NVEC | NVE | | Technology | 72.80 | 0 | -8.62% | -7.18% |
| LCNB | LCNB | | Financials | 14.63 | 76 | 1.11% | -7.23% |
| GAMB | Gambling.com Group | | Services & Goods | 9.04 | 60 | 0.44% | -7.38% |
| BFLY | Butterfly | | Health Care | 1.04 | 74 | 17.42% | -7.52% |
| EBF | Ennis | | Consumer Staples | 20.26 | 82 | -0.05% | -7.53% |
| BSRR | Sierra Bancorp | | Financials | 20.85 | 95 | -0.33% | -7.54% |
| EFC | Ellington Financial | | Financials | 11.66 | 95 | 0.09% | -8.26% |
| DHIL | Diamond Hill | | Financials | 151.90 | 100 | -0.01% | -8.27% |
| FLNG | Flex LNG | | Energy | 26.60 | 100 | 0.34% | -8.47% |
| AVTE | Aerovate | | Health Care | 20.63 | 25 | -0.70% | -8.62% |
| HIFS | Hingham Institution | | Financials | 177.63 | 93 | 0.53% | -8.63% |
| CCS | Century Communities | | Industrials | 83.27 | 49 | 1.66% | -8.64% |
| IMXI | Money | | Services & Goods | 20.15 | 61 | 0.73% | -8.80% |
| WNC | Wabash National | | Consumer Staples | 23.34 | 32 | 1.97% | -8.90% |
| NC | NACCO Industries | | Consumer Staples | 33.22 | 74 | 4.83% | -8.99% |
| NBR | Nabors Industries | | Energy | 74.23 | 42 | 5.50% | -9.07% |
| FC | Franklin Covey | | Services & Goods | 39.53 | 95 | -0.75% | -9.19% |
| OMGA | Omega | | Health Care | 2.73 | 74 | 7.48% | -9.30% |
| For chart view version of above stock list: Chart View ➞ 0 - 25 , 25 - 50 , 50 - 75 , 75 - 100 , 100 - 125 , 125 - 150 , 150 - 175 , 175 - 200 , 200 - 225 , 225 - 250 , 250 - 275 , 275 - 300 , 300 - 325 , 325 - 350 , 350 - 375 , 375 - 400 , 400 - 425 , 425 - 450 , 450 - 475 , 475 - 500 , 500 - 525 | ||
 | Click To Change The Sort Order: By Market Cap or Company Size Performance: Year-to-date, Week and Day |  |
| Too many stocks? View smallcap stocks filtered by marketcap & sector |
| Marketcap: All SmallCap Stocks (default-no microcap), Large, Mid-Range, Small |
| Smallcap Sector: Tech, Finance, Energy, Staples, Retail, Industrial, Materials, & Medical |
|
Get the most comprehensive stock market coverage daily at 12Stocks.com ➞ Best Stocks Today ➞ Best Stocks Weekly ➞ Best Stocks Year-to-Date ➞ Best Stocks Trends ➞  Best Stocks Today 12Stocks.com Best Nasdaq Stocks ➞ Best S&P 500 Stocks ➞ Best Tech Stocks ➞ Best Biotech Stocks ➞ |
| Detailed Overview of SmallCap Stocks |
| SmallCap Technical Overview, Leaders & Laggards, Top SmallCap ETF Funds & Detailed SmallCap Stocks List, Charts, Trends & More |
| Smallcap: Technical Analysis, Trends & YTD Performance | |
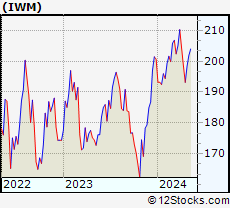
| SmallCap segment as represented by
IWM, an exchange-traded fund [ETF], holds basket of thousands of smallcap stocks from across all major sectors of the US stock market. The smallcap index (contains stocks like Riverbed & Sotheby's) is up by 0.59% and is currently underperforming the overall market by -6.29% year-to-date. Below is a quick view of technical charts and trends: | |
 IWM Weekly Chart |
|
| Long Term Trend: Not Good | |
| Medium Term Trend: Very Good | |
 IWM Daily Chart |
|
| Short Term Trend: Very Good | |
| Overall Trend Score: 69 | |
| YTD Performance: 0.59% | |
| **Trend Scores & Views Are Only For Educational Purposes And Not For Investing | |
| 12Stocks.com: Top Performing Small Cap Index Stocks | ||||||||||||||||||||||||||||||||||||||||||||||||
 The top performing Small Cap Index stocks year to date are
Now, more recently, over last week, the top performing Small Cap Index stocks on the move are


|
||||||||||||||||||||||||||||||||||||||||||||||||
| 12Stocks.com: Investing in Smallcap Index using Exchange Traded Funds | |
|
The following table shows list of key exchange traded funds (ETF) that
help investors track Smallcap index. The following list also includes leveraged ETF funds that track twice or thrice the daily returns of Smallcap indices. Short or inverse ETF funds move in the opposite direction to the index they track and are useful during market pullbacks or during bear markets. Quick View: Move mouse or cursor over ETF symbol (ticker) to view short-term technical chart and over ETF name to view long term chart. Click on ticker or stock name for detailed view. Click on to add stock symbol to your watchlist and to view watchlist. |
12Stocks.com List of ETFs that track Smallcap Index
| Ticker | ETF Name | Watchlist | Recent Price | Smart Investing & Trading Score | Change % | Week % | Year-to-date % |
| IWM | iShares Russell 2000 | | 201.90 | 69 | 0.99 | 1.77 | 0.59% |
| IJR | iShares Core S&P Small-Cap | | 107.13 | 82 | 0.75 | 1.4 | -1.03% |
| VTWO | Vanguard Russell 2000 ETF | | 81.61 | 37 | 0.94 | 1.73 | 0.63% |
| IWN | iShares Russell 2000 Value | | 154.21 | 57 | 0.87 | 2.03 | -0.72% |
| IJS | iShares S&P Small-Cap 600 Value | | 98.72 | 44 | 0.71 | 1.57 | -4.22% |
| IWO | iShares Russell 2000 Growth | | 256.87 | 27 | 0.99 | 1.49 | 1.84% |
| IJT | iShares S&P Small-Cap 600 Growth | | 127.76 | 57 | 0.82 | 1.32 | 2.09% |
| XSLV | PowerShares S&P SmallCap Low Volatil ETF | | 43.22 | 67 | 0.19 | 1.17 | -2.11% |
| SBB | ProShares Short SmallCap600 | | 16.16 | 13 | -1.28 | -1.37 | 1.44% |
| SDD | ProShares UltraShort SmallCap600 | | 18.84 | 23 | -2.41 | -2.61 | 2.27% |
| SAA | ProShares Ultra SmallCap600 | | 23.59 | 82 | 2.86 | 2.39 | -5.45% |
| SMLV | SPDR SSGA US Small Cap Low Volatil ETF | | 109.69 | 87 | 0.78 | 2.01 | -2.52% |
| 12Stocks.com: Charts, Trends, Fundamental Data and Performances of SmallCap Stocks | |
|
We now take in-depth look at all SmallCap stocks including charts, multi-period performances and overall trends (as measured by Smart Investing & Trading Score). One can sort SmallCap stocks (click link to choose) by Daily, Weekly and by Year-to-Date performances. Also, one can sort by size of the company or by market capitalization. |
| Select Your Default Chart Type: | |||||
| |||||
| Click on stock symbol or name for detailed view. Click on to add stock symbol to your watchlist and to view watchlist. Quick View: Move mouse or cursor over "Daily" to quickly view daily technical stock chart and over "Weekly" to view weekly technical stock chart. | |||||

 | CCBG Capital City Bank Group, Inc. |
| Sector: Financials | |
| SubSector: Regional - Mid-Atlantic Banks | |
| MarketCap: 314.459 Millions | |
| Recent Price: 27.47 Smart Investing & Trading Score: 74 | |
| Day Percent Change: -0.07% Day Change: -0.02 | |
| Week Change: 1.67% Year-to-date Change: -6.7% | |
| CCBG Links: Profile News Message Board | |
| Charts:- Daily , Weekly | |
| Add CCBG to Watchlist: View: Get Complete CCBG Trend Analysis ➞ | |
 | TALO Talos Energy Inc. |
| Sector: Energy | |
| SubSector: Independent Oil & Gas | |
| MarketCap: 396.293 Millions | |
| Recent Price: 13.26 Smart Investing & Trading Score: 48 | |
| Day Percent Change: 0.45% Day Change: 0.06 | |
| Week Change: -4.88% Year-to-date Change: -6.8% | |
| TALO Links: Profile News Message Board | |
| Charts:- Daily , Weekly | |
| Add TALO to Watchlist: View: Get Complete TALO Trend Analysis ➞ | |
 | FMBH First Mid Bancshares, Inc. |
| Sector: Financials | |
| SubSector: Regional - Midwest Banks | |
| MarketCap: 373.27 Millions | |
| Recent Price: 32.26 Smart Investing & Trading Score: 100 | |
| Day Percent Change: -0.09% Day Change: -0.03 | |
| Week Change: 2.38% Year-to-date Change: -6.9% | |
| FMBH Links: Profile News Message Board | |
| Charts:- Daily , Weekly | |
| Add FMBH to Watchlist: View: Get Complete FMBH Trend Analysis ➞ | |
 | DC Dakota Gold Corp. |
| Sector: Materials | |
| SubSector: Gold | |
| MarketCap: 218 Millions | |
| Recent Price: 2.42 Smart Investing & Trading Score: 53 | |
| Day Percent Change: 0.00% Day Change: 0.00 | |
| Week Change: -5.84% Year-to-date Change: -6.9% | |
| DC Links: Profile News Message Board | |
| Charts:- Daily , Weekly | |
| Add DC to Watchlist: View: Get Complete DC Trend Analysis ➞ | |
 | OSBC Old Second Bancorp, Inc. |
| Sector: Financials | |
| SubSector: Regional - Midwest Banks | |
| MarketCap: 237.17 Millions | |
| Recent Price: 14.36 Smart Investing & Trading Score: 100 | |
| Day Percent Change: 1.48% Day Change: 0.21 | |
| Week Change: 2.35% Year-to-date Change: -7.0% | |
| OSBC Links: Profile News Message Board | |
| Charts:- Daily , Weekly | |
| Add OSBC to Watchlist: View: Get Complete OSBC Trend Analysis ➞ | |
 | INN Summit Hotel Properties, Inc. |
| Sector: Financials | |
| SubSector: Real Estate Development | |
| MarketCap: 402.019 Millions | |
| Recent Price: 6.25 Smart Investing & Trading Score: 52 | |
| Day Percent Change: 1.13% Day Change: 0.07 | |
| Week Change: 1.96% Year-to-date Change: -7.0% | |
| INN Links: Profile News Message Board | |
| Charts:- Daily , Weekly | |
| Add INN to Watchlist: View: Get Complete INN Trend Analysis ➞ | |
 | SPOK Spok Holdings, Inc. |
| Sector: Technology | |
| SubSector: Wireless Communications | |
| MarketCap: 220.827 Millions | |
| Recent Price: 14.38 Smart Investing & Trading Score: 0 | |
| Day Percent Change: -0.48% Day Change: -0.07 | |
| Week Change: -9.33% Year-to-date Change: -7.1% | |
| SPOK Links: Profile News Message Board | |
| Charts:- Daily , Weekly | |
| Add SPOK to Watchlist: View: Get Complete SPOK Trend Analysis ➞ | |
 | NVEC NVE Corporation |
| Sector: Technology | |
| SubSector: Semiconductor - Specialized | |
| MarketCap: 231.26 Millions | |
| Recent Price: 72.80 Smart Investing & Trading Score: 0 | |
| Day Percent Change: -8.62% Day Change: -6.87 | |
| Week Change: -9.44% Year-to-date Change: -7.2% | |
| NVEC Links: Profile News Message Board | |
| Charts:- Daily , Weekly | |
| Add NVEC to Watchlist: View: Get Complete NVEC Trend Analysis ➞ | |
 | LCNB LCNB Corp. |
| Sector: Financials | |
| SubSector: Regional - Mid-Atlantic Banks | |
| MarketCap: 176.759 Millions | |
| Recent Price: 14.63 Smart Investing & Trading Score: 76 | |
| Day Percent Change: 1.11% Day Change: 0.16 | |
| Week Change: -4% Year-to-date Change: -7.2% | |
| LCNB Links: Profile News Message Board | |
| Charts:- Daily , Weekly | |
| Add LCNB to Watchlist: View: Get Complete LCNB Trend Analysis ➞ | |
 | GAMB Gambling.com Group Limited |
| Sector: Services & Goods | |
| SubSector: Gambling | |
| MarketCap: 376 Millions | |
| Recent Price: 9.04 Smart Investing & Trading Score: 60 | |
| Day Percent Change: 0.44% Day Change: 0.04 | |
| Week Change: 3.55% Year-to-date Change: -7.4% | |
| GAMB Links: Profile News Message Board | |
| Charts:- Daily , Weekly | |
| Add GAMB to Watchlist: View: Get Complete GAMB Trend Analysis ➞ | |
 | BFLY Butterfly Network, Inc. |
| Sector: Health Care | |
| SubSector: Medical Devices | |
| MarketCap: 461 Millions | |
| Recent Price: 1.04 Smart Investing & Trading Score: 74 | |
| Day Percent Change: 17.42% Day Change: 0.15 | |
| Week Change: 34.18% Year-to-date Change: -7.5% | |
| BFLY Links: Profile News Message Board | |
| Charts:- Daily , Weekly | |
| Add BFLY to Watchlist: View: Get Complete BFLY Trend Analysis ➞ | |
 | EBF Ennis, Inc. |
| Sector: Consumer Staples | |
| SubSector: Office Supplies | |
| MarketCap: 464.5 Millions | |
| Recent Price: 20.26 Smart Investing & Trading Score: 82 | |
| Day Percent Change: -0.05% Day Change: -0.01 | |
| Week Change: 2.84% Year-to-date Change: -7.5% | |
| EBF Links: Profile News Message Board | |
| Charts:- Daily , Weekly | |
| Add EBF to Watchlist: View: Get Complete EBF Trend Analysis ➞ | |
 | BSRR Sierra Bancorp |
| Sector: Financials | |
| SubSector: Regional - Pacific Banks | |
| MarketCap: 256.929 Millions | |
| Recent Price: 20.85 Smart Investing & Trading Score: 95 | |
| Day Percent Change: -0.33% Day Change: -0.07 | |
| Week Change: 1.71% Year-to-date Change: -7.5% | |
| BSRR Links: Profile News Message Board | |
| Charts:- Daily , Weekly | |
| Add BSRR to Watchlist: View: Get Complete BSRR Trend Analysis ➞ | |
 | EFC Ellington Financial Inc. |
| Sector: Financials | |
| SubSector: Mortgage Investment | |
| MarketCap: 380.239 Millions | |
| Recent Price: 11.66 Smart Investing & Trading Score: 95 | |
| Day Percent Change: 0.09% Day Change: 0.01 | |
| Week Change: -0.43% Year-to-date Change: -8.3% | |
| EFC Links: Profile News Message Board | |
| Charts:- Daily , Weekly | |
| Add EFC to Watchlist: View: Get Complete EFC Trend Analysis ➞ | |
 | DHIL Diamond Hill Investment Group, Inc. |
| Sector: Financials | |
| SubSector: Asset Management | |
| MarketCap: 316.203 Millions | |
| Recent Price: 151.90 Smart Investing & Trading Score: 100 | |
| Day Percent Change: -0.01% Day Change: -0.02 | |
| Week Change: 0.27% Year-to-date Change: -8.3% | |
| DHIL Links: Profile News Message Board | |
| Charts:- Daily , Weekly | |
| Add DHIL to Watchlist: View: Get Complete DHIL Trend Analysis ➞ | |
 | FLNG Flex LNG Ltd. |
| Sector: Energy | |
| SubSector: Oil & Gas Equipment & Services | |
| MarketCap: 220.261 Millions | |
| Recent Price: 26.60 Smart Investing & Trading Score: 100 | |
| Day Percent Change: 0.34% Day Change: 0.09 | |
| Week Change: 1.72% Year-to-date Change: -8.5% | |
| FLNG Links: Profile News Message Board | |
| Charts:- Daily , Weekly | |
| Add FLNG to Watchlist: View: Get Complete FLNG Trend Analysis ➞ | |
 | AVTE Aerovate Therapeutics, Inc. |
| Sector: Health Care | |
| SubSector: Biotechnology | |
| MarketCap: 478 Millions | |
| Recent Price: 20.63 Smart Investing & Trading Score: 25 | |
| Day Percent Change: -0.70% Day Change: -0.14 | |
| Week Change: -5.17% Year-to-date Change: -8.6% | |
| AVTE Links: Profile News Message Board | |
| Charts:- Daily , Weekly | |
| Add AVTE to Watchlist: View: Get Complete AVTE Trend Analysis ➞ | |
 | HIFS Hingham Institution for Savings |
| Sector: Financials | |
| SubSector: Savings & Loans | |
| MarketCap: 341.93 Millions | |
| Recent Price: 177.63 Smart Investing & Trading Score: 93 | |
| Day Percent Change: 0.53% Day Change: 0.93 | |
| Week Change: 2.77% Year-to-date Change: -8.6% | |
| HIFS Links: Profile News Message Board | |
| Charts:- Daily , Weekly | |
| Add HIFS to Watchlist: View: Get Complete HIFS Trend Analysis ➞ | |
 | CCS Century Communities, Inc. |
| Sector: Industrials | |
| SubSector: Residential Construction | |
| MarketCap: 459.206 Millions | |
| Recent Price: 83.27 Smart Investing & Trading Score: 49 | |
| Day Percent Change: 1.66% Day Change: 1.36 | |
| Week Change: 5.65% Year-to-date Change: -8.6% | |
| CCS Links: Profile News Message Board | |
| Charts:- Daily , Weekly | |
| Add CCS to Watchlist: View: Get Complete CCS Trend Analysis ➞ | |
 | IMXI International Money Express, Inc. |
| Sector: Services & Goods | |
| SubSector: Business Services | |
| MarketCap: 326.582 Millions | |
| Recent Price: 20.15 Smart Investing & Trading Score: 61 | |
| Day Percent Change: 0.73% Day Change: 0.14 | |
| Week Change: -5.69% Year-to-date Change: -8.8% | |
| IMXI Links: Profile News Message Board | |
| Charts:- Daily , Weekly | |
| Add IMXI to Watchlist: View: Get Complete IMXI Trend Analysis ➞ | |
 | WNC Wabash National Corporation |
| Sector: Consumer Staples | |
| SubSector: Trucks & Other Vehicles | |
| MarketCap: 482.597 Millions | |
| Recent Price: 23.34 Smart Investing & Trading Score: 32 | |
| Day Percent Change: 1.97% Day Change: 0.45 | |
| Week Change: -5.16% Year-to-date Change: -8.9% | |
| WNC Links: Profile News Message Board | |
| Charts:- Daily , Weekly | |
| Add WNC to Watchlist: View: Get Complete WNC Trend Analysis ➞ | |
 | NC NACCO Industries, Inc. |
| Sector: Consumer Staples | |
| SubSector: Home Furnishings & Fixtures | |
| MarketCap: 179.835 Millions | |
| Recent Price: 33.22 Smart Investing & Trading Score: 74 | |
| Day Percent Change: 4.83% Day Change: 1.53 | |
| Week Change: 18.01% Year-to-date Change: -9.0% | |
| NC Links: Profile News Message Board | |
| Charts:- Daily , Weekly | |
| Add NC to Watchlist: View: Get Complete NC Trend Analysis ➞ | |
 | NBR Nabors Industries Ltd. |
| Sector: Energy | |
| SubSector: Oil & Gas Drilling & Exploration | |
| MarketCap: 240.539 Millions | |
| Recent Price: 74.23 Smart Investing & Trading Score: 42 | |
| Day Percent Change: 5.50% Day Change: 3.87 | |
| Week Change: -3.85% Year-to-date Change: -9.1% | |
| NBR Links: Profile News Message Board | |
| Charts:- Daily , Weekly | |
| Add NBR to Watchlist: View: Get Complete NBR Trend Analysis ➞ | |
 | FC Franklin Covey Co. |
| Sector: Services & Goods | |
| SubSector: Education & Training Services | |
| MarketCap: 243.306 Millions | |
| Recent Price: 39.53 Smart Investing & Trading Score: 95 | |
| Day Percent Change: -0.75% Day Change: -0.30 | |
| Week Change: -0.03% Year-to-date Change: -9.2% | |
| FC Links: Profile News Message Board | |
| Charts:- Daily , Weekly | |
| Add FC to Watchlist: View: Get Complete FC Trend Analysis ➞ | |
 | OMGA Omega Therapeutics, Inc. |
| Sector: Health Care | |
| SubSector: Biotechnology | |
| MarketCap: 304 Millions | |
| Recent Price: 2.73 Smart Investing & Trading Score: 74 | |
| Day Percent Change: 7.48% Day Change: 0.19 | |
| Week Change: 20.26% Year-to-date Change: -9.3% | |
| OMGA Links: Profile News Message Board | |
| Charts:- Daily , Weekly | |
| Add OMGA to Watchlist: View: Get Complete OMGA Trend Analysis ➞ | |
| For tabular summary view of above stock list: Summary View ➞ 0 - 25 , 25 - 50 , 50 - 75 , 75 - 100 , 100 - 125 , 125 - 150 , 150 - 175 , 175 - 200 , 200 - 225 , 225 - 250 , 250 - 275 , 275 - 300 , 300 - 325 , 325 - 350 , 350 - 375 , 375 - 400 , 400 - 425 , 425 - 450 , 450 - 475 , 475 - 500 , 500 - 525 | ||
| Click To Change The Sort Order: By Market Cap or Company Size Performance: Year-to-date, Week and Day | |
| Select Chart Type: | ||
| Too many stocks? View smallcap stocks filtered by marketcap & sector |
| Marketcap: All SmallCap Stocks (default-no microcap), Large, Mid-Range, Small & MicroCap |
| Sector: Tech, Finance, Energy, Staples, Retail, Industrial, Materials, Utilities & Medical |
|
Best Stocks Today 12Stocks.com |
© 2024 12Stocks.com Terms & Conditions Privacy Contact Us
All Information Provided Only For Education And Not To Be Used For Investing or Trading. See Terms & Conditions


One More Thing ... Get Best Stocks Delivered Daily!
Never Ever Miss A Move With Our Top Ten Stocks Lists
Find Best Stocks In Any Market - Bull or Bear Market
Take A Peek At Our Top Ten Stocks Lists: Daily, Weekly, Year-to-Date & Top Trends
Find Best Stocks In Any Market - Bull or Bear Market
Take A Peek At Our Top Ten Stocks Lists: Daily, Weekly, Year-to-Date & Top Trends
Smallcap Stocks With Best Up Trends [0-bearish to 100-bullish]: Twist Bioscience[100], WideOpenWest [100], Joint [100], FTC Solar[100], Origin Materials[100], Alignment Healthcare[100], Clarus [100], IES [100], Emergent BioSolutions[100], Enovix [100], El Pollo[100]
Best Smallcap Stocks Year-to-Date:
Janux [482.74%], Viking [313.59%], Longboard [272.5%], Alpine Immune[239.23%], Bakkt [199.55%], Avidity Biosciences[192.48%], Vera [189.47%], Cullinan Oncology[176.9%], Super Micro[175.35%], Y-mAbs [151.47%], Sana [149.33%] Best Smallcap Stocks This Week:
Emergent BioSolutions[102.6%], Deciphera [73.24%], Origin Materials[66.52%], Eyenovia [57.77%], Cue Biopharma[56.04%], Aspen Aerogels[55.96%], Enovix [54.02%], Luna Innovations[53.77%], Codexis [47.37%], Carvana Co[44.31%], Office Properties[42.79%] Best Smallcap Stocks Daily:
Luna Innovations[36.00%], Twist Bioscience[28.74%], Ardelyx [28.42%], WideOpenWest [28.23%], 2U [26.63%], Joint [25.35%], FTC Solar[25.09%], Origin Materials[22.23%], Alignment Healthcare[21.97%], Clarus [18.34%], Aurora Innovation[18.09%]