
 Login Sign Up


| |||||
 |  | ||||

| 12Stocks.com Market Intelligence |
Best SmallCap Stocks
|
| In a hurry? Small Cap Stock Lists: Performance Trends Table, Stock Charts
Sort Small Cap stocks: Daily, Weekly, Year-to-Date, Market Cap & Trends. Filter Small Cap stocks list by sector: Show all, Tech, Finance, Energy, Staples, Retail, Industrial, Materials, Utilities and HealthCare Filter Small Cap stocks list by size: All Large Medium Small and MicroCap |
| 12Stocks.com Small Cap Stocks Performances & Trends Daily | |||||||||
|
|  The overall Smart Investing & Trading Score is 69 (0-bearish to 100-bullish) which puts Small Cap index in short term neutral to bullish trend. The Smart Investing & Trading Score from previous trading session is 49 and hence an improvement of trend.
| ||||||||
Here are the Smart Investing & Trading Scores of the most requested small cap stocks at 12Stocks.com (click stock name for detailed review):
|


| 12Stocks.com: Investing in Smallcap Index with Stocks | |
|
The following table helps investors and traders sort through current performance and trends (as measured by Smart Investing & Trading Score) of various
stocks in the Smallcap Index. Quick View: Move mouse or cursor over stock symbol (ticker) to view short-term technical chart and over stock name to view long term chart. Click on  to add stock symbol to your watchlist and to add stock symbol to your watchlist and  to view watchlist. Click on any ticker or stock name for detailed market intelligence report for that stock. to view watchlist. Click on any ticker or stock name for detailed market intelligence report for that stock. |
12Stocks.com Performance of Stocks in Smallcap Index
| Ticker | Stock Name | Watchlist | Category | Recent Price | Smart Investing & Trading Score | Change % | YTD Change% |
| RPHM | Reneo |   | Health Care | 1.73 | 78 | -0.57% | 6.79% |
| THRD | Third Harmonic | | Health Care | 11.68 | 93 | 0.78% | 6.04% |
| DCO | Ducommun | | Industrials | 55.13 | 93 | 0.12% | 5.91% |
| SKYT | SkyWater | | Technology | 10.20 | 40 | -2.49% | 5.81% |
| NGVC | Natural Grocers | | Services & Goods | 16.93 | 90 | 0.65% | 5.81% |
| HLX | Helix Energy | | Energy | 10.88 | 58 | 0.42% | 5.79% |
| BBSI | Barrett Business | | Services & Goods | 122.50 | 53 | 2.51% | 5.78% |
| CPF | Central Pacific | | Financials | 20.76 | 100 | 1.07% | 5.49% |
| OLP | One Liberty | | Financials | 23.04 | 76 | -0.84% | 5.13% |
| AOMR | Angel Oak | | Financials | 11.13 | 78 | 0.04% | 4.85% |
| OSW | OneSpaWorld | | Services & Goods | 14.76 | 100 | -0.67% | 4.68% |
| RGCO | RGC Resources | | Utilities | 21.27 | 88 | 0.28% | 4.57% |
| MITK | Mitek Systems | | Technology | 13.62 | 80 | 4.05% | 4.45% |
| VMD | Viemed Healthcare | | Health Care | 8.19 | 15 | 0.00% | 4.33% |
| MORF | Morphic Holding | | Health Care | 30.12 | 74 | 4.91% | 4.29% |
| TCBX | Third Coast | | Financials | 20.77 | 100 | 0.78% | 3.80% |
| HAYN | Haynes | | Industrials | 59.21 | 13 | -0.77% | 3.79% |
| MRC | MRC Global | | Energy | 11.40 | 32 | -0.26% | 3.54% |
| SWIM | Latham Group | | Industrials | 2.73 | 22 | 13.51% | 3.41% |
| VYGR | Voyager | | Health Care | 8.72 | 100 | 2.23% | 3.32% |
| SNDX | Syndax | | Health Care | 22.30 | 74 | 2.01% | 3.19% |
| GLUE | Monte Rosa | | Health Care | 5.79 | 30 | 4.51% | 2.84% |
| GOOD | Gladstone Commercial | | Financials | 13.61 | 100 | 0.00% | 2.79% |
| LMNR | Limoneira | | Consumer Staples | 21.20 | 100 | -1.14% | 2.79% |
| PAR | PAR | | Technology | 44.71 | 90 | 4.05% | 2.69% |
| For chart view version of above stock list: Chart View ➞ 0 - 25 , 25 - 50 , 50 - 75 , 75 - 100 , 100 - 125 , 125 - 150 , 150 - 175 , 175 - 200 , 200 - 225 , 225 - 250 , 250 - 275 , 275 - 300 , 300 - 325 , 325 - 350 , 350 - 375 , 375 - 400 , 400 - 425 , 425 - 450 , 450 - 475 , 475 - 500 , 500 - 525 | ||
 | Click To Change The Sort Order: By Market Cap or Company Size Performance: Year-to-date, Week and Day |  |
| Too many stocks? View smallcap stocks filtered by marketcap & sector |
| Marketcap: All SmallCap Stocks (default-no microcap), Large, Mid-Range, Small |
| Smallcap Sector: Tech, Finance, Energy, Staples, Retail, Industrial, Materials, & Medical |
|
Get the most comprehensive stock market coverage daily at 12Stocks.com ➞ Best Stocks Today ➞ Best Stocks Weekly ➞ Best Stocks Year-to-Date ➞ Best Stocks Trends ➞  Best Stocks Today 12Stocks.com Best Nasdaq Stocks ➞ Best S&P 500 Stocks ➞ Best Tech Stocks ➞ Best Biotech Stocks ➞ |
| Detailed Overview of SmallCap Stocks |
| SmallCap Technical Overview, Leaders & Laggards, Top SmallCap ETF Funds & Detailed SmallCap Stocks List, Charts, Trends & More |
| Smallcap: Technical Analysis, Trends & YTD Performance | |
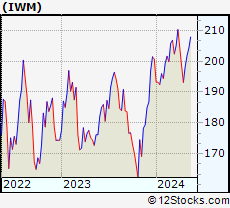
| SmallCap segment as represented by
IWM, an exchange-traded fund [ETF], holds basket of thousands of smallcap stocks from across all major sectors of the US stock market. The smallcap index (contains stocks like Riverbed & Sotheby's) is up by 0.22% and is currently underperforming the overall market by -6.27% year-to-date. Below is a quick view of technical charts and trends: | |
 IWM Weekly Chart |
|
| Long Term Trend: Not Good | |
| Medium Term Trend: Very Good | |
 IWM Daily Chart |
|
| Short Term Trend: Very Good | |
| Overall Trend Score: 69 | |
| YTD Performance: 0.22% | |
| **Trend Scores & Views Are Only For Educational Purposes And Not For Investing | |
| 12Stocks.com: Top Performing Small Cap Index Stocks | ||||||||||||||||||||||||||||||||||||||||||||||||
 The top performing Small Cap Index stocks year to date are
Now, more recently, over last week, the top performing Small Cap Index stocks on the move are


|
||||||||||||||||||||||||||||||||||||||||||||||||
| 12Stocks.com: Investing in Smallcap Index using Exchange Traded Funds | |
|
The following table shows list of key exchange traded funds (ETF) that
help investors track Smallcap index. The following list also includes leveraged ETF funds that track twice or thrice the daily returns of Smallcap indices. Short or inverse ETF funds move in the opposite direction to the index they track and are useful during market pullbacks or during bear markets. Quick View: Move mouse or cursor over ETF symbol (ticker) to view short-term technical chart and over ETF name to view long term chart. Click on ticker or stock name for detailed view. Click on to add stock symbol to your watchlist and to view watchlist. |
12Stocks.com List of ETFs that track Smallcap Index
| Ticker | ETF Name | Watchlist | Recent Price | Smart Investing & Trading Score | Change % | Week % | Year-to-date % |
| IWM | iShares Russell 2000 | | 201.15 | 69 | 0.61 | 1.39 | 0.22% |
| IJR | iShares Core S&P Small-Cap | | 106.83 | 82 | 0.47 | 1.12 | -1.31% |
| SDD | ProShares UltraShort SmallCap600 | | 18.35 | 10 | -4.97 | -5.17 | -0.42% |
| SBB | ProShares Short SmallCap600 | | 16.33 | 41 | -0.25 | -0.34 | 2.51% |
| SAA | ProShares Ultra SmallCap600 | | 23.93 | 82 | 4.36 | 3.88 | -4.07% |
| 12Stocks.com: Charts, Trends, Fundamental Data and Performances of SmallCap Stocks | |
|
We now take in-depth look at all SmallCap stocks including charts, multi-period performances and overall trends (as measured by Smart Investing & Trading Score). One can sort SmallCap stocks (click link to choose) by Daily, Weekly and by Year-to-Date performances. Also, one can sort by size of the company or by market capitalization. |
| Select Your Default Chart Type: | |||||
| |||||
| Click on stock symbol or name for detailed view. Click on to add stock symbol to your watchlist and to view watchlist. Quick View: Move mouse or cursor over "Daily" to quickly view daily technical stock chart and over "Weekly" to view weekly technical stock chart. | |||||

 | RPHM Reneo Pharmaceuticals, Inc. |
| Sector: Health Care | |
| SubSector: Biotechnology | |
| MarketCap: 233 Millions | |
| Recent Price: 1.73 Smart Investing & Trading Score: 78 | |
| Day Percent Change: -0.57% Day Change: -0.01 | |
| Week Change: 3.59% Year-to-date Change: 6.8% | |
| RPHM Links: Profile News Message Board | |
| Charts:- Daily , Weekly | |
| Add RPHM to Watchlist: View: Get Complete RPHM Trend Analysis ➞ | |
 | THRD Third Harmonic Bio, Inc. |
| Sector: Health Care | |
| SubSector: Biotechnology | |
| MarketCap: 190 Millions | |
| Recent Price: 11.68 Smart Investing & Trading Score: 93 | |
| Day Percent Change: 0.78% Day Change: 0.09 | |
| Week Change: 7.85% Year-to-date Change: 6.0% | |
| THRD Links: Profile News Message Board | |
| Charts:- Daily , Weekly | |
| Add THRD to Watchlist: View: Get Complete THRD Trend Analysis ➞ | |
 | DCO Ducommun Incorporated |
| Sector: Industrials | |
| SubSector: Aerospace/Defense Products & Services | |
| MarketCap: 261.101 Millions | |
| Recent Price: 55.13 Smart Investing & Trading Score: 93 | |
| Day Percent Change: 0.12% Day Change: 0.06 | |
| Week Change: 2.22% Year-to-date Change: 5.9% | |
| DCO Links: Profile News Message Board | |
| Charts:- Daily , Weekly | |
| Add DCO to Watchlist: View: Get Complete DCO Trend Analysis ➞ | |
 | SKYT SkyWater Technology, Inc. |
| Sector: Technology | |
| SubSector: Semiconductors | |
| MarketCap: 394 Millions | |
| Recent Price: 10.20 Smart Investing & Trading Score: 40 | |
| Day Percent Change: -2.49% Day Change: -0.26 | |
| Week Change: 4.72% Year-to-date Change: 5.8% | |
| SKYT Links: Profile News Message Board | |
| Charts:- Daily , Weekly | |
| Add SKYT to Watchlist: View: Get Complete SKYT Trend Analysis ➞ | |
 | NGVC Natural Grocers by Vitamin Cottage, Inc. |
| Sector: Services & Goods | |
| SubSector: Grocery Stores | |
| MarketCap: 185.475 Millions | |
| Recent Price: 16.93 Smart Investing & Trading Score: 90 | |
| Day Percent Change: 0.65% Day Change: 0.11 | |
| Week Change: 0.3% Year-to-date Change: 5.8% | |
| NGVC Links: Profile News Message Board | |
| Charts:- Daily , Weekly | |
| Add NGVC to Watchlist: View: Get Complete NGVC Trend Analysis ➞ | |
 | HLX Helix Energy Solutions Group, Inc. |
| Sector: Energy | |
| SubSector: Oil & Gas Equipment & Services | |
| MarketCap: 341.661 Millions | |
| Recent Price: 10.88 Smart Investing & Trading Score: 58 | |
| Day Percent Change: 0.42% Day Change: 0.04 | |
| Week Change: -3.93% Year-to-date Change: 5.8% | |
| HLX Links: Profile News Message Board | |
| Charts:- Daily , Weekly | |
| Add HLX to Watchlist: View: Get Complete HLX Trend Analysis ➞ | |
 | BBSI Barrett Business Services, Inc. |
| Sector: Services & Goods | |
| SubSector: Staffing & Outsourcing Services | |
| MarketCap: 262.028 Millions | |
| Recent Price: 122.50 Smart Investing & Trading Score: 53 | |
| Day Percent Change: 2.51% Day Change: 3.01 | |
| Week Change: 0.6% Year-to-date Change: 5.8% | |
| BBSI Links: Profile News Message Board | |
| Charts:- Daily , Weekly | |
| Add BBSI to Watchlist: View: Get Complete BBSI Trend Analysis ➞ | |
 | CPF Central Pacific Financial Corp. |
| Sector: Financials | |
| SubSector: Regional - Pacific Banks | |
| MarketCap: 407.429 Millions | |
| Recent Price: 20.76 Smart Investing & Trading Score: 100 | |
| Day Percent Change: 1.07% Day Change: 0.22 | |
| Week Change: 3.18% Year-to-date Change: 5.5% | |
| CPF Links: Profile News Message Board | |
| Charts:- Daily , Weekly | |
| Add CPF to Watchlist: View: Get Complete CPF Trend Analysis ➞ | |
 | OLP One Liberty Properties, Inc. |
| Sector: Financials | |
| SubSector: REIT - Diversified | |
| MarketCap: 378.353 Millions | |
| Recent Price: 23.04 Smart Investing & Trading Score: 76 | |
| Day Percent Change: -0.84% Day Change: -0.20 | |
| Week Change: 1.34% Year-to-date Change: 5.1% | |
| OLP Links: Profile News Message Board | |
| Charts:- Daily , Weekly | |
| Add OLP to Watchlist: View: Get Complete OLP Trend Analysis ➞ | |
 | AOMR Angel Oak Mortgage REIT, Inc. |
| Sector: Financials | |
| SubSector: REIT - Mortgage | |
| MarketCap: 202 Millions | |
| Recent Price: 11.13 Smart Investing & Trading Score: 78 | |
| Day Percent Change: 0.04% Day Change: 0.01 | |
| Week Change: 2.16% Year-to-date Change: 4.9% | |
| AOMR Links: Profile News Message Board | |
| Charts:- Daily , Weekly | |
| Add AOMR to Watchlist: View: Get Complete AOMR Trend Analysis ➞ | |
 | OSW OneSpaWorld Holdings Limited |
| Sector: Services & Goods | |
| SubSector: Resorts & Casinos | |
| MarketCap: 228.394 Millions | |
| Recent Price: 14.76 Smart Investing & Trading Score: 100 | |
| Day Percent Change: -0.67% Day Change: -0.10 | |
| Week Change: 15.49% Year-to-date Change: 4.7% | |
| OSW Links: Profile News Message Board | |
| Charts:- Daily , Weekly | |
| Add OSW to Watchlist: View: Get Complete OSW Trend Analysis ➞ | |
 | RGCO RGC Resources, Inc. |
| Sector: Utilities | |
| SubSector: Gas Utilities | |
| MarketCap: 215.277 Millions | |
| Recent Price: 21.27 Smart Investing & Trading Score: 88 | |
| Day Percent Change: 0.28% Day Change: 0.06 | |
| Week Change: 3.71% Year-to-date Change: 4.6% | |
| RGCO Links: Profile News Message Board | |
| Charts:- Daily , Weekly | |
| Add RGCO to Watchlist: View: Get Complete RGCO Trend Analysis ➞ | |
 | MITK Mitek Systems, Inc. |
| Sector: Technology | |
| SubSector: Application Software | |
| MarketCap: 265.962 Millions | |
| Recent Price: 13.62 Smart Investing & Trading Score: 80 | |
| Day Percent Change: 4.05% Day Change: 0.53 | |
| Week Change: 7.24% Year-to-date Change: 4.5% | |
| MITK Links: Profile News Message Board | |
| Charts:- Daily , Weekly | |
| Add MITK to Watchlist: View: Get Complete MITK Trend Analysis ➞ | |
 | VMD Viemed Healthcare, Inc. |
| Sector: Health Care | |
| SubSector: Medical Appliances & Equipment | |
| MarketCap: 177.28 Millions | |
| Recent Price: 8.19 Smart Investing & Trading Score: 15 | |
| Day Percent Change: 0.00% Day Change: 0.00 | |
| Week Change: -1.44% Year-to-date Change: 4.3% | |
| VMD Links: Profile News Message Board | |
| Charts:- Daily , Weekly | |
| Add VMD to Watchlist: View: Get Complete VMD Trend Analysis ➞ | |
 | MORF Morphic Holding, Inc. |
| Sector: Health Care | |
| SubSector: Biotechnology | |
| MarketCap: 484.885 Millions | |
| Recent Price: 30.12 Smart Investing & Trading Score: 74 | |
| Day Percent Change: 4.91% Day Change: 1.41 | |
| Week Change: 7.3% Year-to-date Change: 4.3% | |
| MORF Links: Profile News Message Board | |
| Charts:- Daily , Weekly | |
| Add MORF to Watchlist: View: Get Complete MORF Trend Analysis ➞ | |
 | TCBX Third Coast Bancshares, Inc. |
| Sector: Financials | |
| SubSector: Banks - Regional | |
| MarketCap: 212 Millions | |
| Recent Price: 20.77 Smart Investing & Trading Score: 100 | |
| Day Percent Change: 0.78% Day Change: 0.16 | |
| Week Change: 4.37% Year-to-date Change: 3.8% | |
| TCBX Links: Profile News Message Board | |
| Charts:- Daily , Weekly | |
| Add TCBX to Watchlist: View: Get Complete TCBX Trend Analysis ➞ | |
 | HAYN Haynes International, Inc. |
| Sector: Industrials | |
| SubSector: Metal Fabrication | |
| MarketCap: 245.75 Millions | |
| Recent Price: 59.21 Smart Investing & Trading Score: 13 | |
| Day Percent Change: -0.77% Day Change: -0.46 | |
| Week Change: -1.82% Year-to-date Change: 3.8% | |
| HAYN Links: Profile News Message Board | |
| Charts:- Daily , Weekly | |
| Add HAYN to Watchlist: View: Get Complete HAYN Trend Analysis ➞ | |
 | MRC MRC Global Inc. |
| Sector: Energy | |
| SubSector: Oil & Gas Equipment & Services | |
| MarketCap: 364.061 Millions | |
| Recent Price: 11.40 Smart Investing & Trading Score: 32 | |
| Day Percent Change: -0.26% Day Change: -0.03 | |
| Week Change: -1.72% Year-to-date Change: 3.5% | |
| MRC Links: Profile News Message Board | |
| Charts:- Daily , Weekly | |
| Add MRC to Watchlist: View: Get Complete MRC Trend Analysis ➞ | |
 | SWIM Latham Group, Inc. |
| Sector: Industrials | |
| SubSector: Building Products & Equipment | |
| MarketCap: 388 Millions | |
| Recent Price: 2.73 Smart Investing & Trading Score: 22 | |
| Day Percent Change: 13.51% Day Change: 0.33 | |
| Week Change: -10.49% Year-to-date Change: 3.4% | |
| SWIM Links: Profile News Message Board | |
| Charts:- Daily , Weekly | |
| Add SWIM to Watchlist: View: Get Complete SWIM Trend Analysis ➞ | |
 | VYGR Voyager Therapeutics, Inc. |
| Sector: Health Care | |
| SubSector: Biotechnology | |
| MarketCap: 321.085 Millions | |
| Recent Price: 8.72 Smart Investing & Trading Score: 100 | |
| Day Percent Change: 2.23% Day Change: 0.19 | |
| Week Change: 14.44% Year-to-date Change: 3.3% | |
| VYGR Links: Profile News Message Board | |
| Charts:- Daily , Weekly | |
| Add VYGR to Watchlist: View: Get Complete VYGR Trend Analysis ➞ | |
 | SNDX Syndax Pharmaceuticals, Inc. |
| Sector: Health Care | |
| SubSector: Biotechnology | |
| MarketCap: 365.985 Millions | |
| Recent Price: 22.30 Smart Investing & Trading Score: 74 | |
| Day Percent Change: 2.01% Day Change: 0.44 | |
| Week Change: 5.89% Year-to-date Change: 3.2% | |
| SNDX Links: Profile News Message Board | |
| Charts:- Daily , Weekly | |
| Add SNDX to Watchlist: View: Get Complete SNDX Trend Analysis ➞ | |
 | GLUE Monte Rosa Therapeutics, Inc. |
| Sector: Health Care | |
| SubSector: Biotechnology | |
| MarketCap: 346 Millions | |
| Recent Price: 5.79 Smart Investing & Trading Score: 30 | |
| Day Percent Change: 4.51% Day Change: 0.25 | |
| Week Change: 8.63% Year-to-date Change: 2.8% | |
| GLUE Links: Profile News Message Board | |
| Charts:- Daily , Weekly | |
| Add GLUE to Watchlist: View: Get Complete GLUE Trend Analysis ➞ | |
 | GOOD Gladstone Commercial Corporation |
| Sector: Financials | |
| SubSector: REIT - Diversified | |
| MarketCap: 425.253 Millions | |
| Recent Price: 13.61 Smart Investing & Trading Score: 100 | |
| Day Percent Change: 0.00% Day Change: 0.00 | |
| Week Change: 2.1% Year-to-date Change: 2.8% | |
| GOOD Links: Profile News Message Board | |
| Charts:- Daily , Weekly | |
| Add GOOD to Watchlist: View: Get Complete GOOD Trend Analysis ➞ | |
 | LMNR Limoneira Company |
| Sector: Consumer Staples | |
| SubSector: Farm Products | |
| MarketCap: 324.987 Millions | |
| Recent Price: 21.20 Smart Investing & Trading Score: 100 | |
| Day Percent Change: -1.14% Day Change: -0.25 | |
| Week Change: 6.83% Year-to-date Change: 2.8% | |
| LMNR Links: Profile News Message Board | |
| Charts:- Daily , Weekly | |
| Add LMNR to Watchlist: View: Get Complete LMNR Trend Analysis ➞ | |
 | PAR PAR Technology Corporation |
| Sector: Technology | |
| SubSector: Application Software | |
| MarketCap: 255.862 Millions | |
| Recent Price: 44.71 Smart Investing & Trading Score: 90 | |
| Day Percent Change: 4.05% Day Change: 1.74 | |
| Week Change: 3.4% Year-to-date Change: 2.7% | |
| PAR Links: Profile News Message Board | |
| Charts:- Daily , Weekly | |
| Add PAR to Watchlist: View: Get Complete PAR Trend Analysis ➞ | |
| For tabular summary view of above stock list: Summary View ➞ 0 - 25 , 25 - 50 , 50 - 75 , 75 - 100 , 100 - 125 , 125 - 150 , 150 - 175 , 175 - 200 , 200 - 225 , 225 - 250 , 250 - 275 , 275 - 300 , 300 - 325 , 325 - 350 , 350 - 375 , 375 - 400 , 400 - 425 , 425 - 450 , 450 - 475 , 475 - 500 , 500 - 525 | ||
| Click To Change The Sort Order: By Market Cap or Company Size Performance: Year-to-date, Week and Day | |
| Select Chart Type: | ||
| Too many stocks? View smallcap stocks filtered by marketcap & sector |
| Marketcap: All SmallCap Stocks (default-no microcap), Large, Mid-Range, Small & MicroCap |
| Sector: Tech, Finance, Energy, Staples, Retail, Industrial, Materials, Utilities & Medical |
|
Best Stocks Today 12Stocks.com |
© 2024 12Stocks.com Terms & Conditions Privacy Contact Us
All Information Provided Only For Education And Not To Be Used For Investing or Trading. See Terms & Conditions


One More Thing ... Get Best Stocks Delivered Daily!
Never Ever Miss A Move With Our Top Ten Stocks Lists
Find Best Stocks In Any Market - Bull or Bear Market
Take A Peek At Our Top Ten Stocks Lists: Daily, Weekly, Year-to-Date & Top Trends
Find Best Stocks In Any Market - Bull or Bear Market
Take A Peek At Our Top Ten Stocks Lists: Daily, Weekly, Year-to-Date & Top Trends
Smallcap Stocks With Best Up Trends [0-bearish to 100-bullish]: WideOpenWest [100], FTC Solar[100], IES [100], Origin Materials[100], Alignment Healthcare[100], Joint [100], Emergent BioSolutions[100], Adtalem Global[100], El Pollo[100], Enovix [100], Clearfield [100]
Best Smallcap Stocks Year-to-Date:
Janux [482.74%], Viking [306.72%], Longboard [272.5%], Alpine Immune[239.34%], Bakkt [199.55%], Avidity Biosciences[195.24%], Vera [189.47%], Cullinan Oncology[176.9%], Super Micro[173.85%], Arcutis Bio[169.66%], Y-mAbs [154.69%] Best Smallcap Stocks This Week:
Emergent BioSolutions[102.34%], Deciphera [73.28%], Eyenovia [68.74%], Origin Materials[66.52%], Aspen Aerogels[54.66%], Enovix [51.85%], TPI Composites[41.91%], Codexis [41.73%], Cue Biopharma[41.39%], WideOpenWest [41.07%], Carvana Co[39.19%] Best Smallcap Stocks Daily:
WideOpenWest [29.16%], Ardelyx [28.65%], FTC Solar[25.09%], IES [23.96%], Twist Bioscience[23.18%], Origin Materials[22.23%], Alignment Healthcare[21.97%], Joint [18.43%], Emergent BioSolutions[17.73%], Butterfly [17.42%], Vaxxinity [17.27%]