
 Login Sign Up


| |||||
 |  | ||||

| 12Stocks.com Market Intelligence |
Best SmallCap Stocks
|
| In a hurry? Small Cap Stock Lists: Performance Trends Table, Stock Charts
Sort Small Cap stocks: Daily, Weekly, Year-to-Date, Market Cap & Trends. Filter Small Cap stocks list by sector: Show all, Tech, Finance, Energy, Staples, Retail, Industrial, Materials, Utilities and HealthCare Filter Small Cap stocks list by size: All Large Medium Small and MicroCap |
| 12Stocks.com Small Cap Stocks Performances & Trends Daily | |||||||||
|
|  The overall Smart Investing & Trading Score is 87 (0-bearish to 100-bullish) which puts Small Cap index in short term bullish trend. The Smart Investing & Trading Score from previous trading session is 82 and hence an improvement of trend.
| ||||||||
Here are the Smart Investing & Trading Scores of the most requested small cap stocks at 12Stocks.com (click stock name for detailed review):
|


| 12Stocks.com: Investing in Smallcap Index with Stocks | |
|
The following table helps investors and traders sort through current performance and trends (as measured by Smart Investing & Trading Score) of various
stocks in the Smallcap Index. Quick View: Move mouse or cursor over stock symbol (ticker) to view short-term technical chart and over stock name to view long term chart. Click on  to add stock symbol to your watchlist and to add stock symbol to your watchlist and  to view watchlist. Click on any ticker or stock name for detailed market intelligence report for that stock. to view watchlist. Click on any ticker or stock name for detailed market intelligence report for that stock. |
12Stocks.com Performance of Stocks in Smallcap Index
| Ticker | Stock Name | Watchlist | Category | Recent Price | Smart Investing & Trading Score | Change % | YTD Change% |
| CEVA | CEVA |   | Technology | 20.78 | 74 | -0.95% | -8.50% |
| XPOF | Xponential Fitness | | Services & Goods | 11.92 | 36 | -2.01% | -8.59% |
| AMTB | Amerant Bancorp | | Financials | 22.44 | 68 | -0.80% | -8.67% |
| NMRK | Newmark Group | | Financials | 10.00 | 57 | -0.99% | -8.76% |
| CLB | Core | | Energy | 16.08 | 68 | 0.12% | -8.95% |
| EGRX | Eagle | | Health Care | 4.75 | 69 | 3.94% | -9.18% |
| BHLB | Berkshire Hills | | Financials | 22.51 | 90 | 0.00% | -9.34% |
| AGM | Federal Agricultural | | Financials | 173.25 | 0 | -6.47% | -9.40% |
| SYBT | Stock Yards | | Financials | 46.64 | 69 | -0.28% | -9.42% |
| MYPS | PLAYSTUDIOS | | Services & Goods | 2.42 | 95 | 4.09% | -9.53% |
| SIG | Signet Jewelers | | Services & Goods | 96.75 | 50 | -0.44% | -9.80% |
| TRST | TrustCo Bank | | Financials | 27.89 | 95 | -1.20% | -10.18% |
| ROIC | Retail Opportunity | | Financials | 12.58 | 74 | 1.37% | -10.33% |
| ASTE | Astec Industries | | Industrials | 33.34 | 25 | 2.14% | -10.38% |
| OCFC | OceanFirst Financial | | Financials | 15.51 | 88 | -0.70% | -10.66% |
| PETQ | PetIQ | | Health Care | 17.59 | 64 | -0.37% | -10.96% |
| AHH | Armada Hoffler | | Financials | 11.00 | 95 | -0.09% | -11.08% |
| FCF | First Commonwealth | | Financials | 13.70 | 76 | -0.51% | -11.27% |
| CBL | CBL & Associates Properties | | Financials | 21.66 | 45 | 0.60% | -11.30% |
| ABR | Arbor Realty | | Financials | 13.46 | 87 | 0.30% | -11.33% |
| EFSC | Enterprise Financial | | Financials | 39.50 | 42 | -0.65% | -11.53% |
| GSBC | Great Southern | | Financials | 52.42 | 61 | -2.67% | -11.68% |
| HA | Hawaiian | | Transports | 12.50 | 35 | 1.79% | -11.97% |
| SBSI | Southside Bancshares | | Financials | 27.54 | 33 | -0.83% | -12.07% |
| HFWA | Heritage Financial | | Financials | 18.72 | 76 | -1.63% | -12.48% |
| For chart view version of above stock list: Chart View ➞ 0 - 25 , 25 - 50 , 50 - 75 , 75 - 100 , 100 - 125 , 125 - 150 , 150 - 175 , 175 - 200 , 200 - 225 , 225 - 250 , 250 - 275 , 275 - 300 , 300 - 325 , 325 - 350 | ||
 | Click To Change The Sort Order: By Market Cap or Company Size Performance: Year-to-date, Week and Day |  |
| Too many stocks? View smallcap stocks filtered by marketcap & sector |
| Marketcap: All SmallCap Stocks (default-no microcap), Large, Mid-Range, Small |
| Smallcap Sector: Tech, Finance, Energy, Staples, Retail, Industrial, Materials, & Medical |
|
Get the most comprehensive stock market coverage daily at 12Stocks.com ➞ Best Stocks Today ➞ Best Stocks Weekly ➞ Best Stocks Year-to-Date ➞ Best Stocks Trends ➞  Best Stocks Today 12Stocks.com Best Nasdaq Stocks ➞ Best S&P 500 Stocks ➞ Best Tech Stocks ➞ Best Biotech Stocks ➞ |
| Detailed Overview of SmallCap Stocks |
| SmallCap Technical Overview, Leaders & Laggards, Top SmallCap ETF Funds & Detailed SmallCap Stocks List, Charts, Trends & More |
| Smallcap: Technical Analysis, Trends & YTD Performance | |
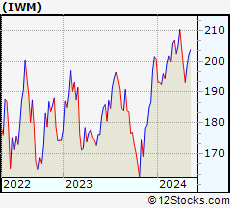
| SmallCap segment as represented by
IWM, an exchange-traded fund [ETF], holds basket of thousands of smallcap stocks from across all major sectors of the US stock market. The smallcap index (contains stocks like Riverbed & Sotheby's) is up by 2.12% and is currently underperforming the overall market by -6% year-to-date. Below is a quick view of technical charts and trends: | |
 IWM Weekly Chart |
|
| Long Term Trend: Very Good | |
| Medium Term Trend: Very Good | |
 IWM Daily Chart |
|
| Short Term Trend: Very Good | |
| Overall Trend Score: 87 | |
| YTD Performance: 2.12% | |
| **Trend Scores & Views Are Only For Educational Purposes And Not For Investing | |
| 12Stocks.com: Top Performing Small Cap Index Stocks | ||||||||||||||||||||||||||||||||||||||||||||||||
 The top performing Small Cap Index stocks year to date are
Now, more recently, over last week, the top performing Small Cap Index stocks on the move are


|
||||||||||||||||||||||||||||||||||||||||||||||||
| 12Stocks.com: Investing in Smallcap Index using Exchange Traded Funds | |
|
The following table shows list of key exchange traded funds (ETF) that
help investors track Smallcap index. The following list also includes leveraged ETF funds that track twice or thrice the daily returns of Smallcap indices. Short or inverse ETF funds move in the opposite direction to the index they track and are useful during market pullbacks or during bear markets. Quick View: Move mouse or cursor over ETF symbol (ticker) to view short-term technical chart and over ETF name to view long term chart. Click on ticker or stock name for detailed view. Click on to add stock symbol to your watchlist and to view watchlist. |
12Stocks.com List of ETFs that track Smallcap Index
| Ticker | ETF Name | Watchlist | Recent Price | Smart Investing & Trading Score | Change % | Week % | Year-to-date % |
| IWM | iShares Russell 2000 | | 204.97 | 87 | 0.22 | 1.52 | 2.12% |
| IJR | iShares Core S&P Small-Cap | | 108.62 | 100 | 0.33 | 1.39 | 0.34% |
| VTWO | Vanguard Russell 2000 ETF | | 82.84 | 82 | 0.22 | 1.51 | 2.15% |
| IWN | iShares Russell 2000 Value | | 155.63 | 100 | -0.01 | 0.92 | 0.19% |
| IWO | iShares Russell 2000 Growth | | 262.30 | 69 | 0.49 | 2.11 | 4% |
| IJS | iShares S&P Small-Cap 600 Value | | 99.68 | 82 | -0.07 | 0.97 | -3.29% |
| IJT | iShares S&P Small-Cap 600 Growth | | 129.84 | 95 | 0.56 | 1.63 | 3.76% |
| XSLV | PowerShares S&P SmallCap Low Volatil ETF | | 44.00 | 100 | 0.96 | 1.8 | -0.34% |
| SAA | ProShares Ultra SmallCap600 | | 24.39 | 95 | 1.16 | 3.39 | -2.24% |
| SMLV | SPDR SSGA US Small Cap Low Volatil ETF | | 110.48 | 100 | -0.10 | 0.72 | -1.81% |
| SBB | ProShares Short SmallCap600 | | 15.97 | 0 | -0.50 | -1.18 | 0.25% |
| SDD | ProShares UltraShort SmallCap600 | | 18.22 | 10 | -1.10 | -3.33 | -1.13% |
| 12Stocks.com: Charts, Trends, Fundamental Data and Performances of SmallCap Stocks | |
|
We now take in-depth look at all SmallCap stocks including charts, multi-period performances and overall trends (as measured by Smart Investing & Trading Score). One can sort SmallCap stocks (click link to choose) by Daily, Weekly and by Year-to-Date performances. Also, one can sort by size of the company or by market capitalization. |
| Select Your Default Chart Type: | |||||
| |||||
| Click on stock symbol or name for detailed view. Click on to add stock symbol to your watchlist and to view watchlist. Quick View: Move mouse or cursor over "Daily" to quickly view daily technical stock chart and over "Weekly" to view weekly technical stock chart. | |||||

 | CEVA CEVA, Inc. |
| Sector: Technology | |
| SubSector: Semiconductor - Specialized | |
| MarketCap: 587.06 Millions | |
| Recent Price: 20.78 Smart Investing & Trading Score: 74 | |
| Day Percent Change: -0.95% Day Change: -0.20 | |
| Week Change: 1.22% Year-to-date Change: -8.5% | |
| CEVA Links: Profile News Message Board | |
| Charts:- Daily , Weekly | |
| Add CEVA to Watchlist: View: Get Complete CEVA Trend Analysis ➞ | |
 | XPOF Xponential Fitness, Inc. |
| Sector: Services & Goods | |
| SubSector: Leisure | |
| MarketCap: 811 Millions | |
| Recent Price: 11.92 Smart Investing & Trading Score: 36 | |
| Day Percent Change: -2.01% Day Change: -0.24 | |
| Week Change: -8.06% Year-to-date Change: -8.6% | |
| XPOF Links: Profile News Message Board | |
| Charts:- Daily , Weekly | |
| Add XPOF to Watchlist: View: Get Complete XPOF Trend Analysis ➞ | |
 | AMTB Amerant Bancorp Inc. |
| Sector: Financials | |
| SubSector: Regional - Midwest Banks | |
| MarketCap: 653.87 Millions | |
| Recent Price: 22.44 Smart Investing & Trading Score: 68 | |
| Day Percent Change: -0.80% Day Change: -0.18 | |
| Week Change: -0.75% Year-to-date Change: -8.7% | |
| AMTB Links: Profile News Message Board | |
| Charts:- Daily , Weekly | |
| Add AMTB to Watchlist: View: Get Complete AMTB Trend Analysis ➞ | |
 | NMRK Newmark Group, Inc. |
| Sector: Financials | |
| SubSector: Property Management | |
| MarketCap: 767.542 Millions | |
| Recent Price: 10.00 Smart Investing & Trading Score: 57 | |
| Day Percent Change: -0.99% Day Change: -0.10 | |
| Week Change: 0.1% Year-to-date Change: -8.8% | |
| NMRK Links: Profile News Message Board | |
| Charts:- Daily , Weekly | |
| Add NMRK to Watchlist: View: Get Complete NMRK Trend Analysis ➞ | |
 | CLB Core Laboratories N.V. |
| Sector: Energy | |
| SubSector: Oil & Gas Equipment & Services | |
| MarketCap: 599.661 Millions | |
| Recent Price: 16.08 Smart Investing & Trading Score: 68 | |
| Day Percent Change: 0.12% Day Change: 0.02 | |
| Week Change: 1.01% Year-to-date Change: -9.0% | |
| CLB Links: Profile News Message Board | |
| Charts:- Daily , Weekly | |
| Add CLB to Watchlist: View: Get Complete CLB Trend Analysis ➞ | |
 | EGRX Eagle Pharmaceuticals, Inc. |
| Sector: Health Care | |
| SubSector: Drugs - Generic | |
| MarketCap: 573.385 Millions | |
| Recent Price: 4.75 Smart Investing & Trading Score: 69 | |
| Day Percent Change: 3.94% Day Change: 0.18 | |
| Week Change: 7.71% Year-to-date Change: -9.2% | |
| EGRX Links: Profile News Message Board | |
| Charts:- Daily , Weekly | |
| Add EGRX to Watchlist: View: Get Complete EGRX Trend Analysis ➞ | |
 | BHLB Berkshire Hills Bancorp, Inc. |
| Sector: Financials | |
| SubSector: Savings & Loans | |
| MarketCap: 686.33 Millions | |
| Recent Price: 22.51 Smart Investing & Trading Score: 90 | |
| Day Percent Change: 0.00% Day Change: 0.00 | |
| Week Change: 0.67% Year-to-date Change: -9.3% | |
| BHLB Links: Profile News Message Board | |
| Charts:- Daily , Weekly | |
| Add BHLB to Watchlist: View: Get Complete BHLB Trend Analysis ➞ | |
 | AGM Federal Agricultural Mortgage Corporation |
| Sector: Financials | |
| SubSector: Credit Services | |
| MarketCap: 542.008 Millions | |
| Recent Price: 173.25 Smart Investing & Trading Score: 0 | |
| Day Percent Change: -6.47% Day Change: -11.99 | |
| Week Change: -10.8% Year-to-date Change: -9.4% | |
| AGM Links: Profile News Message Board | |
| Charts:- Daily , Weekly | |
| Add AGM to Watchlist: View: Get Complete AGM Trend Analysis ➞ | |
 | SYBT Stock Yards Bancorp, Inc. |
| Sector: Financials | |
| SubSector: Regional - Southeast Banks | |
| MarketCap: 629.235 Millions | |
| Recent Price: 46.64 Smart Investing & Trading Score: 69 | |
| Day Percent Change: -0.28% Day Change: -0.13 | |
| Week Change: -0.7% Year-to-date Change: -9.4% | |
| SYBT Links: Profile News Message Board | |
| Charts:- Daily , Weekly | |
| Add SYBT to Watchlist: View: Get Complete SYBT Trend Analysis ➞ | |
 | MYPS PLAYSTUDIOS, Inc. |
| Sector: Services & Goods | |
| SubSector: Electronic Gaming & Multimedia | |
| MarketCap: 635 Millions | |
| Recent Price: 2.42 Smart Investing & Trading Score: 95 | |
| Day Percent Change: 4.09% Day Change: 0.09 | |
| Week Change: 4.99% Year-to-date Change: -9.5% | |
| MYPS Links: Profile News Message Board | |
| Charts:- Daily , Weekly | |
| Add MYPS to Watchlist: View: Get Complete MYPS Trend Analysis ➞ | |
 | SIG Signet Jewelers Limited |
| Sector: Services & Goods | |
| SubSector: Jewelry Stores | |
| MarketCap: 518.1 Millions | |
| Recent Price: 96.75 Smart Investing & Trading Score: 50 | |
| Day Percent Change: -0.44% Day Change: -0.43 | |
| Week Change: 2.54% Year-to-date Change: -9.8% | |
| SIG Links: Profile News Message Board | |
| Charts:- Daily , Weekly | |
| Add SIG to Watchlist: View: Get Complete SIG Trend Analysis ➞ | |
 | TRST TrustCo Bank Corp NY |
| Sector: Financials | |
| SubSector: Regional - Northeast Banks | |
| MarketCap: 543.999 Millions | |
| Recent Price: 27.89 Smart Investing & Trading Score: 95 | |
| Day Percent Change: -1.20% Day Change: -0.34 | |
| Week Change: -0.14% Year-to-date Change: -10.2% | |
| TRST Links: Profile News Message Board | |
| Charts:- Daily , Weekly | |
| Add TRST to Watchlist: View: Get Complete TRST Trend Analysis ➞ | |
 | ROIC Retail Opportunity Investments Corp. |
| Sector: Financials | |
| SubSector: REIT - Retail | |
| MarketCap: 943.414 Millions | |
| Recent Price: 12.58 Smart Investing & Trading Score: 74 | |
| Day Percent Change: 1.37% Day Change: 0.17 | |
| Week Change: 1.62% Year-to-date Change: -10.3% | |
| ROIC Links: Profile News Message Board | |
| Charts:- Daily , Weekly | |
| Add ROIC to Watchlist: View: Get Complete ROIC Trend Analysis ➞ | |
 | ASTE Astec Industries, Inc. |
| Sector: Industrials | |
| SubSector: Farm & Construction Machinery | |
| MarketCap: 731.607 Millions | |
| Recent Price: 33.34 Smart Investing & Trading Score: 25 | |
| Day Percent Change: 2.14% Day Change: 0.70 | |
| Week Change: 2.96% Year-to-date Change: -10.4% | |
| ASTE Links: Profile News Message Board | |
| Charts:- Daily , Weekly | |
| Add ASTE to Watchlist: View: Get Complete ASTE Trend Analysis ➞ | |
 | OCFC OceanFirst Financial Corp. |
| Sector: Financials | |
| SubSector: Savings & Loans | |
| MarketCap: 867.43 Millions | |
| Recent Price: 15.51 Smart Investing & Trading Score: 88 | |
| Day Percent Change: -0.70% Day Change: -0.11 | |
| Week Change: 0.39% Year-to-date Change: -10.7% | |
| OCFC Links: Profile News Message Board | |
| Charts:- Daily , Weekly | |
| Add OCFC to Watchlist: View: Get Complete OCFC Trend Analysis ➞ | |
 | PETQ PetIQ, Inc. |
| Sector: Health Care | |
| SubSector: Drugs - Generic | |
| MarketCap: 587.585 Millions | |
| Recent Price: 17.59 Smart Investing & Trading Score: 64 | |
| Day Percent Change: -0.37% Day Change: -0.06 | |
| Week Change: 3.2% Year-to-date Change: -11.0% | |
| PETQ Links: Profile News Message Board | |
| Charts:- Daily , Weekly | |
| Add PETQ to Watchlist: View: Get Complete PETQ Trend Analysis ➞ | |
 | AHH Armada Hoffler Properties, Inc. |
| Sector: Financials | |
| SubSector: REIT - Diversified | |
| MarketCap: 550.653 Millions | |
| Recent Price: 11.00 Smart Investing & Trading Score: 95 | |
| Day Percent Change: -0.09% Day Change: -0.01 | |
| Week Change: 1.57% Year-to-date Change: -11.1% | |
| AHH Links: Profile News Message Board | |
| Charts:- Daily , Weekly | |
| Add AHH to Watchlist: View: Get Complete AHH Trend Analysis ➞ | |
 | FCF First Commonwealth Financial Corporation |
| Sector: Financials | |
| SubSector: Regional - Northeast Banks | |
| MarketCap: 900.299 Millions | |
| Recent Price: 13.70 Smart Investing & Trading Score: 76 | |
| Day Percent Change: -0.51% Day Change: -0.07 | |
| Week Change: 0.22% Year-to-date Change: -11.3% | |
| FCF Links: Profile News Message Board | |
| Charts:- Daily , Weekly | |
| Add FCF to Watchlist: View: Get Complete FCF Trend Analysis ➞ | |
 | CBL CBL & Associates Properties, Inc. |
| Sector: Financials | |
| SubSector: REIT - Retail | |
| MarketCap: 690 Millions | |
| Recent Price: 21.66 Smart Investing & Trading Score: 45 | |
| Day Percent Change: 0.60% Day Change: 0.13 | |
| Week Change: -0.23% Year-to-date Change: -11.3% | |
| CBL Links: Profile News Message Board | |
| Charts:- Daily , Weekly | |
| Add CBL to Watchlist: View: Get Complete CBL Trend Analysis ➞ | |
 | ABR Arbor Realty Trust, Inc. |
| Sector: Financials | |
| SubSector: Mortgage Investment | |
| MarketCap: 648.939 Millions | |
| Recent Price: 13.46 Smart Investing & Trading Score: 87 | |
| Day Percent Change: 0.30% Day Change: 0.04 | |
| Week Change: 4.42% Year-to-date Change: -11.3% | |
| ABR Links: Profile News Message Board | |
| Charts:- Daily , Weekly | |
| Add ABR to Watchlist: View: Get Complete ABR Trend Analysis ➞ | |
 | EFSC Enterprise Financial Services Corp |
| Sector: Financials | |
| SubSector: Regional - Southwest Banks | |
| MarketCap: 770.165 Millions | |
| Recent Price: 39.50 Smart Investing & Trading Score: 42 | |
| Day Percent Change: -0.65% Day Change: -0.26 | |
| Week Change: 0.28% Year-to-date Change: -11.5% | |
| EFSC Links: Profile News Message Board | |
| Charts:- Daily , Weekly | |
| Add EFSC to Watchlist: View: Get Complete EFSC Trend Analysis ➞ | |
 | GSBC Great Southern Bancorp, Inc. |
| Sector: Financials | |
| SubSector: Regional - Southwest Banks | |
| MarketCap: 524.765 Millions | |
| Recent Price: 52.42 Smart Investing & Trading Score: 61 | |
| Day Percent Change: -2.67% Day Change: -1.44 | |
| Week Change: -2.49% Year-to-date Change: -11.7% | |
| GSBC Links: Profile News Message Board | |
| Charts:- Daily , Weekly | |
| Add GSBC to Watchlist: View: Get Complete GSBC Trend Analysis ➞ | |
 | HA Hawaiian Holdings, Inc. |
| Sector: Transports | |
| SubSector: Regional Airlines | |
| MarketCap: 509.47 Millions | |
| Recent Price: 12.50 Smart Investing & Trading Score: 35 | |
| Day Percent Change: 1.79% Day Change: 0.22 | |
| Week Change: -0.08% Year-to-date Change: -12.0% | |
| HA Links: Profile News Message Board | |
| Charts:- Daily , Weekly | |
| Add HA to Watchlist: View: Get Complete HA Trend Analysis ➞ | |
 | SBSI Southside Bancshares, Inc. |
| Sector: Financials | |
| SubSector: Regional - Mid-Atlantic Banks | |
| MarketCap: 971.259 Millions | |
| Recent Price: 27.54 Smart Investing & Trading Score: 33 | |
| Day Percent Change: -0.83% Day Change: -0.23 | |
| Week Change: -0.43% Year-to-date Change: -12.1% | |
| SBSI Links: Profile News Message Board | |
| Charts:- Daily , Weekly | |
| Add SBSI to Watchlist: View: Get Complete SBSI Trend Analysis ➞ | |
 | HFWA Heritage Financial Corporation |
| Sector: Financials | |
| SubSector: Regional - Pacific Banks | |
| MarketCap: 752.829 Millions | |
| Recent Price: 18.72 Smart Investing & Trading Score: 76 | |
| Day Percent Change: -1.63% Day Change: -0.31 | |
| Week Change: -0.9% Year-to-date Change: -12.5% | |
| HFWA Links: Profile News Message Board | |
| Charts:- Daily , Weekly | |
| Add HFWA to Watchlist: View: Get Complete HFWA Trend Analysis ➞ | |
| For tabular summary view of above stock list: Summary View ➞ 0 - 25 , 25 - 50 , 50 - 75 , 75 - 100 , 100 - 125 , 125 - 150 , 150 - 175 , 175 - 200 , 200 - 225 , 225 - 250 , 250 - 275 , 275 - 300 , 300 - 325 , 325 - 350 | ||
| Click To Change The Sort Order: By Market Cap or Company Size Performance: Year-to-date, Week and Day | |
| Select Chart Type: | ||
| Too many stocks? View smallcap stocks filtered by marketcap & sector |
| Marketcap: All SmallCap Stocks (default-no microcap), Large, Mid-Range, Small & MicroCap |
| Sector: Tech, Finance, Energy, Staples, Retail, Industrial, Materials, Utilities & Medical |
|
Best Stocks Today 12Stocks.com |
© 2024 12Stocks.com Terms & Conditions Privacy Contact Us
All Information Provided Only For Education And Not To Be Used For Investing or Trading. See Terms & Conditions


One More Thing ... Get Best Stocks Delivered Daily!
Never Ever Miss A Move With Our Top Ten Stocks Lists
Find Best Stocks In Any Market - Bull or Bear Market
Take A Peek At Our Top Ten Stocks Lists: Daily, Weekly, Year-to-Date & Top Trends
Find Best Stocks In Any Market - Bull or Bear Market
Take A Peek At Our Top Ten Stocks Lists: Daily, Weekly, Year-to-Date & Top Trends
Smallcap Stocks With Best Up Trends [0-bearish to 100-bullish]: Design [100], Ambac Financial[100], Summit [100], EverQuote [100], Zeta Global[100], Coca-Cola Consolidated[100], J & J Snack Foods[100], Sterling Construction[100], Vanda [100], CPI Card[100], Semrush [100]
Best Smallcap Stocks Year-to-Date:
CareMax [570.1%], Janux [472.36%], Viking [327.78%], Longboard [260.8%], Alpine Immune[239.34%], Bakkt [226.91%], Vera [190.7%], Super Micro[188.22%], Cullinan Oncology[187.89%], Avidity Biosciences[180.86%], Y-mAbs [152.49%] Best Smallcap Stocks This Week:
Perficient [52.32%], Thoughtworks Holding[34.22%], Trupanion [28.72%], DASAN Zhone[26.29%], Great Lakes[25.72%], Workhorse Group[24.5%], Design [23.42%], Ambac Financial[22.97%], P3 Health[22.36%], Outset Medical[21.09%], Summit [20.96%] Best Smallcap Stocks Daily:
Design [28.85%], Great Lakes[24.29%], Thoughtworks Holding[19.84%], Ambac Financial[19.31%], Summit [18.79%], EverQuote [18.40%], Origin Materials[18.38%], Zeta Global[18.35%], FibroGen [18.10%], Coca-Cola Consolidated[17.65%], Children s[16.44%]