
 Login Sign Up


| |||||
 |  | ||||

| 12Stocks.com Market Intelligence |
Best SmallCap Stocks
|
| In a hurry? Small Cap Stock Lists: Performance Trends Table, Stock Charts
Sort Small Cap stocks: Daily, Weekly, Year-to-Date, Market Cap & Trends. Filter Small Cap stocks list by sector: Show all, Tech, Finance, Energy, Staples, Retail, Industrial, Materials, Utilities and HealthCare Filter Small Cap stocks list by size: All Large Medium Small and MicroCap |
| 12Stocks.com Small Cap Stocks Performances & Trends Daily | |||||||||
|
|  The overall Smart Investing & Trading Score is 87 (0-bearish to 100-bullish) which puts Small Cap index in short term bullish trend. The Smart Investing & Trading Score from previous trading session is 82 and hence an improvement of trend.
| ||||||||
Here are the Smart Investing & Trading Scores of the most requested small cap stocks at 12Stocks.com (click stock name for detailed review):
|


| 12Stocks.com: Investing in Smallcap Index with Stocks | |
|
The following table helps investors and traders sort through current performance and trends (as measured by Smart Investing & Trading Score) of various
stocks in the Smallcap Index. Quick View: Move mouse or cursor over stock symbol (ticker) to view short-term technical chart and over stock name to view long term chart. Click on  to add stock symbol to your watchlist and to add stock symbol to your watchlist and  to view watchlist. Click on any ticker or stock name for detailed market intelligence report for that stock. to view watchlist. Click on any ticker or stock name for detailed market intelligence report for that stock. |
12Stocks.com Performance of Stocks in Smallcap Index
| Ticker | Stock Name | Watchlist | Category | Recent Price | Smart Investing & Trading Score | Change % | YTD Change% |
| TRS | TriMas |   | Industrials | 26.25 | 68 | 0.73% | 3.63% |
| FOR | Forestar Group | | Financials | 34.16 | 90 | -1.01% | 3.30% |
| LAW | CS Disco | | Technology | 7.89 | 78 | -0.88% | 3.27% |
| OFIX | Orthofix Medical | | Health Care | 13.89 | 100 | 3.19% | 3.04% |
| CNDT | Conduent | | Technology | 3.76 | 83 | -2.59% | 3.01% |
| LC | LendingClub | | Financials | 8.99 | 68 | -1.75% | 2.86% |
| XPER | Xperi | | Technology | 11.24 | 100 | 1.54% | 2.00% |
| SAH | Sonic Automotive | | Services & Goods | 57.31 | 83 | -0.74% | 1.96% |
| RGR | Sturm Ruger | | Industrials | 46.33 | 43 | 0.11% | 1.94% |
| UTL | Unitil | | Utilities | 53.56 | 88 | 0.51% | 1.88% |
| AMWD | American Woodmark | | Consumer Staples | 94.48 | 57 | -1.02% | 1.76% |
| CASH | Meta Financial | | Financials | 53.86 | 100 | 0.02% | 1.76% |
| HMST | HomeStreet | | Financials | 10.48 | 15 | -1.96% | 1.75% |
| CSTM | Constellium SE | | Materials | 20.27 | 51 | -0.93% | 1.55% |
| SKT | Tanger Factory | | Financials | 28.14 | 57 | 2.59% | 1.52% |
| NWLI | National Western | | Financials | 489.55 | 68 | -0.05% | 1.35% |
| NXRT | NexPoint Residential | | Financials | 34.82 | 83 | -1.55% | 1.13% |
| BCC | Boise Cascade | | Industrials | 130.67 | 7 | -6.24% | 1.01% |
| TCMD | Tactile Systems | | Health Care | 14.44 | 25 | 1.76% | 0.98% |
| OFG | OFG Bancorp | | Financials | 37.73 | 90 | -0.74% | 0.67% |
| KAI | Kadant | | Industrials | 281.44 | 50 | 0.06% | 0.40% |
| VMEO | Vimeo | | Technology | 3.92 | 69 | 2.89% | -0.13% |
| PLUS | ePlus | | Technology | 79.73 | 64 | -0.01% | -0.14% |
| HSTM | HealthStream | | Technology | 26.94 | 57 | 0.48% | -0.33% |
| ITCI | Intra-Cellular Therapies | | Health Care | 71.21 | 68 | 0.28% | -0.57% |
| For chart view version of above stock list: Chart View ➞ 0 - 25 , 25 - 50 , 50 - 75 , 75 - 100 , 100 - 125 , 125 - 150 , 150 - 175 , 175 - 200 , 200 - 225 , 225 - 250 , 250 - 275 , 275 - 300 , 300 - 325 , 325 - 350 | ||
 | Click To Change The Sort Order: By Market Cap or Company Size Performance: Year-to-date, Week and Day |  |
| Too many stocks? View smallcap stocks filtered by marketcap & sector |
| Marketcap: All SmallCap Stocks (default-no microcap), Large, Mid-Range, Small |
| Smallcap Sector: Tech, Finance, Energy, Staples, Retail, Industrial, Materials, & Medical |
|
Get the most comprehensive stock market coverage daily at 12Stocks.com ➞ Best Stocks Today ➞ Best Stocks Weekly ➞ Best Stocks Year-to-Date ➞ Best Stocks Trends ➞  Best Stocks Today 12Stocks.com Best Nasdaq Stocks ➞ Best S&P 500 Stocks ➞ Best Tech Stocks ➞ Best Biotech Stocks ➞ |
| Detailed Overview of SmallCap Stocks |
| SmallCap Technical Overview, Leaders & Laggards, Top SmallCap ETF Funds & Detailed SmallCap Stocks List, Charts, Trends & More |
| Smallcap: Technical Analysis, Trends & YTD Performance | |
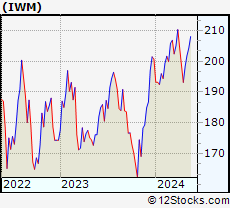
| SmallCap segment as represented by
IWM, an exchange-traded fund [ETF], holds basket of thousands of smallcap stocks from across all major sectors of the US stock market. The smallcap index (contains stocks like Riverbed & Sotheby's) is up by 2.12% and is currently underperforming the overall market by -6% year-to-date. Below is a quick view of technical charts and trends: | |
 IWM Weekly Chart |
|
| Long Term Trend: Very Good | |
| Medium Term Trend: Very Good | |
 IWM Daily Chart |
|
| Short Term Trend: Very Good | |
| Overall Trend Score: 87 | |
| YTD Performance: 2.12% | |
| **Trend Scores & Views Are Only For Educational Purposes And Not For Investing | |
| 12Stocks.com: Top Performing Small Cap Index Stocks | ||||||||||||||||||||||||||||||||||||||||||||||||
 The top performing Small Cap Index stocks year to date are
Now, more recently, over last week, the top performing Small Cap Index stocks on the move are


|
||||||||||||||||||||||||||||||||||||||||||||||||
| 12Stocks.com: Investing in Smallcap Index using Exchange Traded Funds | |
|
The following table shows list of key exchange traded funds (ETF) that
help investors track Smallcap index. The following list also includes leveraged ETF funds that track twice or thrice the daily returns of Smallcap indices. Short or inverse ETF funds move in the opposite direction to the index they track and are useful during market pullbacks or during bear markets. Quick View: Move mouse or cursor over ETF symbol (ticker) to view short-term technical chart and over ETF name to view long term chart. Click on ticker or stock name for detailed view. Click on to add stock symbol to your watchlist and to view watchlist. |
12Stocks.com List of ETFs that track Smallcap Index
| Ticker | ETF Name | Watchlist | Recent Price | Smart Investing & Trading Score | Change % | Week % | Year-to-date % |
| IWM | iShares Russell 2000 | | 204.97 | 87 | 0.22 | 1.52 | 2.12% |
| IJR | iShares Core S&P Small-Cap | | 108.62 | 100 | 0.33 | 1.39 | 0.34% |
| VTWO | Vanguard Russell 2000 ETF | | 82.84 | 82 | 0.22 | 1.51 | 2.15% |
| IWN | iShares Russell 2000 Value | | 155.63 | 100 | -0.01 | 0.92 | 0.19% |
| IWO | iShares Russell 2000 Growth | | 262.30 | 69 | 0.49 | 2.11 | 4% |
| IJS | iShares S&P Small-Cap 600 Value | | 99.68 | 82 | -0.07 | 0.97 | -3.29% |
| IJT | iShares S&P Small-Cap 600 Growth | | 129.84 | 95 | 0.56 | 1.63 | 3.76% |
| XSLV | PowerShares S&P SmallCap Low Volatil ETF | | 44.00 | 100 | 0.96 | 1.8 | -0.34% |
| SAA | ProShares Ultra SmallCap600 | | 24.39 | 95 | 1.16 | 3.39 | -2.24% |
| SMLV | SPDR SSGA US Small Cap Low Volatil ETF | | 110.48 | 100 | -0.10 | 0.72 | -1.81% |
| SBB | ProShares Short SmallCap600 | | 15.97 | 0 | -0.50 | -1.18 | 0.25% |
| SDD | ProShares UltraShort SmallCap600 | | 18.22 | 10 | -1.10 | -3.33 | -1.13% |
| 12Stocks.com: Charts, Trends, Fundamental Data and Performances of SmallCap Stocks | |
|
We now take in-depth look at all SmallCap stocks including charts, multi-period performances and overall trends (as measured by Smart Investing & Trading Score). One can sort SmallCap stocks (click link to choose) by Daily, Weekly and by Year-to-Date performances. Also, one can sort by size of the company or by market capitalization. |
| Select Your Default Chart Type: | |||||
| |||||
| Click on stock symbol or name for detailed view. Click on to add stock symbol to your watchlist and to view watchlist. Quick View: Move mouse or cursor over "Daily" to quickly view daily technical stock chart and over "Weekly" to view weekly technical stock chart. | |||||

 | TRS TriMas Corporation |
| Sector: Industrials | |
| SubSector: Industrial Equipment & Components | |
| MarketCap: 963.509 Millions | |
| Recent Price: 26.25 Smart Investing & Trading Score: 68 | |
| Day Percent Change: 0.73% Day Change: 0.19 | |
| Week Change: 0.15% Year-to-date Change: 3.6% | |
| TRS Links: Profile News Message Board | |
| Charts:- Daily , Weekly | |
| Add TRS to Watchlist: View: Get Complete TRS Trend Analysis ➞ | |
 | FOR Forestar Group Inc. |
| Sector: Financials | |
| SubSector: Real Estate Development | |
| MarketCap: 661.019 Millions | |
| Recent Price: 34.16 Smart Investing & Trading Score: 90 | |
| Day Percent Change: -1.01% Day Change: -0.35 | |
| Week Change: 1.76% Year-to-date Change: 3.3% | |
| FOR Links: Profile News Message Board | |
| Charts:- Daily , Weekly | |
| Add FOR to Watchlist: View: Get Complete FOR Trend Analysis ➞ | |
 | LAW CS Disco, Inc. |
| Sector: Technology | |
| SubSector: Software - Application | |
| MarketCap: 505 Millions | |
| Recent Price: 7.89 Smart Investing & Trading Score: 78 | |
| Day Percent Change: -0.88% Day Change: -0.07 | |
| Week Change: 0.57% Year-to-date Change: 3.3% | |
| LAW Links: Profile News Message Board | |
| Charts:- Daily , Weekly | |
| Add LAW to Watchlist: View: Get Complete LAW Trend Analysis ➞ | |
 | OFIX Orthofix Medical Inc. |
| Sector: Health Care | |
| SubSector: Medical Appliances & Equipment | |
| MarketCap: 508.18 Millions | |
| Recent Price: 13.89 Smart Investing & Trading Score: 100 | |
| Day Percent Change: 3.19% Day Change: 0.43 | |
| Week Change: 2.13% Year-to-date Change: 3.0% | |
| OFIX Links: Profile News Message Board | |
| Charts:- Daily , Weekly | |
| Add OFIX to Watchlist: View: Get Complete OFIX Trend Analysis ➞ | |
 | CNDT Conduent Incorporated |
| Sector: Technology | |
| SubSector: Information Technology Services | |
| MarketCap: 514.968 Millions | |
| Recent Price: 3.76 Smart Investing & Trading Score: 83 | |
| Day Percent Change: -2.59% Day Change: -0.10 | |
| Week Change: -2.84% Year-to-date Change: 3.0% | |
| CNDT Links: Profile News Message Board | |
| Charts:- Daily , Weekly | |
| Add CNDT to Watchlist: View: Get Complete CNDT Trend Analysis ➞ | |
 | LC LendingClub Corporation |
| Sector: Financials | |
| SubSector: Credit Services | |
| MarketCap: 852.308 Millions | |
| Recent Price: 8.99 Smart Investing & Trading Score: 68 | |
| Day Percent Change: -1.75% Day Change: -0.16 | |
| Week Change: -3.13% Year-to-date Change: 2.9% | |
| LC Links: Profile News Message Board | |
| Charts:- Daily , Weekly | |
| Add LC to Watchlist: View: Get Complete LC Trend Analysis ➞ | |
 | XPER Xperi Corporation |
| Sector: Technology | |
| SubSector: Semiconductor Equipment & Materials | |
| MarketCap: 631.618 Millions | |
| Recent Price: 11.24 Smart Investing & Trading Score: 100 | |
| Day Percent Change: 1.54% Day Change: 0.17 | |
| Week Change: 4.36% Year-to-date Change: 2.0% | |
| XPER Links: Profile News Message Board | |
| Charts:- Daily , Weekly | |
| Add XPER to Watchlist: View: Get Complete XPER Trend Analysis ➞ | |
 | SAH Sonic Automotive, Inc. |
| Sector: Services & Goods | |
| SubSector: Auto Dealerships | |
| MarketCap: 581.321 Millions | |
| Recent Price: 57.31 Smart Investing & Trading Score: 83 | |
| Day Percent Change: -0.74% Day Change: -0.43 | |
| Week Change: 1.56% Year-to-date Change: 2.0% | |
| SAH Links: Profile News Message Board | |
| Charts:- Daily , Weekly | |
| Add SAH to Watchlist: View: Get Complete SAH Trend Analysis ➞ | |
 | RGR Sturm, Ruger & Company, Inc. |
| Sector: Industrials | |
| SubSector: Aerospace/Defense Products & Services | |
| MarketCap: 752 Millions | |
| Recent Price: 46.33 Smart Investing & Trading Score: 43 | |
| Day Percent Change: 0.11% Day Change: 0.05 | |
| Week Change: -1.26% Year-to-date Change: 1.9% | |
| RGR Links: Profile News Message Board | |
| Charts:- Daily , Weekly | |
| Add RGR to Watchlist: View: Get Complete RGR Trend Analysis ➞ | |
 | UTL Unitil Corporation |
| Sector: Utilities | |
| SubSector: Diversified Utilities | |
| MarketCap: 756.98 Millions | |
| Recent Price: 53.56 Smart Investing & Trading Score: 88 | |
| Day Percent Change: 0.51% Day Change: 0.27 | |
| Week Change: 1.77% Year-to-date Change: 1.9% | |
| UTL Links: Profile News Message Board | |
| Charts:- Daily , Weekly | |
| Add UTL to Watchlist: View: Get Complete UTL Trend Analysis ➞ | |
 | AMWD American Woodmark Corporation |
| Sector: Consumer Staples | |
| SubSector: Home Furnishings & Fixtures | |
| MarketCap: 958.435 Millions | |
| Recent Price: 94.48 Smart Investing & Trading Score: 57 | |
| Day Percent Change: -1.02% Day Change: -0.97 | |
| Week Change: 0.03% Year-to-date Change: 1.8% | |
| AMWD Links: Profile News Message Board | |
| Charts:- Daily , Weekly | |
| Add AMWD to Watchlist: View: Get Complete AMWD Trend Analysis ➞ | |
 | CASH Meta Financial Group, Inc. |
| Sector: Financials | |
| SubSector: Savings & Loans | |
| MarketCap: 849.33 Millions | |
| Recent Price: 53.86 Smart Investing & Trading Score: 100 | |
| Day Percent Change: 0.02% Day Change: 0.01 | |
| Week Change: 1.76% Year-to-date Change: 1.8% | |
| CASH Links: Profile News Message Board | |
| Charts:- Daily , Weekly | |
| Add CASH to Watchlist: View: Get Complete CASH Trend Analysis ➞ | |
 | HMST HomeStreet, Inc. |
| Sector: Financials | |
| SubSector: Savings & Loans | |
| MarketCap: 535.33 Millions | |
| Recent Price: 10.48 Smart Investing & Trading Score: 15 | |
| Day Percent Change: -1.96% Day Change: -0.21 | |
| Week Change: -4.55% Year-to-date Change: 1.8% | |
| HMST Links: Profile News Message Board | |
| Charts:- Daily , Weekly | |
| Add HMST to Watchlist: View: Get Complete HMST Trend Analysis ➞ | |
 | CSTM Constellium SE |
| Sector: Materials | |
| SubSector: Aluminum | |
| MarketCap: 646.608 Millions | |
| Recent Price: 20.27 Smart Investing & Trading Score: 51 | |
| Day Percent Change: -0.93% Day Change: -0.19 | |
| Week Change: 0.3% Year-to-date Change: 1.6% | |
| CSTM Links: Profile News Message Board | |
| Charts:- Daily , Weekly | |
| Add CSTM to Watchlist: View: Get Complete CSTM Trend Analysis ➞ | |
 | SKT Tanger Factory Outlet Centers, Inc. |
| Sector: Financials | |
| SubSector: REIT - Retail | |
| MarketCap: 720.214 Millions | |
| Recent Price: 28.14 Smart Investing & Trading Score: 57 | |
| Day Percent Change: 2.59% Day Change: 0.71 | |
| Week Change: 2.48% Year-to-date Change: 1.5% | |
| SKT Links: Profile News Message Board | |
| Charts:- Daily , Weekly | |
| Add SKT to Watchlist: View: Get Complete SKT Trend Analysis ➞ | |
 | NWLI National Western Life Group, Inc. |
| Sector: Financials | |
| SubSector: Life Insurance | |
| MarketCap: 529 Millions | |
| Recent Price: 489.55 Smart Investing & Trading Score: 68 | |
| Day Percent Change: -0.05% Day Change: -0.25 | |
| Week Change: 0.22% Year-to-date Change: 1.4% | |
| NWLI Links: Profile News Message Board | |
| Charts:- Daily , Weekly | |
| Add NWLI to Watchlist: View: Get Complete NWLI Trend Analysis ➞ | |
 | NXRT NexPoint Residential Trust, Inc. |
| Sector: Financials | |
| SubSector: REIT - Residential | |
| MarketCap: 839.161 Millions | |
| Recent Price: 34.82 Smart Investing & Trading Score: 83 | |
| Day Percent Change: -1.55% Day Change: -0.55 | |
| Week Change: -0.09% Year-to-date Change: 1.1% | |
| NXRT Links: Profile News Message Board | |
| Charts:- Daily , Weekly | |
| Add NXRT to Watchlist: View: Get Complete NXRT Trend Analysis ➞ | |
 | BCC Boise Cascade Company |
| Sector: Industrials | |
| SubSector: Lumber, Wood Production | |
| MarketCap: 963.938 Millions | |
| Recent Price: 130.67 Smart Investing & Trading Score: 7 | |
| Day Percent Change: -6.24% Day Change: -8.70 | |
| Week Change: -3.95% Year-to-date Change: 1.0% | |
| BCC Links: Profile News Message Board | |
| Charts:- Daily , Weekly | |
| Add BCC to Watchlist: View: Get Complete BCC Trend Analysis ➞ | |
 | TCMD Tactile Systems Technology, Inc. |
| Sector: Health Care | |
| SubSector: Medical Instruments & Supplies | |
| MarketCap: 655.96 Millions | |
| Recent Price: 14.44 Smart Investing & Trading Score: 25 | |
| Day Percent Change: 1.76% Day Change: 0.25 | |
| Week Change: 1.16% Year-to-date Change: 1.0% | |
| TCMD Links: Profile News Message Board | |
| Charts:- Daily , Weekly | |
| Add TCMD to Watchlist: View: Get Complete TCMD Trend Analysis ➞ | |
 | OFG OFG Bancorp |
| Sector: Financials | |
| SubSector: Money Center Banks | |
| MarketCap: 537.599 Millions | |
| Recent Price: 37.73 Smart Investing & Trading Score: 90 | |
| Day Percent Change: -0.74% Day Change: -0.28 | |
| Week Change: 1.04% Year-to-date Change: 0.7% | |
| OFG Links: Profile News Message Board | |
| Charts:- Daily , Weekly | |
| Add OFG to Watchlist: View: Get Complete OFG Trend Analysis ➞ | |
 | KAI Kadant Inc. |
| Sector: Industrials | |
| SubSector: Diversified Machinery | |
| MarketCap: 787.116 Millions | |
| Recent Price: 281.44 Smart Investing & Trading Score: 50 | |
| Day Percent Change: 0.06% Day Change: 0.18 | |
| Week Change: 3.3% Year-to-date Change: 0.4% | |
| KAI Links: Profile News Message Board | |
| Charts:- Daily , Weekly | |
| Add KAI to Watchlist: View: Get Complete KAI Trend Analysis ➞ | |
 | VMEO Vimeo, Inc. |
| Sector: Technology | |
| SubSector: Software - Application | |
| MarketCap: 678 Millions | |
| Recent Price: 3.92 Smart Investing & Trading Score: 69 | |
| Day Percent Change: 2.89% Day Change: 0.11 | |
| Week Change: 6.81% Year-to-date Change: -0.1% | |
| VMEO Links: Profile News Message Board | |
| Charts:- Daily , Weekly | |
| Add VMEO to Watchlist: View: Get Complete VMEO Trend Analysis ➞ | |
 | PLUS ePlus inc. |
| Sector: Technology | |
| SubSector: Application Software | |
| MarketCap: 728.262 Millions | |
| Recent Price: 79.73 Smart Investing & Trading Score: 64 | |
| Day Percent Change: -0.01% Day Change: -0.01 | |
| Week Change: 2.32% Year-to-date Change: -0.1% | |
| PLUS Links: Profile News Message Board | |
| Charts:- Daily , Weekly | |
| Add PLUS to Watchlist: View: Get Complete PLUS Trend Analysis ➞ | |
 | HSTM HealthStream, Inc. |
| Sector: Technology | |
| SubSector: Healthcare Information Services | |
| MarketCap: 770.255 Millions | |
| Recent Price: 26.94 Smart Investing & Trading Score: 57 | |
| Day Percent Change: 0.48% Day Change: 0.13 | |
| Week Change: -0.33% Year-to-date Change: -0.3% | |
| HSTM Links: Profile News Message Board | |
| Charts:- Daily , Weekly | |
| Add HSTM to Watchlist: View: Get Complete HSTM Trend Analysis ➞ | |
 | ITCI Intra-Cellular Therapies, Inc. |
| Sector: Health Care | |
| SubSector: Biotechnology | |
| MarketCap: 991.885 Millions | |
| Recent Price: 71.21 Smart Investing & Trading Score: 68 | |
| Day Percent Change: 0.28% Day Change: 0.20 | |
| Week Change: 3.5% Year-to-date Change: -0.6% | |
| ITCI Links: Profile News Message Board | |
| Charts:- Daily , Weekly | |
| Add ITCI to Watchlist: View: Get Complete ITCI Trend Analysis ➞ | |
| For tabular summary view of above stock list: Summary View ➞ 0 - 25 , 25 - 50 , 50 - 75 , 75 - 100 , 100 - 125 , 125 - 150 , 150 - 175 , 175 - 200 , 200 - 225 , 225 - 250 , 250 - 275 , 275 - 300 , 300 - 325 , 325 - 350 | ||
| Click To Change The Sort Order: By Market Cap or Company Size Performance: Year-to-date, Week and Day | |
| Select Chart Type: | ||
| Too many stocks? View smallcap stocks filtered by marketcap & sector |
| Marketcap: All SmallCap Stocks (default-no microcap), Large, Mid-Range, Small & MicroCap |
| Sector: Tech, Finance, Energy, Staples, Retail, Industrial, Materials, Utilities & Medical |
|
Best Stocks Today 12Stocks.com |
© 2024 12Stocks.com Terms & Conditions Privacy Contact Us
All Information Provided Only For Education And Not To Be Used For Investing or Trading. See Terms & Conditions


One More Thing ... Get Best Stocks Delivered Daily!
Never Ever Miss A Move With Our Top Ten Stocks Lists
Find Best Stocks In Any Market - Bull or Bear Market
Take A Peek At Our Top Ten Stocks Lists: Daily, Weekly, Year-to-Date & Top Trends
Find Best Stocks In Any Market - Bull or Bear Market
Take A Peek At Our Top Ten Stocks Lists: Daily, Weekly, Year-to-Date & Top Trends
Smallcap Stocks With Best Up Trends [0-bearish to 100-bullish]: Design [100], Ambac Financial[100], Summit [100], EverQuote [100], Zeta Global[100], Coca-Cola Consolidated[100], J & J Snack Foods[100], Sterling Construction[100], Vanda [100], CPI Card[100], Semrush [100]
Best Smallcap Stocks Year-to-Date:
CareMax [570.1%], Janux [472.36%], Viking [327.78%], Longboard [260.8%], Alpine Immune[239.34%], Bakkt [226.91%], Vera [190.7%], Super Micro[188.22%], Cullinan Oncology[187.89%], Avidity Biosciences[180.86%], Y-mAbs [152.49%] Best Smallcap Stocks This Week:
Perficient [52.32%], Thoughtworks Holding[34.22%], Trupanion [28.72%], DASAN Zhone[26.29%], Great Lakes[25.72%], Workhorse Group[24.5%], Design [23.42%], Ambac Financial[22.97%], P3 Health[22.36%], Outset Medical[21.09%], Summit [20.96%] Best Smallcap Stocks Daily:
Design [28.85%], Great Lakes[24.29%], Thoughtworks Holding[19.84%], Ambac Financial[19.31%], Summit [18.79%], EverQuote [18.40%], Origin Materials[18.38%], Zeta Global[18.35%], FibroGen [18.10%], Coca-Cola Consolidated[17.65%], Children s[16.44%]