
 Login Sign Up


| |||||
 |  | ||||

| 12Stocks.com Market Intelligence |
Best SmallCap Stocks
|
| In a hurry? Small Cap Stock Lists: Performance Trends Table, Stock Charts
Sort Small Cap stocks: Daily, Weekly, Year-to-Date, Market Cap & Trends. Filter Small Cap stocks list by sector: Show all, Tech, Finance, Energy, Staples, Retail, Industrial, Materials, Utilities and HealthCare Filter Small Cap stocks list by size: All Large Medium Small and MicroCap |
| 12Stocks.com Small Cap Stocks Performances & Trends Daily | |||||||||
|
|  The overall Smart Investing & Trading Score is 70 (0-bearish to 100-bullish) which puts Small Cap index in short term neutral to bullish trend. The Smart Investing & Trading Score from previous trading session is 87 and hence a deterioration of trend.
| ||||||||
Here are the Smart Investing & Trading Scores of the most requested small cap stocks at 12Stocks.com (click stock name for detailed review):
|


| 12Stocks.com: Investing in Smallcap Index with Stocks | |
|
The following table helps investors and traders sort through current performance and trends (as measured by Smart Investing & Trading Score) of various
stocks in the Smallcap Index. Quick View: Move mouse or cursor over stock symbol (ticker) to view short-term technical chart and over stock name to view long term chart. Click on  to add stock symbol to your watchlist and to add stock symbol to your watchlist and  to view watchlist. Click on any ticker or stock name for detailed market intelligence report for that stock. to view watchlist. Click on any ticker or stock name for detailed market intelligence report for that stock. |
12Stocks.com Performance of Stocks in Smallcap Index
| Ticker | Stock Name | Watchlist | Category | Recent Price | Smart Investing & Trading Score | Change % | YTD Change% |
| VERA | Vera |   | Health Care | 44.94 | 50 | -0.13% | 190.31% |
| STOK | Stoke | | Health Care | 11.60 | 53 | -2.85% | 120.53% |
| ARIS | Aris Water | | Utilities | 17.05 | 100 | 9.29% | 103.22% |
| YMAB | Y-mAbs | | Health Care | 13.62 | 0 | -20.91% | 99.71% |
| EVER | EverQuote | | Financials | 23.82 | 95 | -5.81% | 94.61% |
| FTAI | Fortress Transportation | | Transports | 78.50 | 81 | 1.29% | 69.18% |
| MLYS | Mineralys | | Health Care | 14.65 | 74 | 3.39% | 68.00% |
| PRM | Perimeter Solutions | | Materials | 7.67 | 88 | 1.86% | 66.92% |
| MTTR | Matterport | | Technology | 4.43 | 61 | -1.34% | 64.07% |
| SPRY | ARS | | Health Care | 9.06 | 51 | -4.33% | 59.37% |
| CDLX | Cardlytics | | Technology | 14.59 | 58 | -5.44% | 58.41% |
| SILK | Silk Road | | Health Care | 19.22 | 58 | -6.47% | 56.64% |
| CDE | Coeur Mining | | Materials | 5.10 | 88 | -0.39% | 56.44% |
| RXST | RxSight | | Health Care | 60.66 | 76 | -2.46% | 51.23% |
| PAHC | Phibro Animal | | Health Care | 17.18 | 90 | 2.44% | 48.36% |
| CRS | Carpenter | | Industrials | 103.55 | 83 | 0.98% | 46.26% |
| ANF | Abercrombie & Fitch Co | | Services & Goods | 128.60 | 53 | 0.14% | 45.77% |
| BV | BrightView | | Industrials | 12.26 | 58 | -2.08% | 45.61% |
| BHE | Benchmark Electronics | | Technology | 40.04 | 100 | 2.30% | 44.86% |
| PRIM | Primoris Services | | Industrials | 47.80 | 73 | 0.27% | 43.93% |
| ORGN | Origin Materials | | Materials | 1.21 | 100 | 10.00% | 43.55% |
| AGX | Argan | | Industrials | 66.37 | 100 | 2.09% | 41.85% |
| CMPO | CompoSecure | | Industrials | 7.50 | 88 | -0.40% | 37.11% |
| ARDX | Ardelyx | | Health Care | 8.48 | 37 | -8.92% | 36.77% |
| PRDO | Perdoceo Education | | Services & Goods | 23.88 | 68 | -0.23% | 35.99% |
| For chart view version of above stock list: Chart View ➞ 0 - 25 , 25 - 50 , 50 - 75 , 75 - 100 , 100 - 125 , 125 - 150 , 150 - 175 , 175 - 200 , 200 - 225 , 225 - 250 , 250 - 275 , 275 - 300 , 300 - 325 , 325 - 350 | ||
 | Click To Change The Sort Order: By Market Cap or Company Size Performance: Year-to-date, Week and Day |  |
| Too many stocks? View smallcap stocks filtered by marketcap & sector |
| Marketcap: All SmallCap Stocks (default-no microcap), Large, Mid-Range, Small |
| Smallcap Sector: Tech, Finance, Energy, Staples, Retail, Industrial, Materials, & Medical |
|
Get the most comprehensive stock market coverage daily at 12Stocks.com ➞ Best Stocks Today ➞ Best Stocks Weekly ➞ Best Stocks Year-to-Date ➞ Best Stocks Trends ➞  Best Stocks Today 12Stocks.com Best Nasdaq Stocks ➞ Best S&P 500 Stocks ➞ Best Tech Stocks ➞ Best Biotech Stocks ➞ |
| Detailed Overview of SmallCap Stocks |
| SmallCap Technical Overview, Leaders & Laggards, Top SmallCap ETF Funds & Detailed SmallCap Stocks List, Charts, Trends & More |
| Smallcap: Technical Analysis, Trends & YTD Performance | |
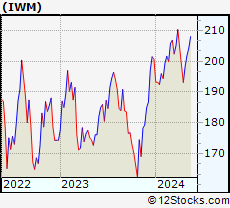
| SmallCap segment as represented by
IWM, an exchange-traded fund [ETF], holds basket of thousands of smallcap stocks from across all major sectors of the US stock market. The smallcap index (contains stocks like Riverbed & Sotheby's) is up by 1.53% and is currently underperforming the overall market by -6.51% year-to-date. Below is a quick view of technical charts and trends: | |
 IWM Weekly Chart |
|
| Long Term Trend: Very Good | |
| Medium Term Trend: Very Good | |
 IWM Daily Chart |
|
| Short Term Trend: Good | |
| Overall Trend Score: 70 | |
| YTD Performance: 1.53% | |
| **Trend Scores & Views Are Only For Educational Purposes And Not For Investing | |
| 12Stocks.com: Top Performing Small Cap Index Stocks | ||||||||||||||||||||||||||||||||||||||||||||||||
 The top performing Small Cap Index stocks year to date are
Now, more recently, over last week, the top performing Small Cap Index stocks on the move are


|
||||||||||||||||||||||||||||||||||||||||||||||||
| 12Stocks.com: Investing in Smallcap Index using Exchange Traded Funds | |
|
The following table shows list of key exchange traded funds (ETF) that
help investors track Smallcap index. The following list also includes leveraged ETF funds that track twice or thrice the daily returns of Smallcap indices. Short or inverse ETF funds move in the opposite direction to the index they track and are useful during market pullbacks or during bear markets. Quick View: Move mouse or cursor over ETF symbol (ticker) to view short-term technical chart and over ETF name to view long term chart. Click on ticker or stock name for detailed view. Click on to add stock symbol to your watchlist and to view watchlist. |
12Stocks.com List of ETFs that track Smallcap Index
| Ticker | ETF Name | Watchlist | Recent Price | Smart Investing & Trading Score | Change % | Week % | Year-to-date % |
| IWM | iShares Russell 2000 | | 203.78 | 70 | -0.58 | 0.93 | 1.53% |
| IJR | iShares Core S&P Small-Cap | | 108.26 | 88 | -0.33 | 1.05 | 0.01% |
| IWN | iShares Russell 2000 Value | | 155.37 | 88 | -0.17 | 0.75 | 0.03% |
| VTWO | Vanguard Russell 2000 ETF | | 82.40 | 57 | -0.53 | 0.97 | 1.6% |
| IWO | iShares Russell 2000 Growth | | 260.10 | 57 | -0.84 | 1.26 | 3.12% |
| IJS | iShares S&P Small-Cap 600 Value | | 99.80 | 70 | 0.12 | 1.09 | -3.17% |
| IJT | iShares S&P Small-Cap 600 Growth | | 129.03 | 83 | -0.62 | 0.99 | 3.11% |
| XSLV | PowerShares S&P SmallCap Low Volatil ETF | | 43.94 | 100 | -0.14 | 1.67 | -0.48% |
| SMLV | SPDR SSGA US Small Cap Low Volatil ETF | | 110.32 | 68 | -0.15 | 0.57 | -1.96% |
| SDD | ProShares UltraShort SmallCap600 | | 18.66 | 40 | 2.43 | -0.98 | 1.27% |
| SBB | ProShares Short SmallCap600 | | 16.08 | 38 | 0.69 | -0.5 | 0.94% |
| SAA | ProShares Ultra SmallCap600 | | 24.21 | 70 | -0.75 | 2.62 | -2.98% |
| 12Stocks.com: Charts, Trends, Fundamental Data and Performances of SmallCap Stocks | |
|
We now take in-depth look at all SmallCap stocks including charts, multi-period performances and overall trends (as measured by Smart Investing & Trading Score). One can sort SmallCap stocks (click link to choose) by Daily, Weekly and by Year-to-Date performances. Also, one can sort by size of the company or by market capitalization. |
| Select Your Default Chart Type: | |||||
| |||||
| Click on stock symbol or name for detailed view. Click on to add stock symbol to your watchlist and to view watchlist. Quick View: Move mouse or cursor over "Daily" to quickly view daily technical stock chart and over "Weekly" to view weekly technical stock chart. | |||||

 | VERA Vera Therapeutics, Inc. |
| Sector: Health Care | |
| SubSector: Biotechnology | |
| MarketCap: 746 Millions | |
| Recent Price: 44.94 Smart Investing & Trading Score: 50 | |
| Day Percent Change: -0.13% Day Change: -0.06 | |
| Week Change: 0.29% Year-to-date Change: 190.3% | |
| VERA Links: Profile News Message Board | |
| Charts:- Daily , Weekly | |
| Add VERA to Watchlist: View: Get Complete VERA Trend Analysis ➞ | |
 | STOK Stoke Therapeutics, Inc. |
| Sector: Health Care | |
| SubSector: Biotechnology | |
| MarketCap: 772.485 Millions | |
| Recent Price: 11.60 Smart Investing & Trading Score: 53 | |
| Day Percent Change: -2.85% Day Change: -0.34 | |
| Week Change: -3.49% Year-to-date Change: 120.5% | |
| STOK Links: Profile News Message Board | |
| Charts:- Daily , Weekly | |
| Add STOK to Watchlist: View: Get Complete STOK Trend Analysis ➞ | |
 | ARIS Aris Water Solutions, Inc. |
| Sector: Utilities | |
| SubSector: Utilities - Regulated Water | |
| MarketCap: 575 Millions | |
| Recent Price: 17.05 Smart Investing & Trading Score: 100 | |
| Day Percent Change: 9.29% Day Change: 1.45 | |
| Week Change: 16.46% Year-to-date Change: 103.2% | |
| ARIS Links: Profile News Message Board | |
| Charts:- Daily , Weekly | |
| Add ARIS to Watchlist: View: Get Complete ARIS Trend Analysis ➞ | |
 | YMAB Y-mAbs Therapeutics, Inc. |
| Sector: Health Care | |
| SubSector: Biotechnology | |
| MarketCap: 899.585 Millions | |
| Recent Price: 13.62 Smart Investing & Trading Score: 0 | |
| Day Percent Change: -20.91% Day Change: -3.60 | |
| Week Change: -20.58% Year-to-date Change: 99.7% | |
| YMAB Links: Profile News Message Board | |
| Charts:- Daily , Weekly | |
| Add YMAB to Watchlist: View: Get Complete YMAB Trend Analysis ➞ | |
 | EVER EverQuote, Inc. |
| Sector: Financials | |
| SubSector: Regional - Southeast Banks | |
| MarketCap: 767.135 Millions | |
| Recent Price: 23.82 Smart Investing & Trading Score: 95 | |
| Day Percent Change: -5.81% Day Change: -1.47 | |
| Week Change: 9.52% Year-to-date Change: 94.6% | |
| EVER Links: Profile News Message Board | |
| Charts:- Daily , Weekly | |
| Add EVER to Watchlist: View: Get Complete EVER Trend Analysis ➞ | |
 | FTAI Fortress Transportation and Infrastructure Investors LLC |
| Sector: Transports | |
| SubSector: Rental & Leasing Services | |
| MarketCap: 758.344 Millions | |
| Recent Price: 78.50 Smart Investing & Trading Score: 81 | |
| Day Percent Change: 1.29% Day Change: 1.00 | |
| Week Change: 0.23% Year-to-date Change: 69.2% | |
| FTAI Links: Profile News Message Board | |
| Charts:- Daily , Weekly | |
| Add FTAI to Watchlist: View: Get Complete FTAI Trend Analysis ➞ | |
 | MLYS Mineralys Therapeutics, Inc. |
| Sector: Health Care | |
| SubSector: Biotechnology | |
| MarketCap: 719 Millions | |
| Recent Price: 14.65 Smart Investing & Trading Score: 74 | |
| Day Percent Change: 3.39% Day Change: 0.48 | |
| Week Change: 11.36% Year-to-date Change: 68.0% | |
| MLYS Links: Profile News Message Board | |
| Charts:- Daily , Weekly | |
| Add MLYS to Watchlist: View: Get Complete MLYS Trend Analysis ➞ | |
 | PRM Perimeter Solutions, SA |
| Sector: Materials | |
| SubSector: Specialty Chemicals | |
| MarketCap: 930 Millions | |
| Recent Price: 7.67 Smart Investing & Trading Score: 88 | |
| Day Percent Change: 1.86% Day Change: 0.14 | |
| Week Change: 6.45% Year-to-date Change: 66.9% | |
| PRM Links: Profile News Message Board | |
| Charts:- Daily , Weekly | |
| Add PRM to Watchlist: View: Get Complete PRM Trend Analysis ➞ | |
 | MTTR Matterport, Inc. |
| Sector: Technology | |
| SubSector: Software - Application | |
| MarketCap: 920 Millions | |
| Recent Price: 4.43 Smart Investing & Trading Score: 61 | |
| Day Percent Change: -1.34% Day Change: -0.06 | |
| Week Change: -2.21% Year-to-date Change: 64.1% | |
| MTTR Links: Profile News Message Board | |
| Charts:- Daily , Weekly | |
| Add MTTR to Watchlist: View: Get Complete MTTR Trend Analysis ➞ | |
 | SPRY ARS Pharmaceuticals, Inc. |
| Sector: Health Care | |
| SubSector: Biotechnology | |
| MarketCap: 632 Millions | |
| Recent Price: 9.06 Smart Investing & Trading Score: 51 | |
| Day Percent Change: -4.33% Day Change: -0.41 | |
| Week Change: -4.13% Year-to-date Change: 59.4% | |
| SPRY Links: Profile News Message Board | |
| Charts:- Daily , Weekly | |
| Add SPRY to Watchlist: View: Get Complete SPRY Trend Analysis ➞ | |
 | CDLX Cardlytics, Inc. |
| Sector: Technology | |
| SubSector: Internet Information Providers | |
| MarketCap: 855.48 Millions | |
| Recent Price: 14.59 Smart Investing & Trading Score: 58 | |
| Day Percent Change: -5.44% Day Change: -0.84 | |
| Week Change: -1.95% Year-to-date Change: 58.4% | |
| CDLX Links: Profile News Message Board | |
| Charts:- Daily , Weekly | |
| Add CDLX to Watchlist: View: Get Complete CDLX Trend Analysis ➞ | |
 | SILK Silk Road Medical, Inc |
| Sector: Health Care | |
| SubSector: Medical Appliances & Equipment | |
| MarketCap: 881.78 Millions | |
| Recent Price: 19.22 Smart Investing & Trading Score: 58 | |
| Day Percent Change: -6.47% Day Change: -1.33 | |
| Week Change: -5.23% Year-to-date Change: 56.6% | |
| SILK Links: Profile News Message Board | |
| Charts:- Daily , Weekly | |
| Add SILK to Watchlist: View: Get Complete SILK Trend Analysis ➞ | |
 | CDE Coeur Mining, Inc. |
| Sector: Materials | |
| SubSector: Gold | |
| MarketCap: 853.219 Millions | |
| Recent Price: 5.10 Smart Investing & Trading Score: 88 | |
| Day Percent Change: -0.39% Day Change: -0.02 | |
| Week Change: 4.51% Year-to-date Change: 56.4% | |
| CDE Links: Profile News Message Board | |
| Charts:- Daily , Weekly | |
| Add CDE to Watchlist: View: Get Complete CDE Trend Analysis ➞ | |
 | RXST RxSight, Inc. |
| Sector: Health Care | |
| SubSector: Medical Devices | |
| MarketCap: 893 Millions | |
| Recent Price: 60.66 Smart Investing & Trading Score: 76 | |
| Day Percent Change: -2.46% Day Change: -1.53 | |
| Week Change: 0.15% Year-to-date Change: 51.2% | |
| RXST Links: Profile News Message Board | |
| Charts:- Daily , Weekly | |
| Add RXST to Watchlist: View: Get Complete RXST Trend Analysis ➞ | |
 | PAHC Phibro Animal Health Corporation |
| Sector: Health Care | |
| SubSector: Specialized Health Services | |
| MarketCap: 852.956 Millions | |
| Recent Price: 17.18 Smart Investing & Trading Score: 90 | |
| Day Percent Change: 2.44% Day Change: 0.41 | |
| Week Change: 0.64% Year-to-date Change: 48.4% | |
| PAHC Links: Profile News Message Board | |
| Charts:- Daily , Weekly | |
| Add PAHC to Watchlist: View: Get Complete PAHC Trend Analysis ➞ | |
 | CRS Carpenter Technology Corporation |
| Sector: Industrials | |
| SubSector: Metal Fabrication | |
| MarketCap: 853.35 Millions | |
| Recent Price: 103.55 Smart Investing & Trading Score: 83 | |
| Day Percent Change: 0.98% Day Change: 1.01 | |
| Week Change: -0.09% Year-to-date Change: 46.3% | |
| CRS Links: Profile News Message Board | |
| Charts:- Daily , Weekly | |
| Add CRS to Watchlist: View: Get Complete CRS Trend Analysis ➞ | |
 | ANF Abercrombie & Fitch Co. |
| Sector: Services & Goods | |
| SubSector: Apparel Stores | |
| MarketCap: 589.108 Millions | |
| Recent Price: 128.60 Smart Investing & Trading Score: 53 | |
| Day Percent Change: 0.14% Day Change: 0.18 | |
| Week Change: -0.12% Year-to-date Change: 45.8% | |
| ANF Links: Profile News Message Board | |
| Charts:- Daily , Weekly | |
| Add ANF to Watchlist: View: Get Complete ANF Trend Analysis ➞ | |
 | BV BrightView Holdings, Inc. |
| Sector: Industrials | |
| SubSector: General Contractors | |
| MarketCap: 973.763 Millions | |
| Recent Price: 12.26 Smart Investing & Trading Score: 58 | |
| Day Percent Change: -2.08% Day Change: -0.26 | |
| Week Change: -3.16% Year-to-date Change: 45.6% | |
| BV Links: Profile News Message Board | |
| Charts:- Daily , Weekly | |
| Add BV to Watchlist: View: Get Complete BV Trend Analysis ➞ | |
 | BHE Benchmark Electronics, Inc. |
| Sector: Technology | |
| SubSector: Printed Circuit Boards | |
| MarketCap: 766.835 Millions | |
| Recent Price: 40.04 Smart Investing & Trading Score: 100 | |
| Day Percent Change: 2.30% Day Change: 0.90 | |
| Week Change: 9.91% Year-to-date Change: 44.9% | |
| BHE Links: Profile News Message Board | |
| Charts:- Daily , Weekly | |
| Add BHE to Watchlist: View: Get Complete BHE Trend Analysis ➞ | |
 | PRIM Primoris Services Corporation |
| Sector: Industrials | |
| SubSector: Heavy Construction | |
| MarketCap: 931.895 Millions | |
| Recent Price: 47.80 Smart Investing & Trading Score: 73 | |
| Day Percent Change: 0.27% Day Change: 0.13 | |
| Week Change: 1.06% Year-to-date Change: 43.9% | |
| PRIM Links: Profile News Message Board | |
| Charts:- Daily , Weekly | |
| Add PRIM to Watchlist: View: Get Complete PRIM Trend Analysis ➞ | |
 | ORGN Origin Materials, Inc. |
| Sector: Materials | |
| SubSector: Chemicals | |
| MarketCap: 586 Millions | |
| Recent Price: 1.21 Smart Investing & Trading Score: 100 | |
| Day Percent Change: 10.00% Day Change: 0.11 | |
| Week Change: 3.42% Year-to-date Change: 43.6% | |
| ORGN Links: Profile News Message Board | |
| Charts:- Daily , Weekly | |
| Add ORGN to Watchlist: View: Get Complete ORGN Trend Analysis ➞ | |
 | AGX Argan, Inc. |
| Sector: Industrials | |
| SubSector: Heavy Construction | |
| MarketCap: 664.095 Millions | |
| Recent Price: 66.37 Smart Investing & Trading Score: 100 | |
| Day Percent Change: 2.09% Day Change: 1.36 | |
| Week Change: 9.09% Year-to-date Change: 41.9% | |
| AGX Links: Profile News Message Board | |
| Charts:- Daily , Weekly | |
| Add AGX to Watchlist: View: Get Complete AGX Trend Analysis ➞ | |
 | CMPO CompoSecure, Inc. |
| Sector: Industrials | |
| SubSector: Metal Fabrication | |
| MarketCap: 535 Millions | |
| Recent Price: 7.50 Smart Investing & Trading Score: 88 | |
| Day Percent Change: -0.40% Day Change: -0.03 | |
| Week Change: 3.66% Year-to-date Change: 37.1% | |
| CMPO Links: Profile News Message Board | |
| Charts:- Daily , Weekly | |
| Add CMPO to Watchlist: View: Get Complete CMPO Trend Analysis ➞ | |
 | ARDX Ardelyx, Inc. |
| Sector: Health Care | |
| SubSector: Biotechnology | |
| MarketCap: 541.985 Millions | |
| Recent Price: 8.48 Smart Investing & Trading Score: 37 | |
| Day Percent Change: -8.92% Day Change: -0.83 | |
| Week Change: -2.75% Year-to-date Change: 36.8% | |
| ARDX Links: Profile News Message Board | |
| Charts:- Daily , Weekly | |
| Add ARDX to Watchlist: View: Get Complete ARDX Trend Analysis ➞ | |
 | PRDO Perdoceo Education Corporation |
| Sector: Services & Goods | |
| SubSector: Education & Training Services | |
| MarketCap: 631.006 Millions | |
| Recent Price: 23.88 Smart Investing & Trading Score: 68 | |
| Day Percent Change: -0.23% Day Change: -0.05 | |
| Week Change: -1.89% Year-to-date Change: 36.0% | |
| PRDO Links: Profile News Message Board | |
| Charts:- Daily , Weekly | |
| Add PRDO to Watchlist: View: Get Complete PRDO Trend Analysis ➞ | |
| For tabular summary view of above stock list: Summary View ➞ 0 - 25 , 25 - 50 , 50 - 75 , 75 - 100 , 100 - 125 , 125 - 150 , 150 - 175 , 175 - 200 , 200 - 225 , 225 - 250 , 250 - 275 , 275 - 300 , 300 - 325 , 325 - 350 | ||
| Click To Change The Sort Order: By Market Cap or Company Size Performance: Year-to-date, Week and Day | |
| Select Chart Type: | ||
| Too many stocks? View smallcap stocks filtered by marketcap & sector |
| Marketcap: All SmallCap Stocks (default-no microcap), Large, Mid-Range, Small & MicroCap |
| Sector: Tech, Finance, Energy, Staples, Retail, Industrial, Materials, Utilities & Medical |
|
Best Stocks Today 12Stocks.com |
© 2024 12Stocks.com Terms & Conditions Privacy Contact Us
All Information Provided Only For Education And Not To Be Used For Investing or Trading. See Terms & Conditions


One More Thing ... Get Best Stocks Delivered Daily!
Never Ever Miss A Move With Our Top Ten Stocks Lists
Find Best Stocks In Any Market - Bull or Bear Market
Take A Peek At Our Top Ten Stocks Lists: Daily, Weekly, Year-to-Date & Top Trends
Find Best Stocks In Any Market - Bull or Bear Market
Take A Peek At Our Top Ten Stocks Lists: Daily, Weekly, Year-to-Date & Top Trends
Smallcap Stocks With Best Up Trends [0-bearish to 100-bullish]: Innodata [100], Cricut [100], DASAN Zhone[100], Latham Group[100], Hyster-Yale Materials[100], Ameresco [100], Myriad Genetics[100], Alpha and[100], Vigil Neuroscience[100], Hannon Armstrong[100], Ardmore Shipping[100]
Best Smallcap Stocks Year-to-Date:
CareMax [584.54%], Janux [415.31%], Viking [329.39%], Bakkt [294.17%], Longboard [255.16%], Alpine Immune[239.81%], Vera [190.31%], Super Micro[189.4%], Avidity Biosciences[188.27%], Cullinan Oncology[171.9%], Arcutis Bio[147.06%] Best Smallcap Stocks This Week:
DASAN Zhone[64.32%], Innodata [55.8%], Perficient [52.88%], Cricut [42.06%], Vigil Neuroscience[38.97%], Thoughtworks Holding[36.44%], Latham Group[35.53%], Great Lakes[32.04%], Outset Medical[31.95%], Bakkt [31.59%], P3 Health[27.95%] Best Smallcap Stocks Daily:
Innodata [55.34%], Cricut [47.20%], DASAN Zhone[30.11%], Latham Group[23.75%], Hyster-Yale Materials[23.55%], Ameresco [21.13%], Myriad Genetics[21.08%], iRobot [21.06%], Alpha and[20.87%], Bakkt [20.58%], Vigil Neuroscience[18.50%]