
 Login Sign Up


| |||||
 |  | ||||

| 12Stocks.com Market Intelligence |
Best SmallCap Stocks
|
| In a hurry? Small Cap Stock Lists: Performance Trends Table, Stock Charts
Sort Small Cap stocks: Daily, Weekly, Year-to-Date, Market Cap & Trends. Filter Small Cap stocks list by sector: Show all, Tech, Finance, Energy, Staples, Retail, Industrial, Materials, Utilities and HealthCare Filter Small Cap stocks list by size: All Large Medium Small and MicroCap |
| 12Stocks.com Small Cap Stocks Performances & Trends Daily | |||||||||
|
|  The overall Smart Investing & Trading Score is 69 (0-bearish to 100-bullish) which puts Small Cap index in short term neutral to bullish trend. The Smart Investing & Trading Score from previous trading session is 49 and hence an improvement of trend.
| ||||||||
Here are the Smart Investing & Trading Scores of the most requested small cap stocks at 12Stocks.com (click stock name for detailed review):
|


| 12Stocks.com: Investing in Smallcap Index with Stocks | |
|
The following table helps investors and traders sort through current performance and trends (as measured by Smart Investing & Trading Score) of various
stocks in the Smallcap Index. Quick View: Move mouse or cursor over stock symbol (ticker) to view short-term technical chart and over stock name to view long term chart. Click on  to add stock symbol to your watchlist and to add stock symbol to your watchlist and  to view watchlist. Click on any ticker or stock name for detailed market intelligence report for that stock. to view watchlist. Click on any ticker or stock name for detailed market intelligence report for that stock. |
12Stocks.com Performance of Stocks in Smallcap Index
| Ticker | Stock Name | Watchlist | Category | Recent Price | Smart Investing & Trading Score | Change % | YTD Change% |
| PDFS | PDF Solutions |   | Technology | 31.66 | 59 | 1.70 | -1.49% |
| KLTR | Kaltura | | Technology | 1.22 | 17 | 1.67 | -37.76% |
| SHEN | Shenandoah Tele | | Technology | 13.47 | 42 | 1.66 | -37.70% |
| SPNS | Sapiens | | Technology | 30.86 | 45 | 1.58 | 6.63% |
| JAMF | Jamf Holding | | Technology | 20.22 | 100 | 1.56 | 11.90% |
| VRNT | Verint Systems | | Technology | 31.25 | 69 | 1.53 | 15.61% |
| IBEX | IBEX | | Technology | 13.59 | 52 | 1.49 | -28.40% |
| PUBM | PubMatic | | Technology | 23.43 | 83 | 1.45 | 43.71% |
| CXM | Sprinklr | | Technology | 11.97 | 64 | 1.36 | -0.99% |
| AMPL | Amplitude | | Technology | 9.86 | 42 | 1.34 | -22.73% |
| ITI | Iteris | | Technology | 4.60 | 49 | 1.32 | -11.54% |
| QTWO | Q2 | | Technology | 60.36 | 100 | 1.31 | 39.05% |
| IDT | IDT | | Technology | 38.13 | 100 | 1.30 | 11.85% |
| APPF | AppFolio | | Technology | 239.11 | 64 | 1.30 | 38.02% |
| SQSP | Squarespace | | Technology | 35.24 | 58 | 1.29 | 6.18% |
| PLUS | ePlus | | Technology | 77.92 | 57 | 1.25 | -2.40% |
| NABL | N-able | | Technology | 12.54 | 49 | 1.21 | -5.75% |
| DMRC | Digimarc | | Technology | 22.88 | 42 | 1.19 | -36.66% |
| GRND | Grindr | | Technology | 10.35 | 90 | 1.17 | 15.51% |
| RDVT | Red Violet | | Technology | 17.63 | 42 | 1.15 | -11.72% |
| RPD | Rapid7 | | Technology | 45.21 | 35 | 1.14 | -20.82% |
| XPER | Xperi | | Technology | 10.77 | 69 | 1.13 | -2.27% |
| SLAB | Silicon | | Technology | 122.37 | 25 | 1.12 | -7.48% |
| ATOM | Atomera | | Technology | 4.50 | 17 | 1.12 | -35.81% |
| SWI | SolarWinds | | Technology | 11.70 | 64 | 1.04 | -6.33% |
| For chart view version of above stock list: Chart View ➞ 0 - 25 , 25 - 50 , 50 - 75 , 75 - 100 , 100 - 125 , 125 - 150 , 150 - 175 , 175 - 200 , 200 - 225 , 225 - 250 , 250 - 275 | ||
 | Click To Change The Sort Order: By Market Cap or Company Size Performance: Year-to-date, Week and Day |  |
| Too many stocks? View smallcap stocks filtered by marketcap & sector |
| Marketcap: All SmallCap Stocks (default-no microcap), Large, Mid-Range, Small |
| Smallcap Sector: Tech, Finance, Energy, Staples, Retail, Industrial, Materials, & Medical |
|
Get the most comprehensive stock market coverage daily at 12Stocks.com ➞ Best Stocks Today ➞ Best Stocks Weekly ➞ Best Stocks Year-to-Date ➞ Best Stocks Trends ➞  Best Stocks Today 12Stocks.com Best Nasdaq Stocks ➞ Best S&P 500 Stocks ➞ Best Tech Stocks ➞ Best Biotech Stocks ➞ |
| Detailed Overview of SmallCap Stocks |
| SmallCap Technical Overview, Leaders & Laggards, Top SmallCap ETF Funds & Detailed SmallCap Stocks List, Charts, Trends & More |
| Smallcap: Technical Analysis, Trends & YTD Performance | |
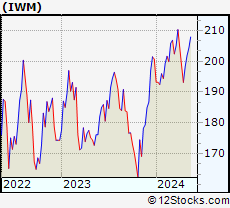
| SmallCap segment as represented by
IWM, an exchange-traded fund [ETF], holds basket of thousands of smallcap stocks from across all major sectors of the US stock market. The smallcap index (contains stocks like Riverbed & Sotheby's) is up by 0.59% and is currently underperforming the overall market by -6.29% year-to-date. Below is a quick view of technical charts and trends: | |
 IWM Weekly Chart |
|
| Long Term Trend: Not Good | |
| Medium Term Trend: Very Good | |
 IWM Daily Chart |
|
| Short Term Trend: Very Good | |
| Overall Trend Score: 69 | |
| YTD Performance: 0.59% | |
| **Trend Scores & Views Are Only For Educational Purposes And Not For Investing | |
| 12Stocks.com: Top Performing Small Cap Index Stocks | ||||||||||||||||||||||||||||||||||||||||||||||||
 The top performing Small Cap Index stocks year to date are
Now, more recently, over last week, the top performing Small Cap Index stocks on the move are


|
||||||||||||||||||||||||||||||||||||||||||||||||
| 12Stocks.com: Investing in Smallcap Index using Exchange Traded Funds | |
|
The following table shows list of key exchange traded funds (ETF) that
help investors track Smallcap index. The following list also includes leveraged ETF funds that track twice or thrice the daily returns of Smallcap indices. Short or inverse ETF funds move in the opposite direction to the index they track and are useful during market pullbacks or during bear markets. Quick View: Move mouse or cursor over ETF symbol (ticker) to view short-term technical chart and over ETF name to view long term chart. Click on ticker or stock name for detailed view. Click on to add stock symbol to your watchlist and to view watchlist. |
12Stocks.com List of ETFs that track Smallcap Index
| Ticker | ETF Name | Watchlist | Recent Price | Smart Investing & Trading Score | Change % | Week % | Year-to-date % |
| IWM | iShares Russell 2000 | | 201.90 | 69 | 0.99 | 1.77 | 0.59% |
| IJR | iShares Core S&P Small-Cap | | 107.13 | 82 | 0.75 | 1.4 | -1.03% |
| VTWO | Vanguard Russell 2000 ETF | | 81.61 | 69 | 0.94 | 1.73 | 0.63% |
| IWN | iShares Russell 2000 Value | | 154.21 | 100 | 0.87 | 2.03 | -0.72% |
| IJS | iShares S&P Small-Cap 600 Value | | 98.72 | 64 | 0.71 | 1.57 | -4.22% |
| IWO | iShares Russell 2000 Growth | | 256.87 | 57 | 0.99 | 1.49 | 1.84% |
| IJT | iShares S&P Small-Cap 600 Growth | | 127.76 | 95 | 0.82 | 1.32 | 2.09% |
| XSLV | PowerShares S&P SmallCap Low Volatil ETF | | 43.22 | 87 | 0.19 | 1.17 | -2.11% |
| SBB | ProShares Short SmallCap600 | | 16.16 | 13 | -1.28 | -1.37 | 1.44% |
| SDD | ProShares UltraShort SmallCap600 | | 18.84 | 23 | -2.41 | -2.61 | 2.27% |
| SAA | ProShares Ultra SmallCap600 | | 23.59 | 69 | 2.86 | 2.39 | -5.45% |
| SMLV | SPDR SSGA US Small Cap Low Volatil ETF | | 109.69 | 87 | 0.78 | 2.01 | -2.52% |
| 12Stocks.com: Charts, Trends, Fundamental Data and Performances of SmallCap Stocks | |
|
We now take in-depth look at all SmallCap stocks including charts, multi-period performances and overall trends (as measured by Smart Investing & Trading Score). One can sort SmallCap stocks (click link to choose) by Daily, Weekly and by Year-to-Date performances. Also, one can sort by size of the company or by market capitalization. |
| Select Your Default Chart Type: | |||||
| |||||
| Click on stock symbol or name for detailed view. Click on to add stock symbol to your watchlist and to view watchlist. Quick View: Move mouse or cursor over "Daily" to quickly view daily technical stock chart and over "Weekly" to view weekly technical stock chart. | |||||

 | PDFS PDF Solutions, Inc. |
| Sector: Technology | |
| SubSector: Technical & System Software | |
| MarketCap: 345.1 Millions | |
| Recent Price: 31.66 Smart Investing & Trading Score: 59 | |
| Day Percent Change: 1.70% Day Change: 0.53 | |
| Week Change: 2% Year-to-date Change: -1.5% | |
| PDFS Links: Profile News Message Board | |
| Charts:- Daily , Weekly | |
| Add PDFS to Watchlist: View: Get Complete PDFS Trend Analysis ➞ | |
 | KLTR Kaltura, Inc. |
| Sector: Technology | |
| SubSector: Software - Application | |
| MarketCap: 293 Millions | |
| Recent Price: 1.22 Smart Investing & Trading Score: 17 | |
| Day Percent Change: 1.67% Day Change: 0.02 | |
| Week Change: -2.4% Year-to-date Change: -37.8% | |
| KLTR Links: Profile News Message Board | |
| Charts:- Daily , Weekly | |
| Add KLTR to Watchlist: View: Get Complete KLTR Trend Analysis ➞ | |
 | SHEN Shenandoah Telecommunications Company |
| Sector: Technology | |
| SubSector: Telecom Services - Domestic | |
| MarketCap: 2329.67 Millions | |
| Recent Price: 13.47 Smart Investing & Trading Score: 42 | |
| Day Percent Change: 1.66% Day Change: 0.22 | |
| Week Change: 0.6% Year-to-date Change: -37.7% | |
| SHEN Links: Profile News Message Board | |
| Charts:- Daily , Weekly | |
| Add SHEN to Watchlist: View: Get Complete SHEN Trend Analysis ➞ | |
 | SPNS Sapiens International Corporation N.V. |
| Sector: Technology | |
| SubSector: Business Software & Services | |
| MarketCap: 841.858 Millions | |
| Recent Price: 30.86 Smart Investing & Trading Score: 45 | |
| Day Percent Change: 1.58% Day Change: 0.48 | |
| Week Change: -1.41% Year-to-date Change: 6.6% | |
| SPNS Links: Profile News Message Board | |
| Charts:- Daily , Weekly | |
| Add SPNS to Watchlist: View: Get Complete SPNS Trend Analysis ➞ | |
 | JAMF Jamf Holding Corp. |
| Sector: Technology | |
| SubSector: Software Application | |
| MarketCap: 36987 Millions | |
| Recent Price: 20.22 Smart Investing & Trading Score: 100 | |
| Day Percent Change: 1.56% Day Change: 0.31 | |
| Week Change: 3.43% Year-to-date Change: 11.9% | |
| JAMF Links: Profile News Message Board | |
| Charts:- Daily , Weekly | |
| Add JAMF to Watchlist: View: Get Complete JAMF Trend Analysis ➞ | |
 | VRNT Verint Systems Inc. |
| Sector: Technology | |
| SubSector: Business Software & Services | |
| MarketCap: 2902.18 Millions | |
| Recent Price: 31.25 Smart Investing & Trading Score: 69 | |
| Day Percent Change: 1.53% Day Change: 0.47 | |
| Week Change: 1.03% Year-to-date Change: 15.6% | |
| VRNT Links: Profile News Message Board | |
| Charts:- Daily , Weekly | |
| Add VRNT to Watchlist: View: Get Complete VRNT Trend Analysis ➞ | |
 | IBEX IBEX Limited |
| Sector: Technology | |
| SubSector: Software Application | |
| MarketCap: 37787 Millions | |
| Recent Price: 13.59 Smart Investing & Trading Score: 52 | |
| Day Percent Change: 1.49% Day Change: 0.20 | |
| Week Change: 2.95% Year-to-date Change: -28.4% | |
| IBEX Links: Profile News Message Board | |
| Charts:- Daily , Weekly | |
| Add IBEX to Watchlist: View: Get Complete IBEX Trend Analysis ➞ | |
 | PUBM PubMatic, Inc. |
| Sector: Technology | |
| SubSector: Software Application | |
| MarketCap: 56787 Millions | |
| Recent Price: 23.43 Smart Investing & Trading Score: 83 | |
| Day Percent Change: 1.45% Day Change: 0.34 | |
| Week Change: 0.93% Year-to-date Change: 43.7% | |
| PUBM Links: Profile News Message Board | |
| Charts:- Daily , Weekly | |
| Add PUBM to Watchlist: View: Get Complete PUBM Trend Analysis ➞ | |
 | CXM Sprinklr, Inc. |
| Sector: Technology | |
| SubSector: Software - Application | |
| MarketCap: 3700 Millions | |
| Recent Price: 11.97 Smart Investing & Trading Score: 64 | |
| Day Percent Change: 1.36% Day Change: 0.16 | |
| Week Change: 0.29% Year-to-date Change: -1.0% | |
| CXM Links: Profile News Message Board | |
| Charts:- Daily , Weekly | |
| Add CXM to Watchlist: View: Get Complete CXM Trend Analysis ➞ | |
 | AMPL Amplitude, Inc. |
| Sector: Technology | |
| SubSector: Software - Application | |
| MarketCap: 1320 Millions | |
| Recent Price: 9.86 Smart Investing & Trading Score: 42 | |
| Day Percent Change: 1.34% Day Change: 0.13 | |
| Week Change: -0.6% Year-to-date Change: -22.7% | |
| AMPL Links: Profile News Message Board | |
| Charts:- Daily , Weekly | |
| Add AMPL to Watchlist: View: Get Complete AMPL Trend Analysis ➞ | |
 | ITI Iteris, Inc. |
| Sector: Technology | |
| SubSector: Communication Equipment | |
| MarketCap: 129.939 Millions | |
| Recent Price: 4.60 Smart Investing & Trading Score: 49 | |
| Day Percent Change: 1.32% Day Change: 0.06 | |
| Week Change: 2.68% Year-to-date Change: -11.5% | |
| ITI Links: Profile News Message Board | |
| Charts:- Daily , Weekly | |
| Add ITI to Watchlist: View: Get Complete ITI Trend Analysis ➞ | |
 | QTWO Q2 Holdings, Inc. |
| Sector: Technology | |
| SubSector: Business Software & Services | |
| MarketCap: 2815.88 Millions | |
| Recent Price: 60.36 Smart Investing & Trading Score: 100 | |
| Day Percent Change: 1.31% Day Change: 0.78 | |
| Week Change: 13.29% Year-to-date Change: 39.1% | |
| QTWO Links: Profile News Message Board | |
| Charts:- Daily , Weekly | |
| Add QTWO to Watchlist: View: Get Complete QTWO Trend Analysis ➞ | |
 | IDT IDT Corporation |
| Sector: Technology | |
| SubSector: Diversified Communication Services | |
| MarketCap: 130.064 Millions | |
| Recent Price: 38.13 Smart Investing & Trading Score: 100 | |
| Day Percent Change: 1.30% Day Change: 0.49 | |
| Week Change: 5.48% Year-to-date Change: 11.9% | |
| IDT Links: Profile News Message Board | |
| Charts:- Daily , Weekly | |
| Add IDT to Watchlist: View: Get Complete IDT Trend Analysis ➞ | |
 | APPF AppFolio, Inc. |
| Sector: Technology | |
| SubSector: Application Software | |
| MarketCap: 3412.02 Millions | |
| Recent Price: 239.11 Smart Investing & Trading Score: 64 | |
| Day Percent Change: 1.30% Day Change: 3.06 | |
| Week Change: -1.5% Year-to-date Change: 38.0% | |
| APPF Links: Profile News Message Board | |
| Charts:- Daily , Weekly | |
| Add APPF to Watchlist: View: Get Complete APPF Trend Analysis ➞ | |
 | SQSP Squarespace, Inc. |
| Sector: Technology | |
| SubSector: Software - Infrastructure | |
| MarketCap: 4150 Millions | |
| Recent Price: 35.24 Smart Investing & Trading Score: 58 | |
| Day Percent Change: 1.29% Day Change: 0.45 | |
| Week Change: -0.82% Year-to-date Change: 6.2% | |
| SQSP Links: Profile News Message Board | |
| Charts:- Daily , Weekly | |
| Add SQSP to Watchlist: View: Get Complete SQSP Trend Analysis ➞ | |
 | PLUS ePlus inc. |
| Sector: Technology | |
| SubSector: Application Software | |
| MarketCap: 728.262 Millions | |
| Recent Price: 77.92 Smart Investing & Trading Score: 57 | |
| Day Percent Change: 1.25% Day Change: 0.96 | |
| Week Change: -0.35% Year-to-date Change: -2.4% | |
| PLUS Links: Profile News Message Board | |
| Charts:- Daily , Weekly | |
| Add PLUS to Watchlist: View: Get Complete PLUS Trend Analysis ➞ | |
 | NABL N-able, Inc. |
| Sector: Technology | |
| SubSector: Information Technology Services | |
| MarketCap: 2590 Millions | |
| Recent Price: 12.54 Smart Investing & Trading Score: 49 | |
| Day Percent Change: 1.21% Day Change: 0.15 | |
| Week Change: 1.13% Year-to-date Change: -5.8% | |
| NABL Links: Profile News Message Board | |
| Charts:- Daily , Weekly | |
| Add NABL to Watchlist: View: Get Complete NABL Trend Analysis ➞ | |
 | DMRC Digimarc Corporation |
| Sector: Technology | |
| SubSector: Information Technology Services | |
| MarketCap: 222.268 Millions | |
| Recent Price: 22.88 Smart Investing & Trading Score: 42 | |
| Day Percent Change: 1.19% Day Change: 0.27 | |
| Week Change: 2.23% Year-to-date Change: -36.7% | |
| DMRC Links: Profile News Message Board | |
| Charts:- Daily , Weekly | |
| Add DMRC to Watchlist: View: Get Complete DMRC Trend Analysis ➞ | |
 | GRND Grindr Inc. |
| Sector: Technology | |
| SubSector: Software - Application | |
| MarketCap: 929 Millions | |
| Recent Price: 10.35 Smart Investing & Trading Score: 90 | |
| Day Percent Change: 1.17% Day Change: 0.12 | |
| Week Change: 4.65% Year-to-date Change: 15.5% | |
| GRND Links: Profile News Message Board | |
| Charts:- Daily , Weekly | |
| Add GRND to Watchlist: View: Get Complete GRND Trend Analysis ➞ | |
 | RDVT Red Violet, Inc. |
| Sector: Technology | |
| SubSector: Application Software | |
| MarketCap: 215.162 Millions | |
| Recent Price: 17.63 Smart Investing & Trading Score: 42 | |
| Day Percent Change: 1.15% Day Change: 0.20 | |
| Week Change: 3.77% Year-to-date Change: -11.7% | |
| RDVT Links: Profile News Message Board | |
| Charts:- Daily , Weekly | |
| Add RDVT to Watchlist: View: Get Complete RDVT Trend Analysis ➞ | |
 | RPD Rapid7, Inc. |
| Sector: Technology | |
| SubSector: Application Software | |
| MarketCap: 1981.12 Millions | |
| Recent Price: 45.21 Smart Investing & Trading Score: 35 | |
| Day Percent Change: 1.14% Day Change: 0.51 | |
| Week Change: -1.57% Year-to-date Change: -20.8% | |
| RPD Links: Profile News Message Board | |
| Charts:- Daily , Weekly | |
| Add RPD to Watchlist: View: Get Complete RPD Trend Analysis ➞ | |
 | XPER Xperi Corporation |
| Sector: Technology | |
| SubSector: Semiconductor Equipment & Materials | |
| MarketCap: 631.618 Millions | |
| Recent Price: 10.77 Smart Investing & Trading Score: 69 | |
| Day Percent Change: 1.13% Day Change: 0.12 | |
| Week Change: 8.24% Year-to-date Change: -2.3% | |
| XPER Links: Profile News Message Board | |
| Charts:- Daily , Weekly | |
| Add XPER to Watchlist: View: Get Complete XPER Trend Analysis ➞ | |
 | SLAB Silicon Laboratories Inc. |
| Sector: Technology | |
| SubSector: Semiconductor - Integrated Circuits | |
| MarketCap: 3710.2 Millions | |
| Recent Price: 122.37 Smart Investing & Trading Score: 25 | |
| Day Percent Change: 1.12% Day Change: 1.35 | |
| Week Change: 0.2% Year-to-date Change: -7.5% | |
| SLAB Links: Profile News Message Board | |
| Charts:- Daily , Weekly | |
| Add SLAB to Watchlist: View: Get Complete SLAB Trend Analysis ➞ | |
 | ATOM Atomera Incorporated |
| Sector: Technology | |
| SubSector: Semiconductor Equipment & Materials | |
| MarketCap: 60.6918 Millions | |
| Recent Price: 4.50 Smart Investing & Trading Score: 17 | |
| Day Percent Change: 1.12% Day Change: 0.05 | |
| Week Change: 1.12% Year-to-date Change: -35.8% | |
| ATOM Links: Profile News Message Board | |
| Charts:- Daily , Weekly | |
| Add ATOM to Watchlist: View: Get Complete ATOM Trend Analysis ➞ | |
 | SWI SolarWinds Corporation |
| Sector: Technology | |
| SubSector: Application Software | |
| MarketCap: 4524.62 Millions | |
| Recent Price: 11.70 Smart Investing & Trading Score: 64 | |
| Day Percent Change: 1.04% Day Change: 0.12 | |
| Week Change: 5.22% Year-to-date Change: -6.3% | |
| SWI Links: Profile News Message Board | |
| Charts:- Daily , Weekly | |
| Add SWI to Watchlist: View: Get Complete SWI Trend Analysis ➞ | |
| For tabular summary view of above stock list: Summary View ➞ 0 - 25 , 25 - 50 , 50 - 75 , 75 - 100 , 100 - 125 , 125 - 150 , 150 - 175 , 175 - 200 , 200 - 225 , 225 - 250 , 250 - 275 | ||
| Click To Change The Sort Order: By Market Cap or Company Size Performance: Year-to-date, Week and Day | |
| Select Chart Type: | ||
| Too many stocks? View smallcap stocks filtered by marketcap & sector |
| Marketcap: All SmallCap Stocks (default-no microcap), Large, Mid-Range, Small & MicroCap |
| Sector: Tech, Finance, Energy, Staples, Retail, Industrial, Materials, Utilities & Medical |
|
Best Stocks Today 12Stocks.com |
© 2024 12Stocks.com Terms & Conditions Privacy Contact Us
All Information Provided Only For Education And Not To Be Used For Investing or Trading. See Terms & Conditions


One More Thing ... Get Best Stocks Delivered Daily!
Never Ever Miss A Move With Our Top Ten Stocks Lists
Find Best Stocks In Any Market - Bull or Bear Market
Take A Peek At Our Top Ten Stocks Lists: Daily, Weekly, Year-to-Date & Top Trends
Find Best Stocks In Any Market - Bull or Bear Market
Take A Peek At Our Top Ten Stocks Lists: Daily, Weekly, Year-to-Date & Top Trends
Smallcap Stocks With Best Up Trends [0-bearish to 100-bullish]: Twist Bioscience[100], WideOpenWest [100], Joint [100], FTC Solar[100], Origin Materials[100], Alignment Healthcare[100], Clarus [100], IES [100], Emergent BioSolutions[100], Enovix [100], El Pollo[100]
Best Smallcap Stocks Year-to-Date:
Janux [482.74%], Viking [313.59%], Longboard [272.5%], Alpine Immune[239.29%], Bakkt [199.55%], Avidity Biosciences[192.48%], Vera [189.47%], Cullinan Oncology[176.9%], Super Micro[175.35%], Y-mAbs [151.47%], Sana [149.33%] Best Smallcap Stocks This Week:
Emergent BioSolutions[102.6%], Deciphera [73.24%], Origin Materials[66.52%], Eyenovia [60.78%], Cue Biopharma[56.04%], Aspen Aerogels[55.96%], Enovix [54.02%], Luna Innovations[53.77%], Codexis [47.37%], Carvana Co[44.31%], Office Properties[42.79%] Best Smallcap Stocks Daily:
Luna Innovations[36.00%], Twist Bioscience[28.74%], Ardelyx [28.42%], WideOpenWest [28.23%], 2U [26.63%], Joint [25.35%], FTC Solar[25.09%], Origin Materials[22.23%], Alignment Healthcare[21.97%], Clarus [18.67%], Aurora Innovation[18.09%]