
 Login Sign Up


| |||||
 |  | ||||

| 12Stocks.com Market Intelligence |
Best SmallCap Stocks
|
| In a hurry? Small Cap Stock Lists: Performance Trends Table, Stock Charts
Sort Small Cap stocks: Daily, Weekly, Year-to-Date, Market Cap & Trends. Filter Small Cap stocks list by sector: Show all, Tech, Finance, Energy, Staples, Retail, Industrial, Materials, Utilities and HealthCare Filter Small Cap stocks list by size: All Large Medium Small and MicroCap |
| 12Stocks.com Small Cap Stocks Performances & Trends Daily | |||||||||
|
|  The overall Smart Investing & Trading Score is 69 (0-bearish to 100-bullish) which puts Small Cap index in short term neutral to bullish trend. The Smart Investing & Trading Score from previous trading session is 49 and hence an improvement of trend.
| ||||||||
Here are the Smart Investing & Trading Scores of the most requested small cap stocks at 12Stocks.com (click stock name for detailed review):
|


| 12Stocks.com: Investing in Smallcap Index with Stocks | |
|
The following table helps investors and traders sort through current performance and trends (as measured by Smart Investing & Trading Score) of various
stocks in the Smallcap Index. Quick View: Move mouse or cursor over stock symbol (ticker) to view short-term technical chart and over stock name to view long term chart. Click on  to add stock symbol to your watchlist and to add stock symbol to your watchlist and  to view watchlist. Click on any ticker or stock name for detailed market intelligence report for that stock. to view watchlist. Click on any ticker or stock name for detailed market intelligence report for that stock. |
12Stocks.com Performance of Stocks in Smallcap Index
| Ticker | Stock Name | Watchlist | Category | Recent Price | Smart Investing & Trading Score | Change % | YTD Change% |
| RBBN | Ribbon |   | Technology | 3.17 | 63 | -1.25 | 9.31% |
| HLIT | Harmonic | | Technology | 10.96 | 64 | -1.26 | -15.95% |
| NTGR | NETGEAR | | Technology | 11.63 | 0 | -1.27 | -20.23% |
| EXLS | ExlService | | Technology | 29.65 | 49 | -1.27 | -3.89% |
| TENB | Tenable | | Technology | 44.60 | 7 | -1.35 | -3.17% |
| ROG | Rogers | | Technology | 118.33 | 76 | -1.39 | -10.40% |
| HQY | HealthEquity | | Technology | 78.55 | 8 | -1.50 | 18.48% |
| PRFT | Perficient | | Technology | 48.11 | 49 | -1.51 | -26.91% |
| BMBL | Bumble | | Technology | 10.04 | 23 | -1.57 | -32.44% |
| PRO | PROS | | Technology | 32.89 | 25 | -1.76 | -15.21% |
| ONTF | ON24 | | Technology | 6.71 | 42 | -1.76 | -14.90% |
| PWSC | PowerSchool | | Technology | 16.61 | 10 | -1.80 | -29.76% |
| EXTR | Extreme s | | Technology | 11.20 | 42 | -1.93 | -36.51% |
| DOCN | DigitalOcean | | Technology | 34.09 | 32 | -1.98 | -7.82% |
| BAND | Bandwidth | | Technology | 19.26 | 64 | -2.13 | 33.10% |
| RMNI | Rimini Street | | Technology | 2.55 | 0 | -2.30 | -22.02% |
| TCX | Tucows | | Technology | 18.33 | 69 | -2.34 | -32.11% |
| COHU | Cohu | | Technology | 29.60 | 0 | -2.44 | -16.36% |
| SKYT | SkyWater | | Technology | 10.20 | 40 | -2.49 | 5.81% |
| TTGT | TechTarget | | Technology | 28.00 | 62 | -2.68 | -19.68% |
| TWKS | Thoughtworks Holding | | Technology | 2.25 | 20 | -3.02 | -53.70% |
| FLYW | Flywire | | Technology | 19.57 | 0 | -3.02 | -16.47% |
| UIS | Unisys | | Technology | 5.08 | 0 | -3.05 | -9.61% |
| RELY | Remitly Global | | Technology | 14.91 | 71 | -3.18 | -23.22% |
| FSLY | Fastly | | Technology | 8.48 | 7 | -3.53 | -52.36% |
| For chart view version of above stock list: Chart View ➞ 0 - 25 , 25 - 50 , 50 - 75 , 75 - 100 , 100 - 125 , 125 - 150 , 150 - 175 , 175 - 200 , 200 - 225 , 225 - 250 , 250 - 275 | ||
 | Click To Change The Sort Order: By Market Cap or Company Size Performance: Year-to-date, Week and Day |  |
| Too many stocks? View smallcap stocks filtered by marketcap & sector |
| Marketcap: All SmallCap Stocks (default-no microcap), Large, Mid-Range, Small |
| Smallcap Sector: Tech, Finance, Energy, Staples, Retail, Industrial, Materials, & Medical |
|
Get the most comprehensive stock market coverage daily at 12Stocks.com ➞ Best Stocks Today ➞ Best Stocks Weekly ➞ Best Stocks Year-to-Date ➞ Best Stocks Trends ➞  Best Stocks Today 12Stocks.com Best Nasdaq Stocks ➞ Best S&P 500 Stocks ➞ Best Tech Stocks ➞ Best Biotech Stocks ➞ |
| Detailed Overview of SmallCap Stocks |
| SmallCap Technical Overview, Leaders & Laggards, Top SmallCap ETF Funds & Detailed SmallCap Stocks List, Charts, Trends & More |
| Smallcap: Technical Analysis, Trends & YTD Performance | |
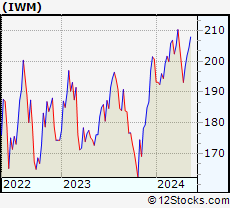
| SmallCap segment as represented by
IWM, an exchange-traded fund [ETF], holds basket of thousands of smallcap stocks from across all major sectors of the US stock market. The smallcap index (contains stocks like Riverbed & Sotheby's) is up by 0.59% and is currently underperforming the overall market by -6.29% year-to-date. Below is a quick view of technical charts and trends: | |
 IWM Weekly Chart |
|
| Long Term Trend: Not Good | |
| Medium Term Trend: Very Good | |
 IWM Daily Chart |
|
| Short Term Trend: Very Good | |
| Overall Trend Score: 69 | |
| YTD Performance: 0.59% | |
| **Trend Scores & Views Are Only For Educational Purposes And Not For Investing | |
| 12Stocks.com: Top Performing Small Cap Index Stocks | ||||||||||||||||||||||||||||||||||||||||||||||||
 The top performing Small Cap Index stocks year to date are
Now, more recently, over last week, the top performing Small Cap Index stocks on the move are


|
||||||||||||||||||||||||||||||||||||||||||||||||
| 12Stocks.com: Investing in Smallcap Index using Exchange Traded Funds | |
|
The following table shows list of key exchange traded funds (ETF) that
help investors track Smallcap index. The following list also includes leveraged ETF funds that track twice or thrice the daily returns of Smallcap indices. Short or inverse ETF funds move in the opposite direction to the index they track and are useful during market pullbacks or during bear markets. Quick View: Move mouse or cursor over ETF symbol (ticker) to view short-term technical chart and over ETF name to view long term chart. Click on ticker or stock name for detailed view. Click on to add stock symbol to your watchlist and to view watchlist. |
12Stocks.com List of ETFs that track Smallcap Index
| Ticker | ETF Name | Watchlist | Recent Price | Smart Investing & Trading Score | Change % | Week % | Year-to-date % |
| IWM | iShares Russell 2000 | | 201.90 | 69 | 0.99 | 1.77 | 0.59% |
| IJR | iShares Core S&P Small-Cap | | 107.13 | 82 | 0.75 | 1.4 | -1.03% |
| VTWO | Vanguard Russell 2000 ETF | | 81.61 | 69 | 0.94 | 1.73 | 0.63% |
| IWN | iShares Russell 2000 Value | | 154.21 | 100 | 0.87 | 2.03 | -0.72% |
| IJS | iShares S&P Small-Cap 600 Value | | 98.72 | 64 | 0.71 | 1.57 | -4.22% |
| IWO | iShares Russell 2000 Growth | | 256.87 | 57 | 0.99 | 1.49 | 1.84% |
| IJT | iShares S&P Small-Cap 600 Growth | | 127.76 | 95 | 0.82 | 1.32 | 2.09% |
| XSLV | PowerShares S&P SmallCap Low Volatil ETF | | 43.22 | 87 | 0.19 | 1.17 | -2.11% |
| SBB | ProShares Short SmallCap600 | | 16.16 | 13 | -1.28 | -1.37 | 1.44% |
| SDD | ProShares UltraShort SmallCap600 | | 18.84 | 23 | -2.41 | -2.61 | 2.27% |
| SAA | ProShares Ultra SmallCap600 | | 23.59 | 69 | 2.86 | 2.39 | -5.45% |
| SMLV | SPDR SSGA US Small Cap Low Volatil ETF | | 109.69 | 87 | 0.78 | 2.01 | -2.52% |
| 12Stocks.com: Charts, Trends, Fundamental Data and Performances of SmallCap Stocks | |
|
We now take in-depth look at all SmallCap stocks including charts, multi-period performances and overall trends (as measured by Smart Investing & Trading Score). One can sort SmallCap stocks (click link to choose) by Daily, Weekly and by Year-to-Date performances. Also, one can sort by size of the company or by market capitalization. |
| Select Your Default Chart Type: | |||||
| |||||
| Click on stock symbol or name for detailed view. Click on to add stock symbol to your watchlist and to view watchlist. Quick View: Move mouse or cursor over "Daily" to quickly view daily technical stock chart and over "Weekly" to view weekly technical stock chart. | |||||

 | RBBN Ribbon Communications Inc. |
| Sector: Technology | |
| SubSector: Telecom Services - Domestic | |
| MarketCap: 284.577 Millions | |
| Recent Price: 3.17 Smart Investing & Trading Score: 63 | |
| Day Percent Change: -1.25% Day Change: -0.04 | |
| Week Change: 1.28% Year-to-date Change: 9.3% | |
| RBBN Links: Profile News Message Board | |
| Charts:- Daily , Weekly | |
| Add RBBN to Watchlist: View: Get Complete RBBN Trend Analysis ➞ | |
 | HLIT Harmonic Inc. |
| Sector: Technology | |
| SubSector: Communication Equipment | |
| MarketCap: 533.539 Millions | |
| Recent Price: 10.96 Smart Investing & Trading Score: 64 | |
| Day Percent Change: -1.26% Day Change: -0.14 | |
| Week Change: 19.13% Year-to-date Change: -16.0% | |
| HLIT Links: Profile News Message Board | |
| Charts:- Daily , Weekly | |
| Add HLIT to Watchlist: View: Get Complete HLIT Trend Analysis ➞ | |
 | NTGR NETGEAR, Inc. |
| Sector: Technology | |
| SubSector: Communication Equipment | |
| MarketCap: 558.839 Millions | |
| Recent Price: 11.63 Smart Investing & Trading Score: 0 | |
| Day Percent Change: -1.27% Day Change: -0.15 | |
| Week Change: -21.68% Year-to-date Change: -20.2% | |
| NTGR Links: Profile News Message Board | |
| Charts:- Daily , Weekly | |
| Add NTGR to Watchlist: View: Get Complete NTGR Trend Analysis ➞ | |
 | EXLS ExlService Holdings, Inc. |
| Sector: Technology | |
| SubSector: Information Technology Services | |
| MarketCap: 1781.78 Millions | |
| Recent Price: 29.65 Smart Investing & Trading Score: 49 | |
| Day Percent Change: -1.27% Day Change: -0.38 | |
| Week Change: 0.99% Year-to-date Change: -3.9% | |
| EXLS Links: Profile News Message Board | |
| Charts:- Daily , Weekly | |
| Add EXLS to Watchlist: View: Get Complete EXLS Trend Analysis ➞ | |
 | TENB Tenable Holdings, Inc. |
| Sector: Technology | |
| SubSector: Business Software & Services | |
| MarketCap: 1986.68 Millions | |
| Recent Price: 44.60 Smart Investing & Trading Score: 7 | |
| Day Percent Change: -1.35% Day Change: -0.61 | |
| Week Change: -3.02% Year-to-date Change: -3.2% | |
| TENB Links: Profile News Message Board | |
| Charts:- Daily , Weekly | |
| Add TENB to Watchlist: View: Get Complete TENB Trend Analysis ➞ | |
 | ROG Rogers Corporation |
| Sector: Technology | |
| SubSector: Diversified Electronics | |
| MarketCap: 1756.36 Millions | |
| Recent Price: 118.33 Smart Investing & Trading Score: 76 | |
| Day Percent Change: -1.39% Day Change: -1.67 | |
| Week Change: -2.23% Year-to-date Change: -10.4% | |
| ROG Links: Profile News Message Board | |
| Charts:- Daily , Weekly | |
| Add ROG to Watchlist: View: Get Complete ROG Trend Analysis ➞ | |
 | HQY HealthEquity, Inc. |
| Sector: Technology | |
| SubSector: Healthcare Information Services | |
| MarketCap: 3369.75 Millions | |
| Recent Price: 78.55 Smart Investing & Trading Score: 8 | |
| Day Percent Change: -1.50% Day Change: -1.20 | |
| Week Change: -2.13% Year-to-date Change: 18.5% | |
| HQY Links: Profile News Message Board | |
| Charts:- Daily , Weekly | |
| Add HQY to Watchlist: View: Get Complete HQY Trend Analysis ➞ | |
 | PRFT Perficient, Inc. |
| Sector: Technology | |
| SubSector: Information Technology Services | |
| MarketCap: 1005.68 Millions | |
| Recent Price: 48.11 Smart Investing & Trading Score: 49 | |
| Day Percent Change: -1.51% Day Change: -0.74 | |
| Week Change: 11.91% Year-to-date Change: -26.9% | |
| PRFT Links: Profile News Message Board | |
| Charts:- Daily , Weekly | |
| Add PRFT to Watchlist: View: Get Complete PRFT Trend Analysis ➞ | |
 | BMBL Bumble Inc. |
| Sector: Technology | |
| SubSector: Software - Application | |
| MarketCap: 2290 Millions | |
| Recent Price: 10.04 Smart Investing & Trading Score: 23 | |
| Day Percent Change: -1.57% Day Change: -0.16 | |
| Week Change: -4.29% Year-to-date Change: -32.4% | |
| BMBL Links: Profile News Message Board | |
| Charts:- Daily , Weekly | |
| Add BMBL to Watchlist: View: Get Complete BMBL Trend Analysis ➞ | |
 | PRO PROS Holdings, Inc. |
| Sector: Technology | |
| SubSector: Application Software | |
| MarketCap: 1357.42 Millions | |
| Recent Price: 32.89 Smart Investing & Trading Score: 25 | |
| Day Percent Change: -1.76% Day Change: -0.59 | |
| Week Change: -3.21% Year-to-date Change: -15.2% | |
| PRO Links: Profile News Message Board | |
| Charts:- Daily , Weekly | |
| Add PRO to Watchlist: View: Get Complete PRO Trend Analysis ➞ | |
 | ONTF ON24, Inc. |
| Sector: Technology | |
| SubSector: Software - Application | |
| MarketCap: 386 Millions | |
| Recent Price: 6.71 Smart Investing & Trading Score: 42 | |
| Day Percent Change: -1.76% Day Change: -0.12 | |
| Week Change: -0.45% Year-to-date Change: -14.9% | |
| ONTF Links: Profile News Message Board | |
| Charts:- Daily , Weekly | |
| Add ONTF to Watchlist: View: Get Complete ONTF Trend Analysis ➞ | |
 | PWSC PowerSchool Holdings, Inc. |
| Sector: Technology | |
| SubSector: Software - Application | |
| MarketCap: 3870 Millions | |
| Recent Price: 16.61 Smart Investing & Trading Score: 10 | |
| Day Percent Change: -1.80% Day Change: -0.30 | |
| Week Change: -5.49% Year-to-date Change: -29.8% | |
| PWSC Links: Profile News Message Board | |
| Charts:- Daily , Weekly | |
| Add PWSC to Watchlist: View: Get Complete PWSC Trend Analysis ➞ | |
 | EXTR Extreme Networks, Inc. |
| Sector: Technology | |
| SubSector: Communication Equipment | |
| MarketCap: 339.939 Millions | |
| Recent Price: 11.20 Smart Investing & Trading Score: 42 | |
| Day Percent Change: -1.93% Day Change: -0.22 | |
| Week Change: -3.45% Year-to-date Change: -36.5% | |
| EXTR Links: Profile News Message Board | |
| Charts:- Daily , Weekly | |
| Add EXTR to Watchlist: View: Get Complete EXTR Trend Analysis ➞ | |
 | DOCN DigitalOcean Holdings, Inc. |
| Sector: Technology | |
| SubSector: Software - Infrastructure | |
| MarketCap: 3620 Millions | |
| Recent Price: 34.09 Smart Investing & Trading Score: 32 | |
| Day Percent Change: -1.98% Day Change: -0.69 | |
| Week Change: 1.73% Year-to-date Change: -7.8% | |
| DOCN Links: Profile News Message Board | |
| Charts:- Daily , Weekly | |
| Add DOCN to Watchlist: View: Get Complete DOCN Trend Analysis ➞ | |
 | BAND Bandwidth Inc. |
| Sector: Technology | |
| SubSector: Business Software & Services | |
| MarketCap: 1549.38 Millions | |
| Recent Price: 19.26 Smart Investing & Trading Score: 64 | |
| Day Percent Change: -2.13% Day Change: -0.42 | |
| Week Change: 6.76% Year-to-date Change: 33.1% | |
| BAND Links: Profile News Message Board | |
| Charts:- Daily , Weekly | |
| Add BAND to Watchlist: View: Get Complete BAND Trend Analysis ➞ | |
 | RMNI Rimini Street, Inc. |
| Sector: Technology | |
| SubSector: Application Software | |
| MarketCap: 288.762 Millions | |
| Recent Price: 2.55 Smart Investing & Trading Score: 0 | |
| Day Percent Change: -2.30% Day Change: -0.06 | |
| Week Change: -8.93% Year-to-date Change: -22.0% | |
| RMNI Links: Profile News Message Board | |
| Charts:- Daily , Weekly | |
| Add RMNI to Watchlist: View: Get Complete RMNI Trend Analysis ➞ | |
 | TCX Tucows Inc. |
| Sector: Technology | |
| SubSector: Internet Information Providers | |
| MarketCap: 557.78 Millions | |
| Recent Price: 18.33 Smart Investing & Trading Score: 69 | |
| Day Percent Change: -2.34% Day Change: -0.44 | |
| Week Change: 2.12% Year-to-date Change: -32.1% | |
| TCX Links: Profile News Message Board | |
| Charts:- Daily , Weekly | |
| Add TCX to Watchlist: View: Get Complete TCX Trend Analysis ➞ | |
 | COHU Cohu, Inc. |
| Sector: Technology | |
| SubSector: Semiconductor Equipment & Materials | |
| MarketCap: 519.518 Millions | |
| Recent Price: 29.60 Smart Investing & Trading Score: 0 | |
| Day Percent Change: -2.44% Day Change: -0.74 | |
| Week Change: -4.76% Year-to-date Change: -16.4% | |
| COHU Links: Profile News Message Board | |
| Charts:- Daily , Weekly | |
| Add COHU to Watchlist: View: Get Complete COHU Trend Analysis ➞ | |
 | SKYT SkyWater Technology, Inc. |
| Sector: Technology | |
| SubSector: Semiconductors | |
| MarketCap: 394 Millions | |
| Recent Price: 10.20 Smart Investing & Trading Score: 40 | |
| Day Percent Change: -2.49% Day Change: -0.26 | |
| Week Change: 4.72% Year-to-date Change: 5.8% | |
| SKYT Links: Profile News Message Board | |
| Charts:- Daily , Weekly | |
| Add SKYT to Watchlist: View: Get Complete SKYT Trend Analysis ➞ | |
 | TTGT TechTarget, Inc. |
| Sector: Technology | |
| SubSector: Internet Information Providers | |
| MarketCap: 560.78 Millions | |
| Recent Price: 28.00 Smart Investing & Trading Score: 62 | |
| Day Percent Change: -2.68% Day Change: -0.77 | |
| Week Change: 1.82% Year-to-date Change: -19.7% | |
| TTGT Links: Profile News Message Board | |
| Charts:- Daily , Weekly | |
| Add TTGT to Watchlist: View: Get Complete TTGT Trend Analysis ➞ | |
 | TWKS Thoughtworks Holding, Inc. |
| Sector: Technology | |
| SubSector: Information Technology Services | |
| MarketCap: 2370 Millions | |
| Recent Price: 2.25 Smart Investing & Trading Score: 20 | |
| Day Percent Change: -3.02% Day Change: -0.07 | |
| Week Change: -5.86% Year-to-date Change: -53.7% | |
| TWKS Links: Profile News Message Board | |
| Charts:- Daily , Weekly | |
| Add TWKS to Watchlist: View: Get Complete TWKS Trend Analysis ➞ | |
 | FLYW Flywire Corporation |
| Sector: Technology | |
| SubSector: Software - Infrastructure | |
| MarketCap: 3390 Millions | |
| Recent Price: 19.57 Smart Investing & Trading Score: 0 | |
| Day Percent Change: -3.02% Day Change: -0.61 | |
| Week Change: -5.87% Year-to-date Change: -16.5% | |
| FLYW Links: Profile News Message Board | |
| Charts:- Daily , Weekly | |
| Add FLYW to Watchlist: View: Get Complete FLYW Trend Analysis ➞ | |
 | UIS Unisys Corporation |
| Sector: Technology | |
| SubSector: Information Technology Services | |
| MarketCap: 803.868 Millions | |
| Recent Price: 5.08 Smart Investing & Trading Score: 0 | |
| Day Percent Change: -3.05% Day Change: -0.16 | |
| Week Change: -6.96% Year-to-date Change: -9.6% | |
| UIS Links: Profile News Message Board | |
| Charts:- Daily , Weekly | |
| Add UIS to Watchlist: View: Get Complete UIS Trend Analysis ➞ | |
 | RELY Remitly Global, Inc. |
| Sector: Technology | |
| SubSector: Software - Infrastructure | |
| MarketCap: 3320 Millions | |
| Recent Price: 14.91 Smart Investing & Trading Score: 71 | |
| Day Percent Change: -3.18% Day Change: -0.49 | |
| Week Change: -17.44% Year-to-date Change: -23.2% | |
| RELY Links: Profile News Message Board | |
| Charts:- Daily , Weekly | |
| Add RELY to Watchlist: View: Get Complete RELY Trend Analysis ➞ | |
 | FSLY Fastly, Inc. |
| Sector: Technology | |
| SubSector: Application Software | |
| MarketCap: 1973.72 Millions | |
| Recent Price: 8.48 Smart Investing & Trading Score: 7 | |
| Day Percent Change: -3.53% Day Change: -0.31 | |
| Week Change: -34.52% Year-to-date Change: -52.4% | |
| FSLY Links: Profile News Message Board | |
| Charts:- Daily , Weekly | |
| Add FSLY to Watchlist: View: Get Complete FSLY Trend Analysis ➞ | |
| For tabular summary view of above stock list: Summary View ➞ 0 - 25 , 25 - 50 , 50 - 75 , 75 - 100 , 100 - 125 , 125 - 150 , 150 - 175 , 175 - 200 , 200 - 225 , 225 - 250 , 250 - 275 | ||
| Click To Change The Sort Order: By Market Cap or Company Size Performance: Year-to-date, Week and Day | |
| Select Chart Type: | ||
| Too many stocks? View smallcap stocks filtered by marketcap & sector |
| Marketcap: All SmallCap Stocks (default-no microcap), Large, Mid-Range, Small & MicroCap |
| Sector: Tech, Finance, Energy, Staples, Retail, Industrial, Materials, Utilities & Medical |
|
Best Stocks Today 12Stocks.com |
© 2024 12Stocks.com Terms & Conditions Privacy Contact Us
All Information Provided Only For Education And Not To Be Used For Investing or Trading. See Terms & Conditions


One More Thing ... Get Best Stocks Delivered Daily!
Never Ever Miss A Move With Our Top Ten Stocks Lists
Find Best Stocks In Any Market - Bull or Bear Market
Take A Peek At Our Top Ten Stocks Lists: Daily, Weekly, Year-to-Date & Top Trends
Find Best Stocks In Any Market - Bull or Bear Market
Take A Peek At Our Top Ten Stocks Lists: Daily, Weekly, Year-to-Date & Top Trends
Smallcap Stocks With Best Up Trends [0-bearish to 100-bullish]: Twist Bioscience[100], WideOpenWest [100], Joint [100], FTC Solar[100], Origin Materials[100], Alignment Healthcare[100], Clarus [100], IES [100], Emergent BioSolutions[100], Enovix [100], El Pollo[100]
Best Smallcap Stocks Year-to-Date:
Janux [482.74%], Viking [313.59%], Longboard [272.5%], Alpine Immune[239.29%], Bakkt [199.55%], Avidity Biosciences[192.48%], Vera [189.47%], Cullinan Oncology[176.9%], Super Micro[175.35%], Y-mAbs [151.47%], Sana [149.33%] Best Smallcap Stocks This Week:
Emergent BioSolutions[102.6%], Deciphera [73.24%], Origin Materials[66.52%], Eyenovia [60.78%], Cue Biopharma[56.04%], Aspen Aerogels[55.96%], Enovix [54.02%], Luna Innovations[53.77%], Codexis [47.37%], Carvana Co[44.31%], Office Properties[42.79%] Best Smallcap Stocks Daily:
Luna Innovations[36.00%], Twist Bioscience[28.74%], Ardelyx [28.42%], WideOpenWest [28.23%], 2U [26.63%], Joint [25.35%], FTC Solar[25.09%], Origin Materials[22.23%], Alignment Healthcare[21.97%], Clarus [18.67%], Aurora Innovation[18.09%]