
 Login Sign Up


| |||||
 |  | ||||

| 12Stocks.com Market Intelligence |
Best SmallCap Stocks
|
| In a hurry? Small Cap Stock Lists: Performance Trends Table, Stock Charts
Sort Small Cap stocks: Daily, Weekly, Year-to-Date, Market Cap & Trends. Filter Small Cap stocks list by sector: Show all, Tech, Finance, Energy, Staples, Retail, Industrial, Materials, Utilities and HealthCare Filter Small Cap stocks list by size: All Large Medium Small and MicroCap |
| 12Stocks.com Small Cap Stocks Performances & Trends Daily | |||||||||
|
|  The overall Smart Investing & Trading Score is 80 (0-bearish to 100-bullish) which puts Small Cap index in short term neutral to bullish trend. The Smart Investing & Trading Score from previous trading session is 100 and a deterioration of trend continues.
| ||||||||
Here are the Smart Investing & Trading Scores of the most requested small cap stocks at 12Stocks.com (click stock name for detailed review):
|


| 12Stocks.com: Investing in Smallcap Index with Stocks | |
|
The following table helps investors and traders sort through current performance and trends (as measured by Smart Investing & Trading Score) of various
stocks in the Smallcap Index. Quick View: Move mouse or cursor over stock symbol (ticker) to view short-term technical chart and over stock name to view long term chart. Click on  to add stock symbol to your watchlist and to add stock symbol to your watchlist and  to view watchlist. Click on any ticker or stock name for detailed market intelligence report for that stock. to view watchlist. Click on any ticker or stock name for detailed market intelligence report for that stock. |
12Stocks.com Performance of Stocks in Smallcap Index
| Ticker | Stock Name | Watchlist | Category | Recent Price | Smart Investing & Trading Score | Change % | YTD Change% |
| COOP | Mr. Cooper |   | Financials | 219.80 | 80 | -0.25% | 133.83% |
| SSB | SouthState Bank | | Financials | 100.81 | 40 | -0.43% | 5.77% |
| ONB | Old National | | Financials | 22.05 | 20 | -2.69% | 5.52% |
| HLNE | Hamilton Lane | | Financials | 146.53 | 20 | -1.52% | -1.02% |
| CTRE | CareTrust REIT | | Financials | 34.25 | 70 | 0.15% | 32.11% |
| STEP | StepStone Group | | Financials | 60.80 | 30 | -1.84% | 5.22% |
| CADE | Cadence Bank | | Financials | 36.81 | 30 | -2.36% | 11.24% |
| JXN | Jackson Financial | | Financials | 96.78 | 36 | -0.88% | 11.76% |
| FCFS | FirstCash | | Financials | 146.96 | 70 | 0.42% | 44.14% |
| upst | Upstart | | Financials | 66.98 | 50 | 6.18% | 10.16% |
| RHP | Ryman Hospitality | | Financials | 99.29 | 50 | -0.88% | -0.84% |
| ESNT | Essent Group | | Financials | 63.34 | 50 | -0.74% | 17.56% |
| PJT | PJT Partners | | Financials | 181.37 | 60 | -1.33% | 16.22% |
| EPRT | Essential Properties | | Financials | 29.92 | 20 | 0.27% | -1.14% |
| TRNO | Terreno Realty | | Financials | 58.28 | 70 | -0.48% | 3.21% |
| PFSI | PennyMac Financial | | Financials | 124.34 | 90 | -0.14% | 25.29% |
| VLY | Valley National | | Financials | 10.65 | 50 | -1.30% | 22.32% |
| HOMB | Home Bancshares | | Financials | 29.38 | 30 | -1.64% | 7.03% |
| GBCI | Glacier Bancorp | | Financials | 48.14 | 30 | -1.59% | -1.52% |
| PIPR | Piper Sandler | | Financials | 349.64 | 90 | 1.08% | 18.65% |
| MC | Moelis & Co | | Financials | 74.48 | 90 | -0.28% | 3.44% |
| ACT | Enact | | Financials | 38.22 | 40 | -1.77% | 19.60% |
| MARA | MARA | | Financials | 16.24 | 60 | -0.43% | -5.64% |
| UBSI | United Bankshares | | Financials | 37.15 | 30 | -0.75% | 2.44% |
| HWC | Hancock Whitney | | Financials | 63.07 | 60 | -0.24% | 18.71% |
| For chart view version of above stock list: Chart View ➞ 0 - 25 , 25 - 50 , 50 - 75 , 75 - 100 , 100 - 125 , 125 - 150 , 150 - 175 , 175 - 200 , 200 - 225 , 225 - 250 , 250 - 275 , 275 - 300 , 300 - 325 , 325 - 350 , 350 - 375 , 375 - 400 | ||
 | Click To Change The Sort Order: By Market Cap or Company Size Performance: Year-to-date, Week and Day |  |
| Too many stocks? View smallcap stocks filtered by marketcap & sector |
| Marketcap: All SmallCap Stocks (default-no microcap), Large, Mid-Range, Small |
| Smallcap Sector: Tech, Finance, Energy, Staples, Retail, Industrial, Materials, & Medical |
|
Get the most comprehensive stock market coverage daily at 12Stocks.com ➞ Best Stocks Today ➞ Best Stocks Weekly ➞ Best Stocks Year-to-Date ➞ Best Stocks Trends ➞  Best Stocks Today 12Stocks.com Best Nasdaq Stocks ➞ Best S&P 500 Stocks ➞ Best Tech Stocks ➞ Best Biotech Stocks ➞ |
| Detailed Overview of SmallCap Stocks |
| SmallCap Technical Overview, Leaders & Laggards, Top SmallCap ETF Funds & Detailed SmallCap Stocks List, Charts, Trends & More |
| Smallcap: Technical Analysis, Trends & YTD Performance | |
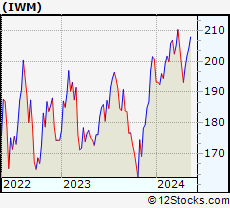
| SmallCap segment as represented by
IWM, an exchange-traded fund [ETF], holds basket of thousands of smallcap stocks from across all major sectors of the US stock market. The smallcap index (contains stocks like Riverbed & Sotheby's) is up by 8.77765% and is currently underperforming the overall market by -4.62315% year-to-date. Below is a quick view of technical charts and trends: | |
 IWM Weekly Chart |
|
| Long Term Trend: Very Good | |
| Medium Term Trend: Good | |
 IWM Daily Chart |
|
| Short Term Trend: Good | |
| Overall Trend Score: 80 | |
| YTD Performance: 8.77765% | |
| **Trend Scores & Views Are Only For Educational Purposes And Not For Investing | |
| 12Stocks.com: Top Performing Small Cap Index Stocks | ||||||||||||||||||||||||||||||||||||||||||||||||
 The top performing Small Cap Index stocks year to date are
Now, more recently, over last week, the top performing Small Cap Index stocks on the move are


|
||||||||||||||||||||||||||||||||||||||||||||||||
| 12Stocks.com: Investing in Smallcap Index using Exchange Traded Funds | |
|
The following table shows list of key exchange traded funds (ETF) that
help investors track Smallcap index. The following list also includes leveraged ETF funds that track twice or thrice the daily returns of Smallcap indices. Short or inverse ETF funds move in the opposite direction to the index they track and are useful during market pullbacks or during bear markets. Quick View: Move mouse or cursor over ETF symbol (ticker) to view short-term technical chart and over ETF name to view long term chart. Click on ticker or stock name for detailed view. Click on to add stock symbol to your watchlist and to view watchlist. |
12Stocks.com List of ETFs that track Smallcap Index
| Ticker | ETF Name | Watchlist | Recent Price | Smart Investing & Trading Score | Change % | Week % | Year-to-date % |
| IWM | iShares Russell 2000 ETF | | 239.35 | 80 | 0.423764 | 0.664508 | 8.77765% |
| IJR | iShares Core S&P Small-Cap ETF | | 118.57 | 70 | 0.0928584 | -0.470075 | 3.8248% |
| VTWO | Vanguard Russell 2000 Index ETF | | 96.80 | 80 | 0.404522 | 0.686499 | 8.91763% |
| IWN | iShares Russell 2000 Value ETF | | 176.23 | 80 | 0.387354 | 0.130682 | 8.34522% |
| IWO | iShares Russell 2000 Growth ETF | | 314.37 | 80 | 0.479432 | 1.13889 | 9.13844% |
| IJS | iShares S&P Small-Cap 600 Value ETF | | 110.64 | 80 | 0.144823 | -0.476747 | 3.1368% |
| IJT | iShares S&P Small-Cap 600 Growth ETF | | 140.88 | 60 | 0.0426076 | -0.360704 | 4.35478% |
| XSLV | Invesco S&P SmallCap Low Volatility ETF | | 47.06 | 40 | -0.570463 | -1.67154 | 1.07497% |
| SBB | ProShares Short SmallCap600 -1x Shares | | 14.03 | 20 | -0.0156829 | 0.42243 | -2.92892% |
| SAA | ProShares Ultra SmallCap600 2x Shares | | 25.47 | 80 | -0.181034 | -1.04841 | -1.26932% |
| SMLV | SPDR SSGA US Small Cap Low Volatility Index ETF | | 132.24 | 50 | -0.00529313 | -0.286533 | 6.06012% |
| SDD | ProShares UltraShort SmallCap600 -2x Shares | | 13.40 | 40 | 0.19964 | -2.57577 | -11.4008% |
| 12Stocks.com: Charts, Trends, Fundamental Data and Performances of SmallCap Stocks | |
|
We now take in-depth look at all SmallCap stocks including charts, multi-period performances and overall trends (as measured by Smart Investing & Trading Score). One can sort SmallCap stocks (click link to choose) by Daily, Weekly and by Year-to-Date performances. Also, one can sort by size of the company or by market capitalization. |
| Select Your Default Chart Type: | |||||
| |||||
| Click on stock symbol or name for detailed view. Click on to add stock symbol to your watchlist and to view watchlist. Quick View: Move mouse or cursor over "Daily" to quickly view daily technical stock chart and over "Weekly" to view weekly technical stock chart. | |||||

 | COOP Mr. Cooper Group Inc |
| Sector: Financials | |
| SubSector: Mortgage Finance | |
| MarketCap: 13637.6 Millions | |
| Recent Price: 219.80 Smart Investing & Trading Score: 80 | |
| Day Percent Change: -0.249603% Day Change: -2.14 | |
| Week Change: 3.13922% Year-to-date Change: 133.8% | |
| COOP Links: Profile News Message Board | |
| Charts:- Daily , Weekly | |
| Add COOP to Watchlist: View: Get Complete COOP Trend Analysis ➞ | |
 | SSB SouthState Bank Corp |
| Sector: Financials | |
| SubSector: Banks - Regional | |
| MarketCap: 10425.5 Millions | |
| Recent Price: 100.81 Smart Investing & Trading Score: 40 | |
| Day Percent Change: -0.434568% Day Change: -0.16 | |
| Week Change: -2.13572% Year-to-date Change: 5.8% | |
| SSB Links: Profile News Message Board | |
| Charts:- Daily , Weekly | |
| Add SSB to Watchlist: View: Get Complete SSB Trend Analysis ➞ | |
 | ONB Old National Bancorp |
| Sector: Financials | |
| SubSector: Banks - Regional | |
| MarketCap: 8942.13 Millions | |
| Recent Price: 22.05 Smart Investing & Trading Score: 20 | |
| Day Percent Change: -2.69197% Day Change: -0.2 | |
| Week Change: -3.37423% Year-to-date Change: 5.5% | |
| ONB Links: Profile News Message Board | |
| Charts:- Daily , Weekly | |
| Add ONB to Watchlist: View: Get Complete ONB Trend Analysis ➞ | |
 | HLNE Hamilton Lane Inc |
| Sector: Financials | |
| SubSector: Asset Management | |
| MarketCap: 8191.13 Millions | |
| Recent Price: 146.53 Smart Investing & Trading Score: 20 | |
| Day Percent Change: -1.51892% Day Change: -0.56 | |
| Week Change: 0.280591% Year-to-date Change: -1.0% | |
| HLNE Links: Profile News Message Board | |
| Charts:- Daily , Weekly | |
| Add HLNE to Watchlist: View: Get Complete HLNE Trend Analysis ➞ | |
 | CTRE CareTrust REIT Inc |
| Sector: Financials | |
| SubSector: REIT - Healthcare Facilities | |
| MarketCap: 7578.81 Millions | |
| Recent Price: 34.25 Smart Investing & Trading Score: 70 | |
| Day Percent Change: 0.146199% Day Change: 0.23 | |
| Week Change: 0.913377% Year-to-date Change: 32.1% | |
| CTRE Links: Profile News Message Board | |
| Charts:- Daily , Weekly | |
| Add CTRE to Watchlist: View: Get Complete CTRE Trend Analysis ➞ | |
 | STEP StepStone Group Inc |
| Sector: Financials | |
| SubSector: Asset Management | |
| MarketCap: 7189.68 Millions | |
| Recent Price: 60.80 Smart Investing & Trading Score: 30 | |
| Day Percent Change: -1.84049% Day Change: 0.14 | |
| Week Change: -0.164204% Year-to-date Change: 5.2% | |
| STEP Links: Profile News Message Board | |
| Charts:- Daily , Weekly | |
| Add STEP to Watchlist: View: Get Complete STEP Trend Analysis ➞ | |
 | CADE Cadence Bank |
| Sector: Financials | |
| SubSector: Banks - Regional | |
| MarketCap: 6901.82 Millions | |
| Recent Price: 36.81 Smart Investing & Trading Score: 30 | |
| Day Percent Change: -2.36074% Day Change: -0.09 | |
| Week Change: -2.5417% Year-to-date Change: 11.2% | |
| CADE Links: Profile News Message Board | |
| Charts:- Daily , Weekly | |
| Add CADE to Watchlist: View: Get Complete CADE Trend Analysis ➞ | |
 | JXN Jackson Financial Inc |
| Sector: Financials | |
| SubSector: Insurance - Life | |
| MarketCap: 6646.14 Millions | |
| Recent Price: 96.78 Smart Investing & Trading Score: 36 | |
| Day Percent Change: -0.88% Day Change: -0.85 | |
| Week Change: -1.05% Year-to-date Change: 11.8% | |
| JXN Links: Profile News Message Board | |
| Charts:- Daily , Weekly | |
| Add JXN to Watchlist: View: Get Complete JXN Trend Analysis ➞ | |
 | FCFS FirstCash Holdings Inc |
| Sector: Financials | |
| SubSector: Credit Services | |
| MarketCap: 6527.36 Millions | |
| Recent Price: 146.96 Smart Investing & Trading Score: 70 | |
| Day Percent Change: 0.423671% Day Change: -0.41 | |
| Week Change: -0.115544% Year-to-date Change: 44.1% | |
| FCFS Links: Profile News Message Board | |
| Charts:- Daily , Weekly | |
| Add FCFS to Watchlist: View: Get Complete FCFS Trend Analysis ➞ | |
 | upst Upstart Holdings Inc |
| Sector: Financials | |
| SubSector: Credit Services | |
| MarketCap: 6436.97 Millions | |
| Recent Price: 66.98 Smart Investing & Trading Score: 50 | |
| Day Percent Change: 6.18263% Day Change: -0.36 | |
| Week Change: 0.119581% Year-to-date Change: 10.2% | |
| upst Links: Profile News Message Board | |
| Charts:- Daily , Weekly | |
| Add upst to Watchlist: View: Get Complete upst Trend Analysis ➞ | |
 | RHP Ryman Hospitality Properties Inc |
| Sector: Financials | |
| SubSector: REIT - Hotel & Motel | |
| MarketCap: 6349.11 Millions | |
| Recent Price: 99.29 Smart Investing & Trading Score: 50 | |
| Day Percent Change: -0.878507% Day Change: -0.41 | |
| Week Change: -1.47847% Year-to-date Change: -0.8% | |
| RHP Links: Profile News Message Board | |
| Charts:- Daily , Weekly | |
| Add RHP to Watchlist: View: Get Complete RHP Trend Analysis ➞ | |
 | ESNT Essent Group Ltd |
| Sector: Financials | |
| SubSector: Insurance - Specialty | |
| MarketCap: 6292.37 Millions | |
| Recent Price: 63.34 Smart Investing & Trading Score: 50 | |
| Day Percent Change: -0.736562% Day Change: -0.28 | |
| Week Change: -0.814281% Year-to-date Change: 17.6% | |
| ESNT Links: Profile News Message Board | |
| Charts:- Daily , Weekly | |
| Add ESNT to Watchlist: View: Get Complete ESNT Trend Analysis ➞ | |
 | PJT PJT Partners Inc |
| Sector: Financials | |
| SubSector: Capital Markets | |
| MarketCap: 6267.7 Millions | |
| Recent Price: 181.37 Smart Investing & Trading Score: 60 | |
| Day Percent Change: -1.32746% Day Change: -1.45 | |
| Week Change: 0.716348% Year-to-date Change: 16.2% | |
| PJT Links: Profile News Message Board | |
| Charts:- Daily , Weekly | |
| Add PJT to Watchlist: View: Get Complete PJT Trend Analysis ➞ | |
 | EPRT Essential Properties Realty Trust Inc |
| Sector: Financials | |
| SubSector: REIT - Retail | |
| MarketCap: 6119.76 Millions | |
| Recent Price: 29.92 Smart Investing & Trading Score: 20 | |
| Day Percent Change: 0.268097% Day Change: 0.04 | |
| Week Change: -2.85714% Year-to-date Change: -1.1% | |
| EPRT Links: Profile News Message Board | |
| Charts:- Daily , Weekly | |
| Add EPRT to Watchlist: View: Get Complete EPRT Trend Analysis ➞ | |
 | TRNO Terreno Realty Corp |
| Sector: Financials | |
| SubSector: REIT - Industrial | |
| MarketCap: 6103.06 Millions | |
| Recent Price: 58.28 Smart Investing & Trading Score: 70 | |
| Day Percent Change: -0.478142% Day Change: -0.28 | |
| Week Change: -1.3541% Year-to-date Change: 3.2% | |
| TRNO Links: Profile News Message Board | |
| Charts:- Daily , Weekly | |
| Add TRNO to Watchlist: View: Get Complete TRNO Trend Analysis ➞ | |
 | PFSI PennyMac Financial Services Inc |
| Sector: Financials | |
| SubSector: Mortgage Finance | |
| MarketCap: 6075.41 Millions | |
| Recent Price: 124.34 Smart Investing & Trading Score: 90 | |
| Day Percent Change: -0.136535% Day Change: -1.9 | |
| Week Change: 5.83028% Year-to-date Change: 25.3% | |
| PFSI Links: Profile News Message Board | |
| Charts:- Daily , Weekly | |
| Add PFSI to Watchlist: View: Get Complete PFSI Trend Analysis ➞ | |
 | VLY Valley National Bancorp |
| Sector: Financials | |
| SubSector: Banks - Regional | |
| MarketCap: 6005.81 Millions | |
| Recent Price: 10.65 Smart Investing & Trading Score: 50 | |
| Day Percent Change: -1.2975% Day Change: -0.07 | |
| Week Change: -0.745573% Year-to-date Change: 22.3% | |
| VLY Links: Profile News Message Board | |
| Charts:- Daily , Weekly | |
| Add VLY to Watchlist: View: Get Complete VLY Trend Analysis ➞ | |
 | HOMB Home Bancshares Inc |
| Sector: Financials | |
| SubSector: Banks - Regional | |
| MarketCap: 5884.77 Millions | |
| Recent Price: 29.38 Smart Investing & Trading Score: 30 | |
| Day Percent Change: -1.64044% Day Change: -0.16 | |
| Week Change: -1.6075% Year-to-date Change: 7.0% | |
| HOMB Links: Profile News Message Board | |
| Charts:- Daily , Weekly | |
| Add HOMB to Watchlist: View: Get Complete HOMB Trend Analysis ➞ | |
 | GBCI Glacier Bancorp, Inc |
| Sector: Financials | |
| SubSector: Banks - Regional | |
| MarketCap: 5880.21 Millions | |
| Recent Price: 48.14 Smart Investing & Trading Score: 30 | |
| Day Percent Change: -1.59444% Day Change: -0.5 | |
| Week Change: -2.94355% Year-to-date Change: -1.5% | |
| GBCI Links: Profile News Message Board | |
| Charts:- Daily , Weekly | |
| Add GBCI to Watchlist: View: Get Complete GBCI Trend Analysis ➞ | |
 | PIPR Piper Sandler Co's |
| Sector: Financials | |
| SubSector: Capital Markets | |
| MarketCap: 5791.71 Millions | |
| Recent Price: 349.64 Smart Investing & Trading Score: 90 | |
| Day Percent Change: 1.07832% Day Change: -2.07 | |
| Week Change: 6.79618% Year-to-date Change: 18.6% | |
| PIPR Links: Profile News Message Board | |
| Charts:- Daily , Weekly | |
| Add PIPR to Watchlist: View: Get Complete PIPR Trend Analysis ➞ | |
 | MC Moelis & Co |
| Sector: Financials | |
| SubSector: Capital Markets | |
| MarketCap: 5704.94 Millions | |
| Recent Price: 74.48 Smart Investing & Trading Score: 90 | |
| Day Percent Change: -0.281162% Day Change: -0.94 | |
| Week Change: 5.37634% Year-to-date Change: 3.4% | |
| MC Links: Profile News Message Board | |
| Charts:- Daily , Weekly | |
| Add MC to Watchlist: View: Get Complete MC Trend Analysis ➞ | |
 | ACT Enact Holdings Inc |
| Sector: Financials | |
| SubSector: Insurance - Specialty | |
| MarketCap: 5689.29 Millions | |
| Recent Price: 38.22 Smart Investing & Trading Score: 40 | |
| Day Percent Change: -1.77332% Day Change: -0.18 | |
| Week Change: -0.907441% Year-to-date Change: 19.6% | |
| ACT Links: Profile News Message Board | |
| Charts:- Daily , Weekly | |
| Add ACT to Watchlist: View: Get Complete ACT Trend Analysis ➞ | |
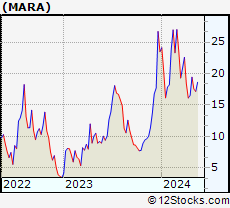 | MARA MARA Holdings Inc |
| Sector: Financials | |
| SubSector: Capital Markets | |
| MarketCap: 5627.26 Millions | |
| Recent Price: 16.24 Smart Investing & Trading Score: 60 | |
| Day Percent Change: -0.429185% Day Change: 0.06 | |
| Week Change: 6.91244% Year-to-date Change: -5.6% | |
| MARA Links: Profile News Message Board | |
| Charts:- Daily , Weekly | |
| Add MARA to Watchlist: View: Get Complete MARA Trend Analysis ➞ | |
 | UBSI United Bankshares, Inc |
| Sector: Financials | |
| SubSector: Banks - Regional | |
| MarketCap: 5420.84 Millions | |
| Recent Price: 37.15 Smart Investing & Trading Score: 30 | |
| Day Percent Change: -0.748063% Day Change: -0.15 | |
| Week Change: -2.92657% Year-to-date Change: 2.4% | |
| UBSI Links: Profile News Message Board | |
| Charts:- Daily , Weekly | |
| Add UBSI to Watchlist: View: Get Complete UBSI Trend Analysis ➞ | |
 | HWC Hancock Whitney Corp |
| Sector: Financials | |
| SubSector: Banks - Regional | |
| MarketCap: 5315.83 Millions | |
| Recent Price: 63.07 Smart Investing & Trading Score: 60 | |
| Day Percent Change: -0.237267% Day Change: -0.18 | |
| Week Change: 0.558036% Year-to-date Change: 18.7% | |
| HWC Links: Profile News Message Board | |
| Charts:- Daily , Weekly | |
| Add HWC to Watchlist: View: Get Complete HWC Trend Analysis ➞ | |
| For tabular summary view of above stock list: Summary View ➞ 0 - 25 , 25 - 50 , 50 - 75 , 75 - 100 , 100 - 125 , 125 - 150 , 150 - 175 , 175 - 200 , 200 - 225 , 225 - 250 , 250 - 275 , 275 - 300 , 300 - 325 , 325 - 350 , 350 - 375 , 375 - 400 | ||
| Click To Change The Sort Order: By Market Cap or Company Size Performance: Year-to-date, Week and Day | |
| Select Chart Type: | ||
| Too many stocks? View smallcap stocks filtered by marketcap & sector |
| Marketcap: All SmallCap Stocks (default-no microcap), Large, Mid-Range, Small & MicroCap |
| Sector: Tech, Finance, Energy, Staples, Retail, Industrial, Materials, Utilities & Medical |
|
Best Stocks Today 12Stocks.com |
© 2025 12Stocks.com Terms & Conditions Privacy Contact Us
All Information Provided Only For Education And Not To Be Used For Investing or Trading. See Terms & Conditions


One More Thing ... Get Best Stocks Delivered Daily!
Never Ever Miss A Move With Our Top Ten Stocks Lists
Find Best Stocks In Any Market - Bull or Bear Market
Take A Peek At Our Top Ten Stocks Lists: Daily, Weekly, Year-to-Date & Top Trends
Find Best Stocks In Any Market - Bull or Bear Market
Take A Peek At Our Top Ten Stocks Lists: Daily, Weekly, Year-to-Date & Top Trends
Smallcap Stocks With Best Up Trends [0-bearish to 100-bullish]: Office Properties[100], AVITA Medical[100], Monte Rosa[100], Berry Corp[100], AlloVir [100], GoPro [100], Energy Fuels[100], Cara [100], Fastly [100], Uranium Energy[100], P.A.M. Transportation[100]
Best Smallcap Stocks Year-to-Date:
GrafTech [509.884%], FiscalNote [322.115%], Celcuity [319.421%], Immuneering Corp[255.656%], OptimizeRx Corp[232.63%], Precigen [232.407%], Centrus Energy[228.805%], CommScope Holding[222.674%], EchoStar Corp[216.22%], Cooper-Standard [190.99%], Bloom Energy[186.778%] Best Smallcap Stocks This Week:
Office Properties[289.553%], Textainer Group[258.475%], United Community[163.439%], Lakeland Bancorp[147.684%], Dominion Midstream[118.502%], PDL BioPharma[112.645%], GTx [108.706%], Overseas Shipholding[77.0318%], Vimeo [74.4921%], PGT Innovations[65.2536%], Fuelcell Energy[62.716%] Best Smallcap Stocks Daily:
Office Properties[59.6227%], AVITA Medical[48.2456%], Monte Rosa[43.659%], Berry Corp[21.148%], AlloVir [16.9215%], GoPro [15.942%], Energy Fuels[15.8424%], Irobot Corp[15.4971%], Cara [14.3396%], Tyra Biosciences[14.26%], Zura Bio[13.71%]