
 Login Sign Up


| |||||
 |  | ||||

| 12Stocks.com Market Intelligence |
Best SmallCap Stocks
|
| In a hurry? Small Cap Stock Lists: Performance Trends Table, Stock Charts
Sort Small Cap stocks: Daily, Weekly, Year-to-Date, Market Cap & Trends. Filter Small Cap stocks list by sector: Show all, Tech, Finance, Energy, Staples, Retail, Industrial, Materials, Utilities and HealthCare Filter Small Cap stocks list by size: All Large Medium Small and MicroCap |
| 12Stocks.com Small Cap Stocks Performances & Trends Daily | |||||||||
|
|  The overall Smart Investing & Trading Score is 44 (0-bearish to 100-bullish) which puts Small Cap index in short term neutral trend. The Smart Investing & Trading Score from previous trading session is 58 and hence a deterioration of trend.
| ||||||||
Here are the Smart Investing & Trading Scores of the most requested small cap stocks at 12Stocks.com (click stock name for detailed review):
|


| 12Stocks.com: Investing in Smallcap Index with Stocks | |
|
The following table helps investors and traders sort through current performance and trends (as measured by Smart Investing & Trading Score) of various
stocks in the Smallcap Index. Quick View: Move mouse or cursor over stock symbol (ticker) to view short-term technical chart and over stock name to view long term chart. Click on  to add stock symbol to your watchlist and to add stock symbol to your watchlist and  to view watchlist. Click on any ticker or stock name for detailed market intelligence report for that stock. to view watchlist. Click on any ticker or stock name for detailed market intelligence report for that stock. |
12Stocks.com Performance of Stocks in Smallcap Index
| Ticker | Stock Name | Watchlist | Category | Recent Price | Smart Investing & Trading Score | Change % | YTD Change% |
| AMBC | Ambac Financial |   | Financials | 14.38 | 25 | -1.10% | -12.74% |
| ARR | ARMOUR Residential | | Financials | 18.21 | 42 | -2.78% | -5.75% |
| PFBC | Preferred Bank | | Financials | 77.47 | 93 | 0.75% | 6.05% |
| CAC | Camden National | | Financials | 30.69 | 52 | -1.03% | -18.44% |
| AHH | Armada Hoffler | | Financials | 10.50 | 50 | -0.38% | -15.12% |
| TRST | TrustCo Bank | | Financials | 27.06 | 47 | -0.88% | -12.85% |
| AGM | Federal Agricultural | | Financials | 189.09 | 88 | -0.65% | -1.11% |
| NFBK | Northfield Bancorp | | Financials | 8.29 | 42 | -7.68% | -34.10% |
| MBI | MBIA | | Financials | 6.33 | 100 | -3.80% | 3.43% |
| OFG | OFG Bancorp | | Financials | 36.46 | 69 | -1.38% | -2.72% |
| HMST | HomeStreet | | Financials | 12.23 | 20 | -0.33% | 18.74% |
| LBAI | Lakeland Bancorp | | Financials | 12.58 | 67 | -2.02% | -14.94% |
| NWLI | National Western | | Financials | 488.15 | 54 | -0.39% | 1.06% |
| GSBC | Great Southern | | Financials | 52.91 | 93 | -1.40% | -10.85% |
| CNOB | ConnectOne Bancorp | | Financials | 18.46 | 67 | -6.44% | -19.42% |
| WRLD | World Acceptance | | Financials | 137.01 | 73 | -0.52% | 4.96% |
| CIO | City Office | | Financials | 4.56 | 45 | -0.22% | -25.37% |
| DCOM | Dime Community | | Financials | 18.54 | 67 | -4.38% | -31.15% |
| CWH | Camping World | | Financials | 21.05 | 25 | -7.43% | -19.84% |
| UVSP | Univest Financial | | Financials | 20.55 | 74 | 2.75% | -6.72% |
| QCRH | QCR | | Financials | 57.54 | 12 | -1.76% | -1.46% |
| BANC | Banc of California | | Financials | 14.10 | 17 | 0.07% | 4.99% |
| FFWM | First Foundation | | Financials | 6.70 | 32 | -4.96% | -30.79% |
| HONE | HarborOne Bancorp | | Financials | 10.19 | 74 | 1.39% | -14.94% |
| PEBO | Peoples Bancorp | | Financials | 30.20 | 87 | 0.53% | -10.55% |
| For chart view version of above stock list: Chart View ➞ 0 - 25 , 25 - 50 , 50 - 75 , 75 - 100 , 100 - 125 , 125 - 150 , 150 - 175 , 175 - 200 , 200 - 225 , 225 - 250 , 250 - 275 , 275 - 300 , 300 - 325 , 325 - 350 , 350 - 375 , 375 - 400 | ||
 | Click To Change The Sort Order: By Market Cap or Company Size Performance: Year-to-date, Week and Day |  |
| Too many stocks? View smallcap stocks filtered by marketcap & sector |
| Marketcap: All SmallCap Stocks (default-no microcap), Large, Mid-Range, Small |
| Smallcap Sector: Tech, Finance, Energy, Staples, Retail, Industrial, Materials, & Medical |
|
Get the most comprehensive stock market coverage daily at 12Stocks.com ➞ Best Stocks Today ➞ Best Stocks Weekly ➞ Best Stocks Year-to-Date ➞ Best Stocks Trends ➞  Best Stocks Today 12Stocks.com Best Nasdaq Stocks ➞ Best S&P 500 Stocks ➞ Best Tech Stocks ➞ Best Biotech Stocks ➞ |
| Detailed Overview of SmallCap Stocks |
| SmallCap Technical Overview, Leaders & Laggards, Top SmallCap ETF Funds & Detailed SmallCap Stocks List, Charts, Trends & More |
| Smallcap: Technical Analysis, Trends & YTD Performance | |
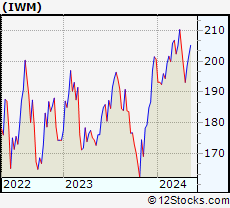
| SmallCap segment as represented by
IWM, an exchange-traded fund [ETF], holds basket of thousands of smallcap stocks from across all major sectors of the US stock market. The smallcap index (contains stocks like Riverbed & Sotheby's) is down by -2.11% and is currently underperforming the overall market by -7.27% year-to-date. Below is a quick view of technical charts and trends: | |
 IWM Weekly Chart |
|
| Long Term Trend: Good | |
| Medium Term Trend: Not Good | |
 IWM Daily Chart |
|
| Short Term Trend: Very Good | |
| Overall Trend Score: 44 | |
| YTD Performance: -2.11% | |
| **Trend Scores & Views Are Only For Educational Purposes And Not For Investing | |
| 12Stocks.com: Top Performing Small Cap Index Stocks | ||||||||||||||||||||||||||||||||||||||||||||||||
 The top performing Small Cap Index stocks year to date are
Now, more recently, over last week, the top performing Small Cap Index stocks on the move are


|
||||||||||||||||||||||||||||||||||||||||||||||||
| 12Stocks.com: Investing in Smallcap Index using Exchange Traded Funds | |
|
The following table shows list of key exchange traded funds (ETF) that
help investors track Smallcap index. The following list also includes leveraged ETF funds that track twice or thrice the daily returns of Smallcap indices. Short or inverse ETF funds move in the opposite direction to the index they track and are useful during market pullbacks or during bear markets. Quick View: Move mouse or cursor over ETF symbol (ticker) to view short-term technical chart and over ETF name to view long term chart. Click on ticker or stock name for detailed view. Click on to add stock symbol to your watchlist and to view watchlist. |
12Stocks.com List of ETFs that track Smallcap Index
| Ticker | ETF Name | Watchlist | Recent Price | Smart Investing & Trading Score | Change % | Week % | Year-to-date % |
| IWM | iShares Russell 2000 | | 196.48 | 44 | -0.61 | 1.73 | -2.11% |
| IJR | iShares Core S&P Small-Cap | | 104.86 | 78 | -0.80 | 1.59 | -3.13% |
| VTWO | Vanguard Russell 2000 ETF | | 79.45 | 63 | -0.60 | 1.75 | -2.03% |
| IWN | iShares Russell 2000 Value | | 150.18 | 68 | -0.73 | 1.62 | -3.32% |
| IWO | iShares Russell 2000 Growth | | 249.86 | 51 | -0.56 | 1.86 | -0.94% |
| IJS | iShares S&P Small-Cap 600 Value | | 96.69 | 60 | -1.04 | 1.13 | -6.19% |
| IJT | iShares S&P Small-Cap 600 Growth | | 125.06 | 63 | -0.25 | 2.33 | -0.06% |
| XSLV | PowerShares S&P SmallCap Low Volatil ETF | | 42.54 | 73 | -0.93 | 0.85 | -3.65% |
| SDD | ProShares UltraShort SmallCap600 | | 19.58 | 42 | 0.46 | -3.74 | 6.26% |
| SBB | ProShares Short SmallCap600 | | 16.50 | 40 | 0.79 | -2.02 | 3.58% |
| SMLV | SPDR SSGA US Small Cap Low Volatil ETF | | 107.33 | 73 | -1.01 | 1.17 | -4.61% |
| SAA | ProShares Ultra SmallCap600 | | 22.66 | 58 | -1.52 | 3.94 | -9.18% |
| 12Stocks.com: Charts, Trends, Fundamental Data and Performances of SmallCap Stocks | |
|
We now take in-depth look at all SmallCap stocks including charts, multi-period performances and overall trends (as measured by Smart Investing & Trading Score). One can sort SmallCap stocks (click link to choose) by Daily, Weekly and by Year-to-Date performances. Also, one can sort by size of the company or by market capitalization. |
| Select Your Default Chart Type: | |||||
| |||||
| Click on stock symbol or name for detailed view. Click on to add stock symbol to your watchlist and to view watchlist. Quick View: Move mouse or cursor over "Daily" to quickly view daily technical stock chart and over "Weekly" to view weekly technical stock chart. | |||||

 | AMBC Ambac Financial Group, Inc. |
| Sector: Financials | |
| SubSector: Surety & Title Insurance | |
| MarketCap: 587.818 Millions | |
| Recent Price: 14.38 Smart Investing & Trading Score: 25 | |
| Day Percent Change: -1.10% Day Change: -0.16 | |
| Week Change: -0.14% Year-to-date Change: -12.7% | |
| AMBC Links: Profile News Message Board | |
| Charts:- Daily , Weekly | |
| Add AMBC to Watchlist: View: Get Complete AMBC Trend Analysis ➞ | |
 | ARR ARMOUR Residential REIT, Inc. |
| Sector: Financials | |
| SubSector: Mortgage Investment | |
| MarketCap: 578.739 Millions | |
| Recent Price: 18.21 Smart Investing & Trading Score: 42 | |
| Day Percent Change: -2.78% Day Change: -0.52 | |
| Week Change: 0.22% Year-to-date Change: -5.8% | |
| ARR Links: Profile News Message Board | |
| Charts:- Daily , Weekly | |
| Add ARR to Watchlist: View: Get Complete ARR Trend Analysis ➞ | |
 | PFBC Preferred Bank |
| Sector: Financials | |
| SubSector: Regional - Pacific Banks | |
| MarketCap: 559.629 Millions | |
| Recent Price: 77.47 Smart Investing & Trading Score: 93 | |
| Day Percent Change: 0.75% Day Change: 0.58 | |
| Week Change: 4.27% Year-to-date Change: 6.1% | |
| PFBC Links: Profile News Message Board | |
| Charts:- Daily , Weekly | |
| Add PFBC to Watchlist: View: Get Complete PFBC Trend Analysis ➞ | |
 | CAC Camden National Corporation |
| Sector: Financials | |
| SubSector: Regional - Northeast Banks | |
| MarketCap: 550.999 Millions | |
| Recent Price: 30.69 Smart Investing & Trading Score: 52 | |
| Day Percent Change: -1.03% Day Change: -0.32 | |
| Week Change: 2.1% Year-to-date Change: -18.4% | |
| CAC Links: Profile News Message Board | |
| Charts:- Daily , Weekly | |
| Add CAC to Watchlist: View: Get Complete CAC Trend Analysis ➞ | |
 | AHH Armada Hoffler Properties, Inc. |
| Sector: Financials | |
| SubSector: REIT - Diversified | |
| MarketCap: 550.653 Millions | |
| Recent Price: 10.50 Smart Investing & Trading Score: 50 | |
| Day Percent Change: -0.38% Day Change: -0.04 | |
| Week Change: 0% Year-to-date Change: -15.1% | |
| AHH Links: Profile News Message Board | |
| Charts:- Daily , Weekly | |
| Add AHH to Watchlist: View: Get Complete AHH Trend Analysis ➞ | |
 | TRST TrustCo Bank Corp NY |
| Sector: Financials | |
| SubSector: Regional - Northeast Banks | |
| MarketCap: 543.999 Millions | |
| Recent Price: 27.06 Smart Investing & Trading Score: 47 | |
| Day Percent Change: -0.88% Day Change: -0.24 | |
| Week Change: 0.48% Year-to-date Change: -12.9% | |
| TRST Links: Profile News Message Board | |
| Charts:- Daily , Weekly | |
| Add TRST to Watchlist: View: Get Complete TRST Trend Analysis ➞ | |
 | AGM Federal Agricultural Mortgage Corporation |
| Sector: Financials | |
| SubSector: Credit Services | |
| MarketCap: 542.008 Millions | |
| Recent Price: 189.09 Smart Investing & Trading Score: 88 | |
| Day Percent Change: -0.65% Day Change: -1.24 | |
| Week Change: 3.19% Year-to-date Change: -1.1% | |
| AGM Links: Profile News Message Board | |
| Charts:- Daily , Weekly | |
| Add AGM to Watchlist: View: Get Complete AGM Trend Analysis ➞ | |
 | NFBK Northfield Bancorp, Inc. (Staten Island, NY) |
| Sector: Financials | |
| SubSector: Regional - Northeast Banks | |
| MarketCap: 540.699 Millions | |
| Recent Price: 8.29 Smart Investing & Trading Score: 42 | |
| Day Percent Change: -7.68% Day Change: -0.69 | |
| Week Change: -2.59% Year-to-date Change: -34.1% | |
| NFBK Links: Profile News Message Board | |
| Charts:- Daily , Weekly | |
| Add NFBK to Watchlist: View: Get Complete NFBK Trend Analysis ➞ | |
 | MBI MBIA Inc. |
| Sector: Financials | |
| SubSector: Property & Casualty Insurance | |
| MarketCap: 539.012 Millions | |
| Recent Price: 6.33 Smart Investing & Trading Score: 100 | |
| Day Percent Change: -3.80% Day Change: -0.25 | |
| Week Change: 3.43% Year-to-date Change: 3.4% | |
| MBI Links: Profile News Message Board | |
| Charts:- Daily , Weekly | |
| Add MBI to Watchlist: View: Get Complete MBI Trend Analysis ➞ | |
 | OFG OFG Bancorp |
| Sector: Financials | |
| SubSector: Money Center Banks | |
| MarketCap: 537.599 Millions | |
| Recent Price: 36.46 Smart Investing & Trading Score: 69 | |
| Day Percent Change: -1.38% Day Change: -0.51 | |
| Week Change: 4.71% Year-to-date Change: -2.7% | |
| OFG Links: Profile News Message Board | |
| Charts:- Daily , Weekly | |
| Add OFG to Watchlist: View: Get Complete OFG Trend Analysis ➞ | |
 | HMST HomeStreet, Inc. |
| Sector: Financials | |
| SubSector: Savings & Loans | |
| MarketCap: 535.33 Millions | |
| Recent Price: 12.23 Smart Investing & Trading Score: 20 | |
| Day Percent Change: -0.33% Day Change: -0.04 | |
| Week Change: -3.55% Year-to-date Change: 18.7% | |
| HMST Links: Profile News Message Board | |
| Charts:- Daily , Weekly | |
| Add HMST to Watchlist: View: Get Complete HMST Trend Analysis ➞ | |
 | LBAI Lakeland Bancorp, Inc. |
| Sector: Financials | |
| SubSector: Regional - Northeast Banks | |
| MarketCap: 534.599 Millions | |
| Recent Price: 12.58 Smart Investing & Trading Score: 67 | |
| Day Percent Change: -2.02% Day Change: -0.26 | |
| Week Change: 5.27% Year-to-date Change: -14.9% | |
| LBAI Links: Profile News Message Board | |
| Charts:- Daily , Weekly | |
| Add LBAI to Watchlist: View: Get Complete LBAI Trend Analysis ➞ | |
 | NWLI National Western Life Group, Inc. |
| Sector: Financials | |
| SubSector: Life Insurance | |
| MarketCap: 529 Millions | |
| Recent Price: 488.15 Smart Investing & Trading Score: 54 | |
| Day Percent Change: -0.39% Day Change: -1.90 | |
| Week Change: 0.13% Year-to-date Change: 1.1% | |
| NWLI Links: Profile News Message Board | |
| Charts:- Daily , Weekly | |
| Add NWLI to Watchlist: View: Get Complete NWLI Trend Analysis ➞ | |
 | GSBC Great Southern Bancorp, Inc. |
| Sector: Financials | |
| SubSector: Regional - Southwest Banks | |
| MarketCap: 524.765 Millions | |
| Recent Price: 52.91 Smart Investing & Trading Score: 93 | |
| Day Percent Change: -1.40% Day Change: -0.75 | |
| Week Change: 0.88% Year-to-date Change: -10.9% | |
| GSBC Links: Profile News Message Board | |
| Charts:- Daily , Weekly | |
| Add GSBC to Watchlist: View: Get Complete GSBC Trend Analysis ➞ | |
 | CNOB ConnectOne Bancorp, Inc. |
| Sector: Financials | |
| SubSector: Regional - Northeast Banks | |
| MarketCap: 491.899 Millions | |
| Recent Price: 18.46 Smart Investing & Trading Score: 67 | |
| Day Percent Change: -6.44% Day Change: -1.27 | |
| Week Change: -0.97% Year-to-date Change: -19.4% | |
| CNOB Links: Profile News Message Board | |
| Charts:- Daily , Weekly | |
| Add CNOB to Watchlist: View: Get Complete CNOB Trend Analysis ➞ | |
 | WRLD World Acceptance Corporation |
| Sector: Financials | |
| SubSector: Credit Services | |
| MarketCap: 486.408 Millions | |
| Recent Price: 137.01 Smart Investing & Trading Score: 73 | |
| Day Percent Change: -0.52% Day Change: -0.71 | |
| Week Change: 2.73% Year-to-date Change: 5.0% | |
| WRLD Links: Profile News Message Board | |
| Charts:- Daily , Weekly | |
| Add WRLD to Watchlist: View: Get Complete WRLD Trend Analysis ➞ | |
 | CIO City Office REIT, Inc. |
| Sector: Financials | |
| SubSector: REIT - Office | |
| MarketCap: 478.566 Millions | |
| Recent Price: 4.56 Smart Investing & Trading Score: 45 | |
| Day Percent Change: -0.22% Day Change: -0.01 | |
| Week Change: -0.22% Year-to-date Change: -25.4% | |
| CIO Links: Profile News Message Board | |
| Charts:- Daily , Weekly | |
| Add CIO to Watchlist: View: Get Complete CIO Trend Analysis ➞ | |
 | DCOM Dime Community Bancshares, Inc. |
| Sector: Financials | |
| SubSector: Savings & Loans | |
| MarketCap: 477.83 Millions | |
| Recent Price: 18.54 Smart Investing & Trading Score: 67 | |
| Day Percent Change: -4.38% Day Change: -0.85 | |
| Week Change: -0.75% Year-to-date Change: -31.2% | |
| DCOM Links: Profile News Message Board | |
| Charts:- Daily , Weekly | |
| Add DCOM to Watchlist: View: Get Complete DCOM Trend Analysis ➞ | |
 | CWH Camping World Holdings, Inc. |
| Sector: Financials | |
| SubSector: REIT - Office | |
| MarketCap: 473.566 Millions | |
| Recent Price: 21.05 Smart Investing & Trading Score: 25 | |
| Day Percent Change: -7.43% Day Change: -1.69 | |
| Week Change: -5.73% Year-to-date Change: -19.8% | |
| CWH Links: Profile News Message Board | |
| Charts:- Daily , Weekly | |
| Add CWH to Watchlist: View: Get Complete CWH Trend Analysis ➞ | |
 | UVSP Univest Financial Corporation |
| Sector: Financials | |
| SubSector: Regional - Northeast Banks | |
| MarketCap: 467.999 Millions | |
| Recent Price: 20.55 Smart Investing & Trading Score: 74 | |
| Day Percent Change: 2.75% Day Change: 0.55 | |
| Week Change: 5.71% Year-to-date Change: -6.7% | |
| UVSP Links: Profile News Message Board | |
| Charts:- Daily , Weekly | |
| Add UVSP to Watchlist: View: Get Complete UVSP Trend Analysis ➞ | |
 | QCRH QCR Holdings, Inc. |
| Sector: Financials | |
| SubSector: Regional - Southwest Banks | |
| MarketCap: 465.765 Millions | |
| Recent Price: 57.54 Smart Investing & Trading Score: 12 | |
| Day Percent Change: -1.76% Day Change: -1.03 | |
| Week Change: 0.31% Year-to-date Change: -1.5% | |
| QCRH Links: Profile News Message Board | |
| Charts:- Daily , Weekly | |
| Add QCRH to Watchlist: View: Get Complete QCRH Trend Analysis ➞ | |
 | BANC Banc of California, Inc. |
| Sector: Financials | |
| SubSector: Regional - Pacific Banks | |
| MarketCap: 459.929 Millions | |
| Recent Price: 14.10 Smart Investing & Trading Score: 17 | |
| Day Percent Change: 0.07% Day Change: 0.01 | |
| Week Change: 1.73% Year-to-date Change: 5.0% | |
| BANC Links: Profile News Message Board | |
| Charts:- Daily , Weekly | |
| Add BANC to Watchlist: View: Get Complete BANC Trend Analysis ➞ | |
 | FFWM First Foundation Inc. |
| Sector: Financials | |
| SubSector: Regional - Midwest Banks | |
| MarketCap: 457.17 Millions | |
| Recent Price: 6.70 Smart Investing & Trading Score: 32 | |
| Day Percent Change: -4.96% Day Change: -0.35 | |
| Week Change: -0.89% Year-to-date Change: -30.8% | |
| FFWM Links: Profile News Message Board | |
| Charts:- Daily , Weekly | |
| Add FFWM to Watchlist: View: Get Complete FFWM Trend Analysis ➞ | |
 | HONE HarborOne Bancorp, Inc. |
| Sector: Financials | |
| SubSector: Savings & Loans | |
| MarketCap: 456.03 Millions | |
| Recent Price: 10.19 Smart Investing & Trading Score: 74 | |
| Day Percent Change: 1.39% Day Change: 0.14 | |
| Week Change: 4.73% Year-to-date Change: -14.9% | |
| HONE Links: Profile News Message Board | |
| Charts:- Daily , Weekly | |
| Add HONE to Watchlist: View: Get Complete HONE Trend Analysis ➞ | |
 | PEBO Peoples Bancorp Inc. |
| Sector: Financials | |
| SubSector: Regional - Midwest Banks | |
| MarketCap: 449.77 Millions | |
| Recent Price: 30.20 Smart Investing & Trading Score: 87 | |
| Day Percent Change: 0.53% Day Change: 0.16 | |
| Week Change: 6% Year-to-date Change: -10.6% | |
| PEBO Links: Profile News Message Board | |
| Charts:- Daily , Weekly | |
| Add PEBO to Watchlist: View: Get Complete PEBO Trend Analysis ➞ | |
| For tabular summary view of above stock list: Summary View ➞ 0 - 25 , 25 - 50 , 50 - 75 , 75 - 100 , 100 - 125 , 125 - 150 , 150 - 175 , 175 - 200 , 200 - 225 , 225 - 250 , 250 - 275 , 275 - 300 , 300 - 325 , 325 - 350 , 350 - 375 , 375 - 400 | ||
| Click To Change The Sort Order: By Market Cap or Company Size Performance: Year-to-date, Week and Day | |
| Select Chart Type: | ||
| Too many stocks? View smallcap stocks filtered by marketcap & sector |
| Marketcap: All SmallCap Stocks (default-no microcap), Large, Mid-Range, Small & MicroCap |
| Sector: Tech, Finance, Energy, Staples, Retail, Industrial, Materials, Utilities & Medical |
|
Best Stocks Today 12Stocks.com |
© 2024 12Stocks.com Terms & Conditions Privacy Contact Us
All Information Provided Only For Education And Not To Be Used For Investing or Trading. See Terms & Conditions


One More Thing ... Get Best Stocks Delivered Daily!
Never Ever Miss A Move With Our Top Ten Stocks Lists
Find Best Stocks In Any Market - Bull or Bear Market
Take A Peek At Our Top Ten Stocks Lists: Daily, Weekly, Year-to-Date & Top Trends
Find Best Stocks In Any Market - Bull or Bear Market
Take A Peek At Our Top Ten Stocks Lists: Daily, Weekly, Year-to-Date & Top Trends
Smallcap Stocks With Best Up Trends [0-bearish to 100-bullish]: B. Riley[100], Central Pacific[100], California Water[100], Cricut [100], Carpenter [100], Haemonetics [100], Sanmina [100], Trustmark [100], Comstock Resources[100], EchoStar [100], Mueller Industries[100]
Best Smallcap Stocks Year-to-Date:
CareMax [490.72%], Janux [338.34%], Viking [270.02%], Alpine Immune[239.52%], Longboard [218%], Super Micro[177%], Arcutis Bio[166.56%], Avidity Biosciences[159.79%], Vera [149.94%], Hippo [128.87%], Stoke [122.15%] Best Smallcap Stocks This Week:
Matterport [168.97%], B. Riley[73.54%], Impinj [33.73%], ProKidney [32.84%], Seres [32.65%], Riot Blockchain[32.64%], Ribbon [25.58%], Cullinan Oncology[22.92%], P.A.M. Transportation[22.85%], NuScale Power[21.44%], Hibbett Sports[21.03%] Best Smallcap Stocks Daily:
Impinj [28.65%], P.A.M. Transportation[17.95%], B. Riley[16.61%], Strategic Education[16.28%], OptiNose [14.56%], JELD-WEN Holding[11.54%], Sonic Automotive[10.86%], Intevac [10.54%], SiTime [8.84%], Noodles & [8.08%], ProKidney [7.75%]