
 Login Sign Up


| |||||
 |  | ||||

| 12Stocks.com Market Intelligence |
Best SmallCap Stocks
|
| In a hurry? Small Cap Stock Lists: Performance Trends Table, Stock Charts
Sort Small Cap stocks: Daily, Weekly, Year-to-Date, Market Cap & Trends. Filter Small Cap stocks list by sector: Show all, Tech, Finance, Energy, Staples, Retail, Industrial, Materials, Utilities and HealthCare Filter Small Cap stocks list by size: All Large Medium Small and MicroCap |
| 12Stocks.com Small Cap Stocks Performances & Trends Daily | |||||||||
|
|  The overall Smart Investing & Trading Score is 42 (0-bearish to 100-bullish) which puts Small Cap index in short term neutral trend. The Smart Investing & Trading Score from previous trading session is 42 and hence an improvement of trend.
| ||||||||
Here are the Smart Investing & Trading Scores of the most requested small cap stocks at 12Stocks.com (click stock name for detailed review):
|


| 12Stocks.com: Investing in Smallcap Index with Stocks | |
|
The following table helps investors and traders sort through current performance and trends (as measured by Smart Investing & Trading Score) of various
stocks in the Smallcap Index. Quick View: Move mouse or cursor over stock symbol (ticker) to view short-term technical chart and over stock name to view long term chart. Click on  to add stock symbol to your watchlist and to add stock symbol to your watchlist and  to view watchlist. Click on any ticker or stock name for detailed market intelligence report for that stock. to view watchlist. Click on any ticker or stock name for detailed market intelligence report for that stock. |
12Stocks.com Performance of Stocks in Smallcap Index
| Ticker | Stock Name | Watchlist | Category | Recent Price | Smart Investing & Trading Score | Change % | YTD Change% |
| FBMS | First Bancshares |   | Financials | 24.20 | 52 | -0.70% | -17.49% |
| ESSA | ESSA Bancorp | | Financials | 16.50 | 0 | -1.20% | -17.58% |
| WNC | Wabash National | | Consumer Staples | 21.11 | 52 | -2.22% | -17.60% |
| RC | Ready Capital | | Financials | 8.44 | 50 | -1.52% | -17.66% |
| TCI | Transcontinental Realty | | Financials | 28.45 | 35 | 2.26% | -17.68% |
| LASR | nLIGHT | | Technology | 11.07 | 0 | -1.73% | -17.96% |
| NVEE | NV5 Global | | Services & Goods | 91.01 | 35 | -0.87% | -18.10% |
| GAMB | Gambling.com Group | | Services & Goods | 7.99 | 74 | 0.00% | -18.14% |
| METCB | Ramaco Resources | | Materials | 10.84 | 42 | 2.75% | -18.19% |
| NC | NACCO Industries | | Consumer Staples | 29.85 | 35 | 0.27% | -18.22% |
| THFF | First Financial | | Financials | 35.15 | 42 | -0.54% | -18.31% |
| HBNC | Horizon Bancorp | | Financials | 11.69 | 17 | -1.52% | -18.31% |
| CALX | Calix | | Technology | 35.57 | 88 | -0.31% | -18.59% |
| FNLC | First Bancorp | | Financials | 22.94 | 35 | -1.12% | -18.71% |
| TSBK | Timberland Bancorp | | Financials | 25.56 | 42 | -2.44% | -18.75% |
| OPTN | OptiNose | | Health Care | 1.04 | 10 | -2.34% | -18.99% |
| FMNB | Farmers National | | Financials | 11.70 | 10 | -0.93% | -19.03% |
| BZH | Beazer Homes | | Industrials | 27.31 | 18 | -2.78% | -19.18% |
| CUBI | Customers Bancorp | | Financials | 46.53 | 64 | -0.47% | -19.25% |
| AXL | American Axle | | Consumer Staples | 7.11 | 39 | -0.14% | -19.30% |
| SRI | Stoneridge | | Consumer Staples | 15.77 | 67 | 0.45% | -19.42% |
| VMD | Viemed Healthcare | | Health Care | 6.33 | 0 | -1.17% | -19.43% |
| KOS | Kosmos Energy | | Energy | 5.40 | 49 | -1.46% | -19.52% |
| GIII | G-III Apparel | | Consumer Staples | 27.28 | 47 | -3.30% | -19.72% |
| HAFC | Hanmi Financial | | Financials | 15.56 | 59 | -0.45% | -19.79% |
| For chart view version of above stock list: Chart View ➞ 0 - 25 , 25 - 50 , 50 - 75 , 75 - 100 , 100 - 125 , 125 - 150 , 150 - 175 , 175 - 200 , 200 - 225 , 225 - 250 , 250 - 275 , 275 - 300 , 300 - 325 , 325 - 350 , 350 - 375 , 375 - 400 , 400 - 425 , 425 - 450 , 450 - 475 , 475 - 500 , 500 - 525 | ||
 | Click To Change The Sort Order: By Market Cap or Company Size Performance: Year-to-date, Week and Day |  |
| Too many stocks? View smallcap stocks filtered by marketcap & sector |
| Marketcap: All SmallCap Stocks (default-no microcap), Large, Mid-Range, Small |
| Smallcap Sector: Tech, Finance, Energy, Staples, Retail, Industrial, Materials, & Medical |
|
Get the most comprehensive stock market coverage daily at 12Stocks.com ➞ Best Stocks Today ➞ Best Stocks Weekly ➞ Best Stocks Year-to-Date ➞ Best Stocks Trends ➞  Best Stocks Today 12Stocks.com Best Nasdaq Stocks ➞ Best S&P 500 Stocks ➞ Best Tech Stocks ➞ Best Biotech Stocks ➞ |
| Detailed Overview of SmallCap Stocks |
| SmallCap Technical Overview, Leaders & Laggards, Top SmallCap ETF Funds & Detailed SmallCap Stocks List, Charts, Trends & More |
| Smallcap: Technical Analysis, Trends & YTD Performance | |
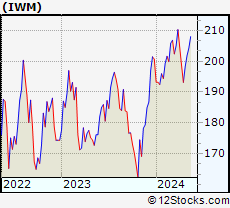
| SmallCap segment as represented by
IWM, an exchange-traded fund [ETF], holds basket of thousands of smallcap stocks from across all major sectors of the US stock market. The smallcap index (contains stocks like Riverbed & Sotheby's) is down by -0.07% and is currently underperforming the overall market by -13.36% year-to-date. Below is a quick view of technical charts and trends: | |
 IWM Weekly Chart |
|
| Long Term Trend: Not Good | |
| Medium Term Trend: Not Good | |
 IWM Daily Chart |
|
| Short Term Trend: Very Good | |
| Overall Trend Score: 42 | |
| YTD Performance: -0.07% | |
| **Trend Scores & Views Are Only For Educational Purposes And Not For Investing | |
| 12Stocks.com: Top Performing Small Cap Index Stocks | ||||||||||||||||||||||||||||||||||||||||||||||||
 The top performing Small Cap Index stocks year to date are
Now, more recently, over last week, the top performing Small Cap Index stocks on the move are


|
||||||||||||||||||||||||||||||||||||||||||||||||
| 12Stocks.com: Investing in Smallcap Index using Exchange Traded Funds | |
|
The following table shows list of key exchange traded funds (ETF) that
help investors track Smallcap index. The following list also includes leveraged ETF funds that track twice or thrice the daily returns of Smallcap indices. Short or inverse ETF funds move in the opposite direction to the index they track and are useful during market pullbacks or during bear markets. Quick View: Move mouse or cursor over ETF symbol (ticker) to view short-term technical chart and over ETF name to view long term chart. Click on ticker or stock name for detailed view. Click on to add stock symbol to your watchlist and to view watchlist. |
12Stocks.com List of ETFs that track Smallcap Index
| Ticker | ETF Name | Watchlist | Recent Price | Smart Investing & Trading Score | Change % | Week % | Year-to-date % |
| IWM | iShares Russell 2000 | | 200.56 | 42 | -0.31 | 0.1 | -0.07% |
| IJR | iShares Core S&P Small-Cap | | 105.25 | 25 | -0.86 | 0.02 | -2.77% |
| IWN | iShares Russell 2000 Value | | 150.09 | 25 | -0.68 | 0.25 | -3.37% |
| VTWO | Vanguard Russell 2000 ETF | | 81.33 | 42 | -0.31 | 0.12 | 0.28% |
| IWO | iShares Russell 2000 Growth | | 260.34 | 35 | 0.06 | 0.33 | 3.22% |
| IJS | iShares S&P Small-Cap 600 Value | | 95.88 | 25 | -1.19 | -0.31 | -6.98% |
| IJT | iShares S&P Small-Cap 600 Growth | | 126.91 | 25 | -0.45 | 0.06 | 1.41% |
| XSLV | PowerShares S&P SmallCap Low Volatil ETF | | 43.08 | 27 | -0.58 | -0.21 | -2.42% |
| SBB | ProShares Short SmallCap600 | | 16.61 | 81 | 1.34 | 0.44 | 4.27% |
| SMLV | SPDR SSGA US Small Cap Low Volatil ETF | | 107.14 | 15 | -0.92 | 0.15 | -4.78% |
| SAA | ProShares Ultra SmallCap600 | | 22.63 | 32 | -1.66 | -0.37 | -9.31% |
| SDD | ProShares UltraShort SmallCap600 | | 19.57 | 76 | 1.82 | 0.1 | 6.21% |
| 12Stocks.com: Charts, Trends, Fundamental Data and Performances of SmallCap Stocks | |
|
We now take in-depth look at all SmallCap stocks including charts, multi-period performances and overall trends (as measured by Smart Investing & Trading Score). One can sort SmallCap stocks (click link to choose) by Daily, Weekly and by Year-to-Date performances. Also, one can sort by size of the company or by market capitalization. |
| Select Your Default Chart Type: | |||||
| |||||
| Click on stock symbol or name for detailed view. Click on to add stock symbol to your watchlist and to view watchlist. Quick View: Move mouse or cursor over "Daily" to quickly view daily technical stock chart and over "Weekly" to view weekly technical stock chart. | |||||

 | FBMS The First Bancshares, Inc. |
| Sector: Financials | |
| SubSector: Regional - Southeast Banks | |
| MarketCap: 359.535 Millions | |
| Recent Price: 24.20 Smart Investing & Trading Score: 52 | |
| Day Percent Change: -0.70% Day Change: -0.17 | |
| Week Change: 1.04% Year-to-date Change: -17.5% | |
| FBMS Links: Profile News Message Board | |
| Charts:- Daily , Weekly | |
| Add FBMS to Watchlist: View: Get Complete FBMS Trend Analysis ➞ | |
 | ESSA ESSA Bancorp, Inc. |
| Sector: Financials | |
| SubSector: Savings & Loans | |
| MarketCap: 171.33 Millions | |
| Recent Price: 16.50 Smart Investing & Trading Score: 0 | |
| Day Percent Change: -1.20% Day Change: -0.20 | |
| Week Change: -1.9% Year-to-date Change: -17.6% | |
| ESSA Links: Profile News Message Board | |
| Charts:- Daily , Weekly | |
| Add ESSA to Watchlist: View: Get Complete ESSA Trend Analysis ➞ | |
 | WNC Wabash National Corporation |
| Sector: Consumer Staples | |
| SubSector: Trucks & Other Vehicles | |
| MarketCap: 482.597 Millions | |
| Recent Price: 21.11 Smart Investing & Trading Score: 52 | |
| Day Percent Change: -2.22% Day Change: -0.48 | |
| Week Change: 0.57% Year-to-date Change: -17.6% | |
| WNC Links: Profile News Message Board | |
| Charts:- Daily , Weekly | |
| Add WNC to Watchlist: View: Get Complete WNC Trend Analysis ➞ | |
 | RC Ready Capital Corporation |
| Sector: Financials | |
| SubSector: Mortgage Investment | |
| MarketCap: 358.039 Millions | |
| Recent Price: 8.44 Smart Investing & Trading Score: 50 | |
| Day Percent Change: -1.52% Day Change: -0.13 | |
| Week Change: -0.35% Year-to-date Change: -17.7% | |
| RC Links: Profile News Message Board | |
| Charts:- Daily , Weekly | |
| Add RC to Watchlist: View: Get Complete RC Trend Analysis ➞ | |
 | TCI Transcontinental Realty Investors, Inc. |
| Sector: Financials | |
| SubSector: REIT - Diversified | |
| MarketCap: 158.653 Millions | |
| Recent Price: 28.45 Smart Investing & Trading Score: 35 | |
| Day Percent Change: 2.26% Day Change: 0.63 | |
| Week Change: -1.04% Year-to-date Change: -17.7% | |
| TCI Links: Profile News Message Board | |
| Charts:- Daily , Weekly | |
| Add TCI to Watchlist: View: Get Complete TCI Trend Analysis ➞ | |
 | LASR nLIGHT, Inc. |
| Sector: Technology | |
| SubSector: Semiconductor - Broad Line | |
| MarketCap: 445.642 Millions | |
| Recent Price: 11.07 Smart Investing & Trading Score: 0 | |
| Day Percent Change: -1.73% Day Change: -0.20 | |
| Week Change: -7.17% Year-to-date Change: -18.0% | |
| LASR Links: Profile News Message Board | |
| Charts:- Daily , Weekly | |
| Add LASR to Watchlist: View: Get Complete LASR Trend Analysis ➞ | |
 | NVEE NV5 Global, Inc. |
| Sector: Services & Goods | |
| SubSector: Technical Services | |
| MarketCap: 484.91 Millions | |
| Recent Price: 91.01 Smart Investing & Trading Score: 35 | |
| Day Percent Change: -0.87% Day Change: -0.80 | |
| Week Change: -1.46% Year-to-date Change: -18.1% | |
| NVEE Links: Profile News Message Board | |
| Charts:- Daily , Weekly | |
| Add NVEE to Watchlist: View: Get Complete NVEE Trend Analysis ➞ | |
 | GAMB Gambling.com Group Limited |
| Sector: Services & Goods | |
| SubSector: Gambling | |
| MarketCap: 376 Millions | |
| Recent Price: 7.99 Smart Investing & Trading Score: 74 | |
| Day Percent Change: 0.00% Day Change: 0.00 | |
| Week Change: -0.25% Year-to-date Change: -18.1% | |
| GAMB Links: Profile News Message Board | |
| Charts:- Daily , Weekly | |
| Add GAMB to Watchlist: View: Get Complete GAMB Trend Analysis ➞ | |
 | METCB Ramaco Resources, Inc. |
| Sector: Materials | |
| SubSector: Coking Coal | |
| MarketCap: 469 Millions | |
| Recent Price: 10.84 Smart Investing & Trading Score: 42 | |
| Day Percent Change: 2.75% Day Change: 0.29 | |
| Week Change: 2.26% Year-to-date Change: -18.2% | |
| METCB Links: Profile News Message Board | |
| Charts:- Daily , Weekly | |
| Add METCB to Watchlist: View: Get Complete METCB Trend Analysis ➞ | |
 | NC NACCO Industries, Inc. |
| Sector: Consumer Staples | |
| SubSector: Home Furnishings & Fixtures | |
| MarketCap: 179.835 Millions | |
| Recent Price: 29.85 Smart Investing & Trading Score: 35 | |
| Day Percent Change: 0.27% Day Change: 0.08 | |
| Week Change: 0.13% Year-to-date Change: -18.2% | |
| NC Links: Profile News Message Board | |
| Charts:- Daily , Weekly | |
| Add NC to Watchlist: View: Get Complete NC Trend Analysis ➞ | |
 | THFF First Financial Corporation |
| Sector: Financials | |
| SubSector: Regional - Midwest Banks | |
| MarketCap: 433.07 Millions | |
| Recent Price: 35.15 Smart Investing & Trading Score: 42 | |
| Day Percent Change: -0.54% Day Change: -0.19 | |
| Week Change: 0.89% Year-to-date Change: -18.3% | |
| THFF Links: Profile News Message Board | |
| Charts:- Daily , Weekly | |
| Add THFF to Watchlist: View: Get Complete THFF Trend Analysis ➞ | |
 | HBNC Horizon Bancorp, Inc. |
| Sector: Financials | |
| SubSector: Regional - Northeast Banks | |
| MarketCap: 405.999 Millions | |
| Recent Price: 11.69 Smart Investing & Trading Score: 17 | |
| Day Percent Change: -1.52% Day Change: -0.18 | |
| Week Change: -0.51% Year-to-date Change: -18.3% | |
| HBNC Links: Profile News Message Board | |
| Charts:- Daily , Weekly | |
| Add HBNC to Watchlist: View: Get Complete HBNC Trend Analysis ➞ | |
 | CALX Calix, Inc. |
| Sector: Technology | |
| SubSector: Communication Equipment | |
| MarketCap: 390.039 Millions | |
| Recent Price: 35.57 Smart Investing & Trading Score: 88 | |
| Day Percent Change: -0.31% Day Change: -0.11 | |
| Week Change: 1.63% Year-to-date Change: -18.6% | |
| CALX Links: Profile News Message Board | |
| Charts:- Daily , Weekly | |
| Add CALX to Watchlist: View: Get Complete CALX Trend Analysis ➞ | |
 | FNLC The First Bancorp, Inc. |
| Sector: Financials | |
| SubSector: Regional - Northeast Banks | |
| MarketCap: 264.799 Millions | |
| Recent Price: 22.94 Smart Investing & Trading Score: 35 | |
| Day Percent Change: -1.12% Day Change: -0.26 | |
| Week Change: 1.01% Year-to-date Change: -18.7% | |
| FNLC Links: Profile News Message Board | |
| Charts:- Daily , Weekly | |
| Add FNLC to Watchlist: View: Get Complete FNLC Trend Analysis ➞ | |
 | TSBK Timberland Bancorp, Inc. |
| Sector: Financials | |
| SubSector: Savings & Loans | |
| MarketCap: 155.03 Millions | |
| Recent Price: 25.56 Smart Investing & Trading Score: 42 | |
| Day Percent Change: -2.44% Day Change: -0.64 | |
| Week Change: -2.59% Year-to-date Change: -18.8% | |
| TSBK Links: Profile News Message Board | |
| Charts:- Daily , Weekly | |
| Add TSBK to Watchlist: View: Get Complete TSBK Trend Analysis ➞ | |
 | OPTN OptiNose, Inc. |
| Sector: Health Care | |
| SubSector: Drugs - Generic | |
| MarketCap: 183.385 Millions | |
| Recent Price: 1.04 Smart Investing & Trading Score: 10 | |
| Day Percent Change: -2.34% Day Change: -0.03 | |
| Week Change: -4.13% Year-to-date Change: -19.0% | |
| OPTN Links: Profile News Message Board | |
| Charts:- Daily , Weekly | |
| Add OPTN to Watchlist: View: Get Complete OPTN Trend Analysis ➞ | |
 | FMNB Farmers National Banc Corp. |
| Sector: Financials | |
| SubSector: Regional - Midwest Banks | |
| MarketCap: 366.57 Millions | |
| Recent Price: 11.70 Smart Investing & Trading Score: 10 | |
| Day Percent Change: -0.93% Day Change: -0.11 | |
| Week Change: -0.34% Year-to-date Change: -19.0% | |
| FMNB Links: Profile News Message Board | |
| Charts:- Daily , Weekly | |
| Add FMNB to Watchlist: View: Get Complete FMNB Trend Analysis ➞ | |
 | BZH Beazer Homes USA, Inc. |
| Sector: Industrials | |
| SubSector: Residential Construction | |
| MarketCap: 180.106 Millions | |
| Recent Price: 27.31 Smart Investing & Trading Score: 18 | |
| Day Percent Change: -2.78% Day Change: -0.78 | |
| Week Change: -1.05% Year-to-date Change: -19.2% | |
| BZH Links: Profile News Message Board | |
| Charts:- Daily , Weekly | |
| Add BZH to Watchlist: View: Get Complete BZH Trend Analysis ➞ | |
 | CUBI Customers Bancorp, Inc. |
| Sector: Financials | |
| SubSector: Regional - Northeast Banks | |
| MarketCap: 385.399 Millions | |
| Recent Price: 46.53 Smart Investing & Trading Score: 64 | |
| Day Percent Change: -0.47% Day Change: -0.22 | |
| Week Change: 2.44% Year-to-date Change: -19.3% | |
| CUBI Links: Profile News Message Board | |
| Charts:- Daily , Weekly | |
| Add CUBI to Watchlist: View: Get Complete CUBI Trend Analysis ➞ | |
 | AXL American Axle & Manufacturing Holdings, Inc. |
| Sector: Consumer Staples | |
| SubSector: Auto Parts | |
| MarketCap: 407.139 Millions | |
| Recent Price: 7.11 Smart Investing & Trading Score: 39 | |
| Day Percent Change: -0.14% Day Change: -0.01 | |
| Week Change: 2.75% Year-to-date Change: -19.3% | |
| AXL Links: Profile News Message Board | |
| Charts:- Daily , Weekly | |
| Add AXL to Watchlist: View: Get Complete AXL Trend Analysis ➞ | |
 | SRI Stoneridge, Inc. |
| Sector: Consumer Staples | |
| SubSector: Auto Parts | |
| MarketCap: 451.839 Millions | |
| Recent Price: 15.77 Smart Investing & Trading Score: 67 | |
| Day Percent Change: 0.45% Day Change: 0.07 | |
| Week Change: 0.9% Year-to-date Change: -19.4% | |
| SRI Links: Profile News Message Board | |
| Charts:- Daily , Weekly | |
| Add SRI to Watchlist: View: Get Complete SRI Trend Analysis ➞ | |
 | VMD Viemed Healthcare, Inc. |
| Sector: Health Care | |
| SubSector: Medical Appliances & Equipment | |
| MarketCap: 177.28 Millions | |
| Recent Price: 6.33 Smart Investing & Trading Score: 0 | |
| Day Percent Change: -1.17% Day Change: -0.08 | |
| Week Change: -4.17% Year-to-date Change: -19.4% | |
| VMD Links: Profile News Message Board | |
| Charts:- Daily , Weekly | |
| Add VMD to Watchlist: View: Get Complete VMD Trend Analysis ➞ | |
 | KOS Kosmos Energy Ltd. |
| Sector: Energy | |
| SubSector: Independent Oil & Gas | |
| MarketCap: 261.693 Millions | |
| Recent Price: 5.40 Smart Investing & Trading Score: 49 | |
| Day Percent Change: -1.46% Day Change: -0.08 | |
| Week Change: 2.27% Year-to-date Change: -19.5% | |
| KOS Links: Profile News Message Board | |
| Charts:- Daily , Weekly | |
| Add KOS to Watchlist: View: Get Complete KOS Trend Analysis ➞ | |
 | GIII G-III Apparel Group, Ltd. |
| Sector: Consumer Staples | |
| SubSector: Textile - Apparel Clothing | |
| MarketCap: 354.365 Millions | |
| Recent Price: 27.28 Smart Investing & Trading Score: 47 | |
| Day Percent Change: -3.30% Day Change: -0.93 | |
| Week Change: -2.05% Year-to-date Change: -19.7% | |
| GIII Links: Profile News Message Board | |
| Charts:- Daily , Weekly | |
| Add GIII to Watchlist: View: Get Complete GIII Trend Analysis ➞ | |
 | HAFC Hanmi Financial Corporation |
| Sector: Financials | |
| SubSector: Regional - Pacific Banks | |
| MarketCap: 319.929 Millions | |
| Recent Price: 15.56 Smart Investing & Trading Score: 59 | |
| Day Percent Change: -0.45% Day Change: -0.07 | |
| Week Change: 1.3% Year-to-date Change: -19.8% | |
| HAFC Links: Profile News Message Board | |
| Charts:- Daily , Weekly | |
| Add HAFC to Watchlist: View: Get Complete HAFC Trend Analysis ➞ | |
| For tabular summary view of above stock list: Summary View ➞ 0 - 25 , 25 - 50 , 50 - 75 , 75 - 100 , 100 - 125 , 125 - 150 , 150 - 175 , 175 - 200 , 200 - 225 , 225 - 250 , 250 - 275 , 275 - 300 , 300 - 325 , 325 - 350 , 350 - 375 , 375 - 400 , 400 - 425 , 425 - 450 , 450 - 475 , 475 - 500 , 500 - 525 | ||
| Click To Change The Sort Order: By Market Cap or Company Size Performance: Year-to-date, Week and Day | |
| Select Chart Type: | ||
| Too many stocks? View smallcap stocks filtered by marketcap & sector |
| Marketcap: All SmallCap Stocks (default-no microcap), Large, Mid-Range, Small & MicroCap |
| Sector: Tech, Finance, Energy, Staples, Retail, Industrial, Materials, Utilities & Medical |
|
Best Stocks Today 12Stocks.com |
© 2024 12Stocks.com Terms & Conditions Privacy Contact Us
All Information Provided Only For Education And Not To Be Used For Investing or Trading. See Terms & Conditions


One More Thing ... Get Best Stocks Delivered Daily!
Never Ever Miss A Move With Our Top Ten Stocks Lists
Find Best Stocks In Any Market - Bull or Bear Market
Take A Peek At Our Top Ten Stocks Lists: Daily, Weekly, Year-to-Date & Top Trends
Find Best Stocks In Any Market - Bull or Bear Market
Take A Peek At Our Top Ten Stocks Lists: Daily, Weekly, Year-to-Date & Top Trends
Smallcap Stocks With Best Up Trends [0-bearish to 100-bullish]: Enovix [100], Tellurian [100], Brightcove [100], NuScale Power[100], Fortress Transportation[100], Carvana Co[100], Repro Med[100], Eos Energy[100], Torrid [100], BRC [100], Ispire [100]
Best Smallcap Stocks Year-to-Date:
Dominion Midstream[461.92%], Workhorse Group[377.78%], 2U [352.85%], Avidity Biosciences[349.23%], CareMax [291.75%], Janux [285.95%], Virgin Galactic[255.51%], NuScale Power[240.16%], Longboard [232.9%], Summit [206.9%], Arcutis Bio[196.75%] Best Smallcap Stocks This Week:
Enovix [35.5%], Eos Energy[28.52%], Tellurian [27.2%], RXO [22.76%], Cara [19.57%], Brightcove [18.32%], Morphic Holding[17.81%], PDS [17.8%], ZimVie [17.17%], BARK [16.08%], Lindblad Expeditions[15.98%] Best Smallcap Stocks Daily:
Enovix [35.05%], ZimVie [22.72%], BARK [13.70%], KVH Industries[13.02%], Tellurian [10.75%], Brightcove [10.65%], DHI Group[9.81%], NuScale Power[9.48%], MicroStrategy [9.01%], Fortress Transportation[8.95%], Lindblad Expeditions[8.80%]