
 Login Sign Up


| |||||
 |  | ||||

| 12Stocks.com Market Intelligence |
Best SmallCap Stocks
|
| In a hurry? Small Cap Stock Lists: Performance Trends Table, Stock Charts
Sort Small Cap stocks: Daily, Weekly, Year-to-Date, Market Cap & Trends. Filter Small Cap stocks list by sector: Show all, Tech, Finance, Energy, Staples, Retail, Industrial, Materials, Utilities and HealthCare Filter Small Cap stocks list by size: All Large Medium Small and MicroCap |
| 12Stocks.com Small Cap Stocks Performances & Trends Daily | |||||||||
|
|  The overall Smart Investing & Trading Score is 76 (0-bearish to 100-bullish) which puts Small Cap index in short term neutral to bullish trend. The Smart Investing & Trading Score from previous trading session is 83 and hence a deterioration of trend.
| ||||||||
Here are the Smart Investing & Trading Scores of the most requested small cap stocks at 12Stocks.com (click stock name for detailed review):
|


| 12Stocks.com: Investing in Smallcap Index with Stocks | |
|
The following table helps investors and traders sort through current performance and trends (as measured by Smart Investing & Trading Score) of various
stocks in the Smallcap Index. Quick View: Move mouse or cursor over stock symbol (ticker) to view short-term technical chart and over stock name to view long term chart. Click on  to add stock symbol to your watchlist and to add stock symbol to your watchlist and  to view watchlist. Click on any ticker or stock name for detailed market intelligence report for that stock. to view watchlist. Click on any ticker or stock name for detailed market intelligence report for that stock. |
12Stocks.com Performance of Stocks in Smallcap Index
| Ticker | Stock Name | Watchlist | Category | Recent Price | Smart Investing & Trading Score | Change % | YTD Change% |
| FORR | Forrester Research |   | Services & Goods | 18.30 | 28 | -2.76% | -31.74% |
| HZO | MarineMax | | Services & Goods | 26.49 | 25 | -2.21% | -31.90% |
| RLYB | Rallybio | | Health Care | 1.61 | 10 | 0.94% | -31.99% |
| IKNA | Ikena Oncology | | Health Care | 1.36 | 32 | -2.86% | -32.00% |
| BTAI | BioXcel | | Health Care | 2.00 | 20 | -4.76% | -32.20% |
| DENN | Denny s | | Services & Goods | 7.37 | 0 | -4.78% | -32.26% |
| RYI | Ryerson Holding | | Industrials | 23.44 | 49 | -0.47% | -32.41% |
| RYI | Ryerson Holding | | Industrials | 9.45 | 49 | 0.64% | -32.41% |
| ORGO | Organogenesis | | Health Care | 2.75 | 30 | -0.54% | -32.64% |
| III | Information Services | | Technology | 3.17 | 49 | 0.63% | -32.70% |
| ACRE | Ares Commercial | | Financials | 6.96 | 67 | 0.43% | -32.82% |
| HOFT | Hooker Furniture | | Consumer Staples | 17.48 | 18 | -1.69% | -32.98% |
| SIBN | SI-BONE | | Health Care | 14.06 | 10 | -2.36% | -33.02% |
| REPL | Replimune Group | | Health Care | 5.57 | 10 | -6.23% | -33.93% |
| GWH | ESS Tech | | Industrials | 0.76 | 25 | -6.63% | -33.95% |
| EVRI | Everi | | Services & Goods | 7.43 | 20 | 0.00% | -34.07% |
| SRRK | Scholar Rock | | Health Care | 12.29 | 0 | -1.84% | -34.63% |
| ONL | Orion Office | | Financials | 3.73 | 75 | 1.08% | -34.79% |
| NDLS | Noodles & | | Services & Goods | 2.05 | 35 | -2.84% | -34.92% |
| MCRB | Seres | | Health Care | 0.91 | 15 | -4.10% | -34.99% |
| EXTR | Extreme s | | Technology | 11.44 | 42 | -1.55% | -35.15% |
| CLNE | Clean Energy | | Utilities | 2.48 | 42 | -1.20% | -35.25% |
| FFWM | First Foundation | | Financials | 6.25 | 69 | -2.50% | -35.43% |
| OPFI | OppFi | | Financials | 3.28 | 64 | 1.55% | -35.81% |
| XPEL | XPEL | | Consumer Staples | 34.44 | 40 | 0.44% | -36.04% |
| For chart view version of above stock list: Chart View ➞ 0 - 25 , 25 - 50 , 50 - 75 , 75 - 100 , 100 - 125 , 125 - 150 , 150 - 175 , 175 - 200 , 200 - 225 , 225 - 250 , 250 - 275 , 275 - 300 , 300 - 325 , 325 - 350 , 350 - 375 , 375 - 400 , 400 - 425 , 425 - 450 , 450 - 475 , 475 - 500 , 500 - 525 | ||
 | Click To Change The Sort Order: By Market Cap or Company Size Performance: Year-to-date, Week and Day |  |
| Too many stocks? View smallcap stocks filtered by marketcap & sector |
| Marketcap: All SmallCap Stocks (default-no microcap), Large, Mid-Range, Small |
| Smallcap Sector: Tech, Finance, Energy, Staples, Retail, Industrial, Materials, & Medical |
|
Get the most comprehensive stock market coverage daily at 12Stocks.com ➞ Best Stocks Today ➞ Best Stocks Weekly ➞ Best Stocks Year-to-Date ➞ Best Stocks Trends ➞  Best Stocks Today 12Stocks.com Best Nasdaq Stocks ➞ Best S&P 500 Stocks ➞ Best Tech Stocks ➞ Best Biotech Stocks ➞ |
| Detailed Overview of SmallCap Stocks |
| SmallCap Technical Overview, Leaders & Laggards, Top SmallCap ETF Funds & Detailed SmallCap Stocks List, Charts, Trends & More |
| Smallcap: Technical Analysis, Trends & YTD Performance | |
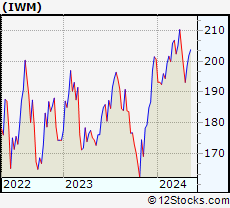
| SmallCap segment as represented by
IWM, an exchange-traded fund [ETF], holds basket of thousands of smallcap stocks from across all major sectors of the US stock market. The smallcap index (contains stocks like Riverbed & Sotheby's) is up by 3.8% and is currently underperforming the overall market by -7.11% year-to-date. Below is a quick view of technical charts and trends: | |
 IWM Weekly Chart |
|
| Long Term Trend: Very Good | |
| Medium Term Trend: Very Good | |
 IWM Daily Chart |
|
| Short Term Trend: Good | |
| Overall Trend Score: 76 | |
| YTD Performance: 3.8% | |
| **Trend Scores & Views Are Only For Educational Purposes And Not For Investing | |
| 12Stocks.com: Top Performing Small Cap Index Stocks | ||||||||||||||||||||||||||||||||||||||||||||||||
 The top performing Small Cap Index stocks year to date are
Now, more recently, over last week, the top performing Small Cap Index stocks on the move are


|
||||||||||||||||||||||||||||||||||||||||||||||||
| 12Stocks.com: Investing in Smallcap Index using Exchange Traded Funds | |
|
The following table shows list of key exchange traded funds (ETF) that
help investors track Smallcap index. The following list also includes leveraged ETF funds that track twice or thrice the daily returns of Smallcap indices. Short or inverse ETF funds move in the opposite direction to the index they track and are useful during market pullbacks or during bear markets. Quick View: Move mouse or cursor over ETF symbol (ticker) to view short-term technical chart and over ETF name to view long term chart. Click on ticker or stock name for detailed view. Click on to add stock symbol to your watchlist and to view watchlist. |
12Stocks.com List of ETFs that track Smallcap Index
| Ticker | ETF Name | Watchlist | Recent Price | Smart Investing & Trading Score | Change % | Week % | Year-to-date % |
| IWM | iShares Russell 2000 | | 208.34 | 76 | -0.10 | 0.12 | 3.8% |
| IJR | iShares Core S&P Small-Cap | | 110.16 | 69 | -0.05 | -0.21 | 1.76% |
| IWN | iShares Russell 2000 Value | | 158.12 | 69 | -0.04 | -0.37 | 1.8% |
| VTWO | Vanguard Russell 2000 ETF | | 84.24 | 56 | -0.13 | 0.15 | 3.87% |
| IWO | iShares Russell 2000 Growth | | 266.77 | 69 | -0.22 | 0.61 | 5.77% |
| IJS | iShares S&P Small-Cap 600 Value | | 101.19 | 48 | -0.01 | -0.67 | -1.82% |
| IJT | iShares S&P Small-Cap 600 Growth | | 131.71 | 73 | -0.04 | 0.28 | 5.25% |
| XSLV | PowerShares S&P SmallCap Low Volatil ETF | | 44.29 | 66 | -0.05 | -0.42 | 0.32% |
| SMLV | SPDR SSGA US Small Cap Low Volatil ETF | | 112.11 | 69 | -0.79 | -1.03 | -0.36% |
| SDD | ProShares UltraShort SmallCap600 | | 17.96 | 42 | 1.30 | 0.68 | -2.53% |
| SAA | ProShares Ultra SmallCap600 | | 24.71 | 64 | -1.55 | -0.78 | -0.96% |
| SBB | ProShares Short SmallCap600 | | 15.83 | 32 | 0.70 | 0.36 | -0.63% |
| 12Stocks.com: Charts, Trends, Fundamental Data and Performances of SmallCap Stocks | |
|
We now take in-depth look at all SmallCap stocks including charts, multi-period performances and overall trends (as measured by Smart Investing & Trading Score). One can sort SmallCap stocks (click link to choose) by Daily, Weekly and by Year-to-Date performances. Also, one can sort by size of the company or by market capitalization. |
| Select Your Default Chart Type: | |||||
| |||||
| Click on stock symbol or name for detailed view. Click on to add stock symbol to your watchlist and to view watchlist. Quick View: Move mouse or cursor over "Daily" to quickly view daily technical stock chart and over "Weekly" to view weekly technical stock chart. | |||||

 | FORR Forrester Research, Inc. |
| Sector: Services & Goods | |
| SubSector: Research Services | |
| MarketCap: 473.394 Millions | |
| Recent Price: 18.30 Smart Investing & Trading Score: 28 | |
| Day Percent Change: -2.76% Day Change: -0.52 | |
| Week Change: -2.76% Year-to-date Change: -31.7% | |
| FORR Links: Profile News Message Board | |
| Charts:- Daily , Weekly | |
| Add FORR to Watchlist: View: Get Complete FORR Trend Analysis ➞ | |
 | HZO MarineMax, Inc. |
| Sector: Services & Goods | |
| SubSector: Specialty Retail, Other | |
| MarketCap: 234.744 Millions | |
| Recent Price: 26.49 Smart Investing & Trading Score: 25 | |
| Day Percent Change: -2.21% Day Change: -0.60 | |
| Week Change: -6.2% Year-to-date Change: -31.9% | |
| HZO Links: Profile News Message Board | |
| Charts:- Daily , Weekly | |
| Add HZO to Watchlist: View: Get Complete HZO Trend Analysis ➞ | |
 | RLYB Rallybio Corporation |
| Sector: Health Care | |
| SubSector: Biotechnology | |
| MarketCap: 226 Millions | |
| Recent Price: 1.61 Smart Investing & Trading Score: 10 | |
| Day Percent Change: 0.94% Day Change: 0.01 | |
| Week Change: -9.32% Year-to-date Change: -32.0% | |
| RLYB Links: Profile News Message Board | |
| Charts:- Daily , Weekly | |
| Add RLYB to Watchlist: View: Get Complete RLYB Trend Analysis ➞ | |
 | IKNA Ikena Oncology, Inc. |
| Sector: Health Care | |
| SubSector: Biotechnology | |
| MarketCap: 277 Millions | |
| Recent Price: 1.36 Smart Investing & Trading Score: 32 | |
| Day Percent Change: -2.86% Day Change: -0.04 | |
| Week Change: -4.9% Year-to-date Change: -32.0% | |
| IKNA Links: Profile News Message Board | |
| Charts:- Daily , Weekly | |
| Add IKNA to Watchlist: View: Get Complete IKNA Trend Analysis ➞ | |
 | BTAI BioXcel Therapeutics, Inc. |
| Sector: Health Care | |
| SubSector: Biotechnology | |
| MarketCap: 487.485 Millions | |
| Recent Price: 2.00 Smart Investing & Trading Score: 20 | |
| Day Percent Change: -4.76% Day Change: -0.10 | |
| Week Change: -3.38% Year-to-date Change: -32.2% | |
| BTAI Links: Profile News Message Board | |
| Charts:- Daily , Weekly | |
| Add BTAI to Watchlist: View: Get Complete BTAI Trend Analysis ➞ | |
 | DENN Denny s Corporation |
| Sector: Services & Goods | |
| SubSector: Restaurants | |
| MarketCap: 367.47 Millions | |
| Recent Price: 7.37 Smart Investing & Trading Score: 0 | |
| Day Percent Change: -4.78% Day Change: -0.37 | |
| Week Change: -5.39% Year-to-date Change: -32.3% | |
| DENN Links: Profile News Message Board | |
| Charts:- Daily , Weekly | |
| Add DENN to Watchlist: View: Get Complete DENN Trend Analysis ➞ | |
 | RYI Ryerson Holding Corporation |
| Sector: Industrials | |
| SubSector: Metal Fabrication | |
| MarketCap: 202.55 Millions | |
| Recent Price: 23.44 Smart Investing & Trading Score: 49 | |
| Day Percent Change: -0.47% Day Change: -0.11 | |
| Week Change: 2.14% Year-to-date Change: -32.4% | |
| RYI Links: Profile News Message Board | |
| Charts:- Daily , Weekly | |
| Add RYI to Watchlist: View: Get Complete RYI Trend Analysis ➞ | |
| RYI Ryerson Holding Corporation |
| Sector: Industrials | |
| SubSector: Metal Fabrication | |
| MarketCap: 202.55 Millions | |
| Recent Price: 9.45 Smart Investing & Trading Score: 49 | |
| Day Percent Change: 0.64% Day Change: 0.06 | |
| Week Change: 2.14% Year-to-date Change: -32.4% | |
| RYI Links: Profile News Message Board | |
| Charts:- Daily , Weekly | |
| Add RYI to Watchlist: View: Get Complete RYI Trend Analysis ➞ | |
 | ORGO Organogenesis Holdings Inc. |
| Sector: Health Care | |
| SubSector: Drugs - Generic | |
| MarketCap: 239.685 Millions | |
| Recent Price: 2.75 Smart Investing & Trading Score: 30 | |
| Day Percent Change: -0.54% Day Change: -0.02 | |
| Week Change: 0.55% Year-to-date Change: -32.6% | |
| ORGO Links: Profile News Message Board | |
| Charts:- Daily , Weekly | |
| Add ORGO to Watchlist: View: Get Complete ORGO Trend Analysis ➞ | |
 | III Information Services Group, Inc. |
| Sector: Technology | |
| SubSector: Information Technology Services | |
| MarketCap: 166.968 Millions | |
| Recent Price: 3.17 Smart Investing & Trading Score: 49 | |
| Day Percent Change: 0.63% Day Change: 0.02 | |
| Week Change: 0.32% Year-to-date Change: -32.7% | |
| III Links: Profile News Message Board | |
| Charts:- Daily , Weekly | |
| Add III to Watchlist: View: Get Complete III Trend Analysis ➞ | |
 | ACRE Ares Commercial Real Estate Corporation |
| Sector: Financials | |
| SubSector: Mortgage Investment | |
| MarketCap: 242.339 Millions | |
| Recent Price: 6.96 Smart Investing & Trading Score: 67 | |
| Day Percent Change: 0.43% Day Change: 0.03 | |
| Week Change: 2.05% Year-to-date Change: -32.8% | |
| ACRE Links: Profile News Message Board | |
| Charts:- Daily , Weekly | |
| Add ACRE to Watchlist: View: Get Complete ACRE Trend Analysis ➞ | |
 | HOFT Hooker Furniture Corporation |
| Sector: Consumer Staples | |
| SubSector: Home Furnishings & Fixtures | |
| MarketCap: 173.235 Millions | |
| Recent Price: 17.48 Smart Investing & Trading Score: 18 | |
| Day Percent Change: -1.69% Day Change: -0.30 | |
| Week Change: -6.12% Year-to-date Change: -33.0% | |
| HOFT Links: Profile News Message Board | |
| Charts:- Daily , Weekly | |
| Add HOFT to Watchlist: View: Get Complete HOFT Trend Analysis ➞ | |
 | SIBN SI-BONE, Inc. |
| Sector: Health Care | |
| SubSector: Medical Appliances & Equipment | |
| MarketCap: 234.78 Millions | |
| Recent Price: 14.06 Smart Investing & Trading Score: 10 | |
| Day Percent Change: -2.36% Day Change: -0.34 | |
| Week Change: -5.76% Year-to-date Change: -33.0% | |
| SIBN Links: Profile News Message Board | |
| Charts:- Daily , Weekly | |
| Add SIBN to Watchlist: View: Get Complete SIBN Trend Analysis ➞ | |
 | REPL Replimune Group, Inc. |
| Sector: Health Care | |
| SubSector: Biotechnology | |
| MarketCap: 367.885 Millions | |
| Recent Price: 5.57 Smart Investing & Trading Score: 10 | |
| Day Percent Change: -6.23% Day Change: -0.37 | |
| Week Change: -13.51% Year-to-date Change: -33.9% | |
| REPL Links: Profile News Message Board | |
| Charts:- Daily , Weekly | |
| Add REPL to Watchlist: View: Get Complete REPL Trend Analysis ➞ | |
 | GWH ESS Tech, Inc. |
| Sector: Industrials | |
| SubSector: Electrical Equipment & Parts | |
| MarketCap: 239 Millions | |
| Recent Price: 0.76 Smart Investing & Trading Score: 25 | |
| Day Percent Change: -6.63% Day Change: -0.05 | |
| Week Change: -3.11% Year-to-date Change: -34.0% | |
| GWH Links: Profile News Message Board | |
| Charts:- Daily , Weekly | |
| Add GWH to Watchlist: View: Get Complete GWH Trend Analysis ➞ | |
 | EVRI Everi Holdings Inc. |
| Sector: Services & Goods | |
| SubSector: Gaming Activities | |
| MarketCap: 273.389 Millions | |
| Recent Price: 7.43 Smart Investing & Trading Score: 20 | |
| Day Percent Change: 0.00% Day Change: 0.00 | |
| Week Change: 0.68% Year-to-date Change: -34.1% | |
| EVRI Links: Profile News Message Board | |
| Charts:- Daily , Weekly | |
| Add EVRI to Watchlist: View: Get Complete EVRI Trend Analysis ➞ | |
 | SRRK Scholar Rock Holding Corporation |
| Sector: Health Care | |
| SubSector: Biotechnology | |
| MarketCap: 441.385 Millions | |
| Recent Price: 12.29 Smart Investing & Trading Score: 0 | |
| Day Percent Change: -1.84% Day Change: -0.23 | |
| Week Change: -1.6% Year-to-date Change: -34.6% | |
| SRRK Links: Profile News Message Board | |
| Charts:- Daily , Weekly | |
| Add SRRK to Watchlist: View: Get Complete SRRK Trend Analysis ➞ | |
 | ONL Orion Office REIT Inc. |
| Sector: Financials | |
| SubSector: REIT - Office | |
| MarketCap: 375 Millions | |
| Recent Price: 3.73 Smart Investing & Trading Score: 75 | |
| Day Percent Change: 1.08% Day Change: 0.04 | |
| Week Change: 1.91% Year-to-date Change: -34.8% | |
| ONL Links: Profile News Message Board | |
| Charts:- Daily , Weekly | |
| Add ONL to Watchlist: View: Get Complete ONL Trend Analysis ➞ | |
 | NDLS Noodles & Company |
| Sector: Services & Goods | |
| SubSector: Restaurants | |
| MarketCap: 188.77 Millions | |
| Recent Price: 2.05 Smart Investing & Trading Score: 35 | |
| Day Percent Change: -2.84% Day Change: -0.06 | |
| Week Change: -6.18% Year-to-date Change: -34.9% | |
| NDLS Links: Profile News Message Board | |
| Charts:- Daily , Weekly | |
| Add NDLS to Watchlist: View: Get Complete NDLS Trend Analysis ➞ | |
 | MCRB Seres Therapeutics, Inc. |
| Sector: Health Care | |
| SubSector: Biotechnology | |
| MarketCap: 217.585 Millions | |
| Recent Price: 0.91 Smart Investing & Trading Score: 15 | |
| Day Percent Change: -4.10% Day Change: -0.04 | |
| Week Change: -1.07% Year-to-date Change: -35.0% | |
| MCRB Links: Profile News Message Board | |
| Charts:- Daily , Weekly | |
| Add MCRB to Watchlist: View: Get Complete MCRB Trend Analysis ➞ | |
 | EXTR Extreme Networks, Inc. |
| Sector: Technology | |
| SubSector: Communication Equipment | |
| MarketCap: 339.939 Millions | |
| Recent Price: 11.44 Smart Investing & Trading Score: 42 | |
| Day Percent Change: -1.55% Day Change: -0.18 | |
| Week Change: -1.97% Year-to-date Change: -35.2% | |
| EXTR Links: Profile News Message Board | |
| Charts:- Daily , Weekly | |
| Add EXTR to Watchlist: View: Get Complete EXTR Trend Analysis ➞ | |
 | CLNE Clean Energy Fuels Corp. |
| Sector: Utilities | |
| SubSector: Gas Utilities | |
| MarketCap: 371.977 Millions | |
| Recent Price: 2.48 Smart Investing & Trading Score: 42 | |
| Day Percent Change: -1.20% Day Change: -0.03 | |
| Week Change: -4.25% Year-to-date Change: -35.3% | |
| CLNE Links: Profile News Message Board | |
| Charts:- Daily , Weekly | |
| Add CLNE to Watchlist: View: Get Complete CLNE Trend Analysis ➞ | |
 | FFWM First Foundation Inc. |
| Sector: Financials | |
| SubSector: Regional - Midwest Banks | |
| MarketCap: 457.17 Millions | |
| Recent Price: 6.25 Smart Investing & Trading Score: 69 | |
| Day Percent Change: -2.50% Day Change: -0.16 | |
| Week Change: -0.32% Year-to-date Change: -35.4% | |
| FFWM Links: Profile News Message Board | |
| Charts:- Daily , Weekly | |
| Add FFWM to Watchlist: View: Get Complete FFWM Trend Analysis ➞ | |
 | OPFI OppFi Inc. |
| Sector: Financials | |
| SubSector: Credit Services | |
| MarketCap: 226 Millions | |
| Recent Price: 3.28 Smart Investing & Trading Score: 64 | |
| Day Percent Change: 1.55% Day Change: 0.05 | |
| Week Change: 12.71% Year-to-date Change: -35.8% | |
| OPFI Links: Profile News Message Board | |
| Charts:- Daily , Weekly | |
| Add OPFI to Watchlist: View: Get Complete OPFI Trend Analysis ➞ | |
 | XPEL XPEL, Inc. |
| Sector: Consumer Staples | |
| SubSector: Auto Parts | |
| MarketCap: 290.239 Millions | |
| Recent Price: 34.44 Smart Investing & Trading Score: 40 | |
| Day Percent Change: 0.44% Day Change: 0.15 | |
| Week Change: 2.35% Year-to-date Change: -36.0% | |
| XPEL Links: Profile News Message Board | |
| Charts:- Daily , Weekly | |
| Add XPEL to Watchlist: View: Get Complete XPEL Trend Analysis ➞ | |
| For tabular summary view of above stock list: Summary View ➞ 0 - 25 , 25 - 50 , 50 - 75 , 75 - 100 , 100 - 125 , 125 - 150 , 150 - 175 , 175 - 200 , 200 - 225 , 225 - 250 , 250 - 275 , 275 - 300 , 300 - 325 , 325 - 350 , 350 - 375 , 375 - 400 , 400 - 425 , 425 - 450 , 450 - 475 , 475 - 500 , 500 - 525 | ||
| Click To Change The Sort Order: By Market Cap or Company Size Performance: Year-to-date, Week and Day | |
| Select Chart Type: | ||
| Too many stocks? View smallcap stocks filtered by marketcap & sector |
| Marketcap: All SmallCap Stocks (default-no microcap), Large, Mid-Range, Small & MicroCap |
| Sector: Tech, Finance, Energy, Staples, Retail, Industrial, Materials, Utilities & Medical |
|
Best Stocks Today 12Stocks.com |
© 2024 12Stocks.com Terms & Conditions Privacy Contact Us
All Information Provided Only For Education And Not To Be Used For Investing or Trading. See Terms & Conditions


One More Thing ... Get Best Stocks Delivered Daily!
Never Ever Miss A Move With Our Top Ten Stocks Lists
Find Best Stocks In Any Market - Bull or Bear Market
Take A Peek At Our Top Ten Stocks Lists: Daily, Weekly, Year-to-Date & Top Trends
Find Best Stocks In Any Market - Bull or Bear Market
Take A Peek At Our Top Ten Stocks Lists: Daily, Weekly, Year-to-Date & Top Trends
Smallcap Stocks With Best Up Trends [0-bearish to 100-bullish]: Bloom Energy[100], Transcat [100], Powell Industries[100], GrafTech [100], Limbach [100], Third Harmonic[100], Northeast Bank[100], BrightView [100], PrimeEnergy Resources[100], PDL Community[100], Vital Farms[100]
Best Smallcap Stocks Year-to-Date:
Janux [333.41%], Viking [245.14%], Longboard [233.55%], Avidity Biosciences[226.22%], Super Micro[216.24%], Novavax [210.63%], Arcutis Bio[193.5%], Stoke [192.21%], Sweetgreen [182.48%], Vera [163.11%], MicroStrategy [162.09%] Best Smallcap Stocks This Week:
Genelux [31.78%], Pulse Biosciences[24.58%], Overseas Shipholding[23.18%], Bloom Energy[22.71%], Scilex Holding[22.22%], GrafTech [20.11%], Powell Industries[18.87%], NuScale Power[18.46%], Dyne [17.88%], PTC [17.39%], Waldencast [16.55%] Best Smallcap Stocks Daily:
Bloom Energy[17.11%], Waldencast [16.55%], RAPT [15.00%], Transcat [14.29%], Presto Automation[13.89%], Powell Industries[13.81%], Pulse Biosciences[13.40%], GrafTech [12.97%], Genelux [11.86%], Relay [11.58%], Citius [10.79%]