
 Login Sign Up


| |||||
 |  | ||||

| 12Stocks.com Market Intelligence |
Best SmallCap Stocks
|
| In a hurry? Small Cap Stock Lists: Performance Trends Table, Stock Charts
Sort Small Cap stocks: Daily, Weekly, Year-to-Date, Market Cap & Trends. Filter Small Cap stocks list by sector: Show all, Tech, Finance, Energy, Staples, Retail, Industrial, Materials, Utilities and HealthCare Filter Small Cap stocks list by size: All Large Medium Small and MicroCap |
| 12Stocks.com Small Cap Stocks Performances & Trends Daily | |||||||||
|
|  The overall Smart Investing & Trading Score is 60 (0-bearish to 100-bullish) which puts Small Cap index in short term neutral to bullish trend. The Smart Investing & Trading Score from previous trading session is 80 and hence a deterioration of trend.
| ||||||||
Here are the Smart Investing & Trading Scores of the most requested small cap stocks at 12Stocks.com (click stock name for detailed review):
|


| 12Stocks.com: Investing in Smallcap Index with Stocks | |
|
The following table helps investors and traders sort through current performance and trends (as measured by Smart Investing & Trading Score) of various
stocks in the Smallcap Index. Quick View: Move mouse or cursor over stock symbol (ticker) to view short-term technical chart and over stock name to view long term chart. Click on  to add stock symbol to your watchlist and to add stock symbol to your watchlist and  to view watchlist. Click on any ticker or stock name for detailed market intelligence report for that stock. to view watchlist. Click on any ticker or stock name for detailed market intelligence report for that stock. |
12Stocks.com Performance of Stocks in Smallcap Index
| Ticker | Stock Name | Watchlist | Category | Recent Price | Smart Investing & Trading Score | Change % | Weekly Change% |
| PLYM | Plymouth Industrial |   | Financials | 22.00 | 70 | 0.19% | 40.40% |
| SLQT | SelectQuote | | Financials | 2.26 | 30 | 41.53% | 30.15% |
| MBI | MBIA | | Financials | 7.96 | 60 | 3.04% | 18.44% |
| CIFR | Cipher Mining | | Financials | 7.64 | 100 | -0.84% | 10.90% |
| BBUC | Brookfield Business | | Financials | 33.00 | 49 | -0.56% | 10.18% |
| STRS | Stratus Properties | | Financials | 19.46 | 40 | -1.74% | 8.94% |
| HIPO | Hippo | | Financials | 33.81 | 50 | 5.47% | 6.63% |
| BNL | Broadstone Net | | Financials | 18.59 | 80 | 2.36% | 6.52% |
| SBRA | Sabra Health | | Financials | 19.11 | 80 | 0.82% | 6.34% |
| ONL | Orion Office | | Financials | 2.97 | 51 | 0.74% | 6.23% |
| AMBC | Ambac Financial | | Financials | 9.03 | 90 | 0.00% | 5.86% |
| PLMR | Palomar | | Financials | 123.02 | 30 | 1.44% | 5.20% |
| EHTH | eHealth | | Financials | 3.87 | 80 | 4.65% | 4.96% |
| PSTL | Postal Realty | | Financials | 15.84 | 100 | -0.20% | 4.62% |
| HMST | HomeStreet | | Financials | 13.87 | 70 | 0.07% | 4.32% |
| WSR | Whitestone REIT | | Financials | 13.16 | 50 | 2.34% | 4.19% |
| LXP | Lexington Realty | | Financials | 9.08 | 60 | -1.49% | 4.13% |
| NHI | National Health | | Financials | 78.29 | 60 | 0.56% | 4.09% |
| TIPT | Tiptree | | Financials | 23.45 | 30 | 1.93% | 3.89% |
| DOUG | Douglas Elliman | | Financials | 2.72 | 48 | 0.40% | 3.75% |
| AGM | Federal Agricultural | | Financials | 209.57 | 60 | -0.38% | 3.73% |
| HCI | HCI Group | | Financials | 166.71 | 100 | 0.58% | 3.70% |
| NXRT | NexPoint Residential | | Financials | 34.51 | 30 | 0.34% | 3.63% |
| SVC | Service Properties | | Financials | 2.70 | 40 | -0.76% | 3.16% |
| SITC | SITE Centers | | Financials | 12.28 | 0 | 0.08% | 3.14% |
| For chart view version of above stock list: Chart View ➞ 0 - 25 , 25 - 50 , 50 - 75 , 75 - 100 , 100 - 125 , 125 - 150 , 150 - 175 , 175 - 200 , 200 - 225 , 225 - 250 , 250 - 275 , 275 - 300 , 300 - 325 , 325 - 350 , 350 - 375 | ||
 | Click To Change The Sort Order: By Market Cap or Company Size Performance: Year-to-date, Week and Day |  |
| Too many stocks? View smallcap stocks filtered by marketcap & sector |
| Marketcap: All SmallCap Stocks (default-no microcap), Large, Mid-Range, Small |
| Smallcap Sector: Tech, Finance, Energy, Staples, Retail, Industrial, Materials, & Medical |
|
Get the most comprehensive stock market coverage daily at 12Stocks.com ➞ Best Stocks Today ➞ Best Stocks Weekly ➞ Best Stocks Year-to-Date ➞ Best Stocks Trends ➞  Best Stocks Today 12Stocks.com Best Nasdaq Stocks ➞ Best S&P 500 Stocks ➞ Best Tech Stocks ➞ Best Biotech Stocks ➞ |
| Detailed Overview of SmallCap Stocks |
| SmallCap Technical Overview, Leaders & Laggards, Top SmallCap ETF Funds & Detailed SmallCap Stocks List, Charts, Trends & More |
| Smallcap: Technical Analysis, Trends & YTD Performance | |
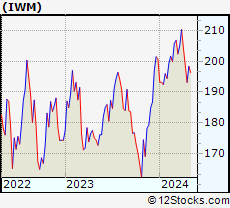
| SmallCap segment as represented by
IWM, an exchange-traded fund [ETF], holds basket of thousands of smallcap stocks from across all major sectors of the US stock market. The smallcap index (contains stocks like Riverbed & Sotheby's) is up by 3.79% and is currently underperforming the overall market by -2.73% year-to-date. Below is a quick view of technical charts and trends: | |
 IWM Weekly Chart |
|
| Long Term Trend: Very Good | |
| Medium Term Trend: Very Good | |
 IWM Daily Chart |
|
| Short Term Trend: Not Good | |
| Overall Trend Score: 60 | |
| YTD Performance: 3.79% | |
| **Trend Scores & Views Are Only For Educational Purposes And Not For Investing | |
| 12Stocks.com: Top Performing Small Cap Index Stocks | ||||||||||||||||||||||||||||||||||||||||||||||||
 The top performing Small Cap Index stocks year to date are
Now, more recently, over last week, the top performing Small Cap Index stocks on the move are


|
||||||||||||||||||||||||||||||||||||||||||||||||
| 12Stocks.com: Investing in Smallcap Index using Exchange Traded Funds | |
|
The following table shows list of key exchange traded funds (ETF) that
help investors track Smallcap index. The following list also includes leveraged ETF funds that track twice or thrice the daily returns of Smallcap indices. Short or inverse ETF funds move in the opposite direction to the index they track and are useful during market pullbacks or during bear markets. Quick View: Move mouse or cursor over ETF symbol (ticker) to view short-term technical chart and over ETF name to view long term chart. Click on ticker or stock name for detailed view. Click on to add stock symbol to your watchlist and to view watchlist. |
12Stocks.com List of ETFs that track Smallcap Index
| Ticker | ETF Name | Watchlist | Recent Price | Smart Investing & Trading Score | Change % | Week % | Year-to-date % |
| IWM | iShares Russell 2000 | | 233.9 | 60 | -0.54 | -0.54 | 3.79% |
| IJR | iShares Core S&P Small-Cap | | 118.04 | 50 | -0.08 | -0.89 | -0.29% |
| VTWO | Vanguard Russell 2000 ETF | | 95.13 | 60 | 0.24 | -0.93 | 2.92% |
| IWN | iShares Russell 2000 Value | | 174.07 | 60 | -0.01 | -0.85 | 2.1% |
| IWO | iShares Russell 2000 Growth | | 307.70 | 60 | 0.51 | -1.11 | 3.5% |
| IJT | iShares S&P Small-Cap 600 Growth | | 140.97 | 50 | 0.05 | -0.89 | 1.68% |
| IJS | iShares S&P Small-Cap 600 Value | | 109.55 | 60 | -0.22 | -0.99 | -2.29% |
| XSLV | PowerShares S&P SmallCap Low Volatil ETF | | 47.58 | 50 | -0.3 | -0.13 | -1.1% |
| SAA | ProShares Ultra SmallCap600 | | 25.37 | 60 | -0.31 | -2.17 | -8.34% |
| SMLV | SPDR SSGA US Small Cap Low Volatil ETF | | 132.79 | 60 | -0.09 | 2.75 | 2.13% |
| SBB | ProShares Short SmallCap600 | | 14.07 | 50 | 0.15 | 0.97 | 0.93% |
| SDD | ProShares UltraShort SmallCap600 | | 13.47 | 50 | -100 | -100 | -100% |
| 12Stocks.com: Charts, Trends, Fundamental Data and Performances of SmallCap Stocks | |
|
We now take in-depth look at all SmallCap stocks including charts, multi-period performances and overall trends (as measured by Smart Investing & Trading Score). One can sort SmallCap stocks (click link to choose) by Daily, Weekly and by Year-to-Date performances. Also, one can sort by size of the company or by market capitalization. |
| Select Your Default Chart Type: | |||||
| |||||
| Click on stock symbol or name for detailed view. Click on to add stock symbol to your watchlist and to view watchlist. Quick View: Move mouse or cursor over "Daily" to quickly view daily technical stock chart and over "Weekly" to view weekly technical stock chart. | |||||

 | PLYM Plymouth Industrial REIT, Inc. |
| Sector: Financials | |
| SubSector: REIT - Industrial | |
| MarketCap: 153.449 Millions | |
| Recent Price: 22.00 Smart Investing & Trading Score: 70 | |
| Day Percent Change: 0.19% Day Change: 0.04 | |
| Week Change: 40.4% Year-to-date Change: 21.0% | |
| PLYM Links: Profile News Message Board | |
| Charts:- Daily , Weekly | |
| Add PLYM to Watchlist: View: Get Complete PLYM Trend Analysis ➞ | |
 | SLQT SelectQuote, Inc. |
| Sector: Financials | |
| SubSector: Insurance Brokers | |
| MarketCap: 38257 Millions | |
| Recent Price: 2.26 Smart Investing & Trading Score: 30 | |
| Day Percent Change: 41.53% Day Change: 0.76 | |
| Week Change: 30.15% Year-to-date Change: -30.4% | |
| SLQT Links: Profile News Message Board | |
| Charts:- Daily , Weekly | |
| Add SLQT to Watchlist: View: Get Complete SLQT Trend Analysis ➞ | |
 | MBI MBIA Inc. |
| Sector: Financials | |
| SubSector: Property & Casualty Insurance | |
| MarketCap: 539.012 Millions | |
| Recent Price: 7.96 Smart Investing & Trading Score: 60 | |
| Day Percent Change: 3.04% Day Change: 0.22 | |
| Week Change: 18.44% Year-to-date Change: 15.3% | |
| MBI Links: Profile News Message Board | |
| Charts:- Daily , Weekly | |
| Add MBI to Watchlist: View: Get Complete MBI Trend Analysis ➞ | |
 | CIFR Cipher Mining Inc. |
| Sector: Financials | |
| SubSector: Capital Markets | |
| MarketCap: 712 Millions | |
| Recent Price: 7.64 Smart Investing & Trading Score: 100 | |
| Day Percent Change: -0.84% Day Change: -0.05 | |
| Week Change: 10.9% Year-to-date Change: 27.2% | |
| CIFR Links: Profile News Message Board | |
| Charts:- Daily , Weekly | |
| Add CIFR to Watchlist: View: Get Complete CIFR Trend Analysis ➞ | |
 | BBUC Brookfield Business Corporation |
| Sector: Financials | |
| SubSector: Asset Management | |
| MarketCap: 1810 Millions | |
| Recent Price: 33.00 Smart Investing & Trading Score: 49 | |
| Day Percent Change: -0.56% Day Change: -0.19 | |
| Week Change: 10.18% Year-to-date Change: 38.5% | |
| BBUC Links: Profile News Message Board | |
| Charts:- Daily , Weekly | |
| Add BBUC to Watchlist: View: Get Complete BBUC Trend Analysis ➞ | |
 | STRS Stratus Properties Inc. |
| Sector: Financials | |
| SubSector: Real Estate Development | |
| MarketCap: 167.819 Millions | |
| Recent Price: 19.46 Smart Investing & Trading Score: 40 | |
| Day Percent Change: -1.74% Day Change: -0.32 | |
| Week Change: 8.94% Year-to-date Change: -13.2% | |
| STRS Links: Profile News Message Board | |
| Charts:- Daily , Weekly | |
| Add STRS to Watchlist: View: Get Complete STRS Trend Analysis ➞ | |
 | HIPO Hippo Holdings Inc. |
| Sector: Financials | |
| SubSector: Insurance - Specialty | |
| MarketCap: 377 Millions | |
| Recent Price: 33.81 Smart Investing & Trading Score: 50 | |
| Day Percent Change: 5.47% Day Change: 1.71 | |
| Week Change: 6.63% Year-to-date Change: 23.1% | |
| HIPO Links: Profile News Message Board | |
| Charts:- Daily , Weekly | |
| Add HIPO to Watchlist: View: Get Complete HIPO Trend Analysis ➞ | |
 | BNL Broadstone Net Lease, Inc. |
| Sector: Financials | |
| SubSector: REIT Diversified | |
| MarketCap: 27267 Millions | |
| Recent Price: 18.59 Smart Investing & Trading Score: 80 | |
| Day Percent Change: 2.36% Day Change: 0.41 | |
| Week Change: 6.52% Year-to-date Change: 16.3% | |
| BNL Links: Profile News Message Board | |
| Charts:- Daily , Weekly | |
| Add BNL to Watchlist: View: Get Complete BNL Trend Analysis ➞ | |
 | SBRA Sabra Health Care REIT, Inc. |
| Sector: Financials | |
| SubSector: REIT - Healthcare Facilities | |
| MarketCap: 2576.54 Millions | |
| Recent Price: 19.11 Smart Investing & Trading Score: 80 | |
| Day Percent Change: 0.82% Day Change: 0.16 | |
| Week Change: 6.34% Year-to-date Change: 17.3% | |
| SBRA Links: Profile News Message Board | |
| Charts:- Daily , Weekly | |
| Add SBRA to Watchlist: View: Get Complete SBRA Trend Analysis ➞ | |
 | ONL Orion Office REIT Inc. |
| Sector: Financials | |
| SubSector: REIT - Office | |
| MarketCap: 375 Millions | |
| Recent Price: 2.97 Smart Investing & Trading Score: 51 | |
| Day Percent Change: 0.74% Day Change: 0.02 | |
| Week Change: 6.23% Year-to-date Change: -25.0% | |
| ONL Links: Profile News Message Board | |
| Charts:- Daily , Weekly | |
| Add ONL to Watchlist: View: Get Complete ONL Trend Analysis ➞ | |
 | AMBC Ambac Financial Group, Inc. |
| Sector: Financials | |
| SubSector: Surety & Title Insurance | |
| MarketCap: 587.818 Millions | |
| Recent Price: 9.03 Smart Investing & Trading Score: 90 | |
| Day Percent Change: 0% Day Change: 0 | |
| Week Change: 5.86% Year-to-date Change: -32.9% | |
| AMBC Links: Profile News Message Board | |
| Charts:- Daily , Weekly | |
| Add AMBC to Watchlist: View: Get Complete AMBC Trend Analysis ➞ | |
 | PLMR Palomar Holdings, Inc. |
| Sector: Financials | |
| SubSector: Property & Casualty Insurance | |
| MarketCap: 1297.42 Millions | |
| Recent Price: 123.02 Smart Investing & Trading Score: 30 | |
| Day Percent Change: 1.44% Day Change: 1.8 | |
| Week Change: 5.2% Year-to-date Change: 20.2% | |
| PLMR Links: Profile News Message Board | |
| Charts:- Daily , Weekly | |
| Add PLMR to Watchlist: View: Get Complete PLMR Trend Analysis ➞ | |
 | EHTH eHealth, Inc. |
| Sector: Financials | |
| SubSector: Insurance Brokers | |
| MarketCap: 2813.57 Millions | |
| Recent Price: 3.87 Smart Investing & Trading Score: 80 | |
| Day Percent Change: 4.65% Day Change: 0.16 | |
| Week Change: 4.96% Year-to-date Change: -61.7% | |
| EHTH Links: Profile News Message Board | |
| Charts:- Daily , Weekly | |
| Add EHTH to Watchlist: View: Get Complete EHTH Trend Analysis ➞ | |
 | PSTL Postal Realty Trust, Inc. |
| Sector: Financials | |
| SubSector: REIT - Office | |
| MarketCap: 82.9866 Millions | |
| Recent Price: 15.84 Smart Investing & Trading Score: 100 | |
| Day Percent Change: -0.2% Day Change: -0.03 | |
| Week Change: 4.62% Year-to-date Change: 22.7% | |
| PSTL Links: Profile News Message Board | |
| Charts:- Daily , Weekly | |
| Add PSTL to Watchlist: View: Get Complete PSTL Trend Analysis ➞ | |
 | HMST HomeStreet, Inc. |
| Sector: Financials | |
| SubSector: Savings & Loans | |
| MarketCap: 535.33 Millions | |
| Recent Price: 13.87 Smart Investing & Trading Score: 70 | |
| Day Percent Change: 0.07% Day Change: 0.01 | |
| Week Change: 4.32% Year-to-date Change: 20.5% | |
| HMST Links: Profile News Message Board | |
| Charts:- Daily , Weekly | |
| Add HMST to Watchlist: View: Get Complete HMST Trend Analysis ➞ | |
 | WSR Whitestone REIT |
| Sector: Financials | |
| SubSector: REIT - Retail | |
| MarketCap: 316.114 Millions | |
| Recent Price: 13.16 Smart Investing & Trading Score: 50 | |
| Day Percent Change: 2.34% Day Change: 0.29 | |
| Week Change: 4.19% Year-to-date Change: -8.0% | |
| WSR Links: Profile News Message Board | |
| Charts:- Daily , Weekly | |
| Add WSR to Watchlist: View: Get Complete WSR Trend Analysis ➞ | |
 | LXP Lexington Realty Trust |
| Sector: Financials | |
| SubSector: REIT - Diversified | |
| MarketCap: 2483.43 Millions | |
| Recent Price: 9.08 Smart Investing & Trading Score: 60 | |
| Day Percent Change: -1.49% Day Change: -0.13 | |
| Week Change: 4.13% Year-to-date Change: 8.9% | |
| LXP Links: Profile News Message Board | |
| Charts:- Daily , Weekly | |
| Add LXP to Watchlist: View: Get Complete LXP Trend Analysis ➞ | |
 | NHI National Health Investors, Inc. |
| Sector: Financials | |
| SubSector: REIT - Healthcare Facilities | |
| MarketCap: 2156.54 Millions | |
| Recent Price: 78.29 Smart Investing & Trading Score: 60 | |
| Day Percent Change: 0.56% Day Change: 0.43 | |
| Week Change: 4.09% Year-to-date Change: 14.3% | |
| NHI Links: Profile News Message Board | |
| Charts:- Daily , Weekly | |
| Add NHI to Watchlist: View: Get Complete NHI Trend Analysis ➞ | |
 | TIPT Tiptree Inc. |
| Sector: Financials | |
| SubSector: Life Insurance | |
| MarketCap: 183.486 Millions | |
| Recent Price: 23.45 Smart Investing & Trading Score: 30 | |
| Day Percent Change: 1.93% Day Change: 0.44 | |
| Week Change: 3.89% Year-to-date Change: 12.0% | |
| TIPT Links: Profile News Message Board | |
| Charts:- Daily , Weekly | |
| Add TIPT to Watchlist: View: Get Complete TIPT Trend Analysis ➞ | |
 | DOUG Douglas Elliman Inc. |
| Sector: Financials | |
| SubSector: Financials Services | |
| MarketCap: 197 Millions | |
| Recent Price: 2.72 Smart Investing & Trading Score: 48 | |
| Day Percent Change: 0.4% Day Change: 0.01 | |
| Week Change: 3.75% Year-to-date Change: 49.1% | |
| DOUG Links: Profile News Message Board | |
| Charts:- Daily , Weekly | |
| Add DOUG to Watchlist: View: Get Complete DOUG Trend Analysis ➞ | |
 | AGM Federal Agricultural Mortgage Corporation |
| Sector: Financials | |
| SubSector: Credit Services | |
| MarketCap: 542.008 Millions | |
| Recent Price: 209.57 Smart Investing & Trading Score: 60 | |
| Day Percent Change: -0.38% Day Change: -0.75 | |
| Week Change: 3.73% Year-to-date Change: 0.7% | |
| AGM Links: Profile News Message Board | |
| Charts:- Daily , Weekly | |
| Add AGM to Watchlist: View: Get Complete AGM Trend Analysis ➞ | |
 | HCI HCI Group, Inc. |
| Sector: Financials | |
| SubSector: Property & Casualty Insurance | |
| MarketCap: 297.412 Millions | |
| Recent Price: 166.71 Smart Investing & Trading Score: 100 | |
| Day Percent Change: 0.58% Day Change: 0.95 | |
| Week Change: 3.7% Year-to-date Change: 41.1% | |
| HCI Links: Profile News Message Board | |
| Charts:- Daily , Weekly | |
| Add HCI to Watchlist: View: Get Complete HCI Trend Analysis ➞ | |
 | NXRT NexPoint Residential Trust, Inc. |
| Sector: Financials | |
| SubSector: REIT - Residential | |
| MarketCap: 839.161 Millions | |
| Recent Price: 34.51 Smart Investing & Trading Score: 30 | |
| Day Percent Change: 0.34% Day Change: 0.11 | |
| Week Change: 3.63% Year-to-date Change: -20.5% | |
| NXRT Links: Profile News Message Board | |
| Charts:- Daily , Weekly | |
| Add NXRT to Watchlist: View: Get Complete NXRT Trend Analysis ➞ | |
 | SVC Service Properties Trust |
| Sector: Financials | |
| SubSector: REIT - Hotel/Motel | |
| MarketCap: 1067.74 Millions | |
| Recent Price: 2.70 Smart Investing & Trading Score: 40 | |
| Day Percent Change: -0.76% Day Change: -0.02 | |
| Week Change: 3.16% Year-to-date Change: 4.1% | |
| SVC Links: Profile News Message Board | |
| Charts:- Daily , Weekly | |
| Add SVC to Watchlist: View: Get Complete SVC Trend Analysis ➞ | |
 | SITC SITE Centers Corp. |
| Sector: Financials | |
| SubSector: REIT - Retail | |
| MarketCap: 1449.54 Millions | |
| Recent Price: 12.28 Smart Investing & Trading Score: 0 | |
| Day Percent Change: 0.08% Day Change: 0.01 | |
| Week Change: 3.14% Year-to-date Change: -12.5% | |
| SITC Links: Profile News Message Board | |
| Charts:- Daily , Weekly | |
| Add SITC to Watchlist: View: Get Complete SITC Trend Analysis ➞ | |
| For tabular summary view of above stock list: Summary View ➞ 0 - 25 , 25 - 50 , 50 - 75 , 75 - 100 , 100 - 125 , 125 - 150 , 150 - 175 , 175 - 200 , 200 - 225 , 225 - 250 , 250 - 275 , 275 - 300 , 300 - 325 , 325 - 350 , 350 - 375 | ||
| Click To Change The Sort Order: By Market Cap or Company Size Performance: Year-to-date, Week and Day | |
| Select Chart Type: | ||
| Too many stocks? View smallcap stocks filtered by marketcap & sector |
| Marketcap: All SmallCap Stocks (default-no microcap), Large, Mid-Range, Small & MicroCap |
| Sector: Tech, Finance, Energy, Staples, Retail, Industrial, Materials, Utilities & Medical |
|
Best Stocks Today 12Stocks.com |
© 2025 12Stocks.com Terms & Conditions Privacy Contact Us
All Information Provided Only For Education And Not To Be Used For Investing or Trading. See Terms & Conditions


One More Thing ... Get Best Stocks Delivered Daily!
Never Ever Miss A Move With Our Top Ten Stocks Lists
Find Best Stocks In Any Market - Bull or Bear Market
Take A Peek At Our Top Ten Stocks Lists: Daily, Weekly, Year-to-Date & Top Trends
Find Best Stocks In Any Market - Bull or Bear Market
Take A Peek At Our Top Ten Stocks Lists: Daily, Weekly, Year-to-Date & Top Trends
Smallcap Stocks With Best Up Trends [0-bearish to 100-bullish]: Immuneering [100], Cato [100], Cooper-Standard [100], Precigen [100], Babcock & Wilcox Enterprises[100], Design [100], Terns [100], Teekay Tankers[100], Green Plains[100], Keros [100], i-80 Gold[100]
Best Smallcap Stocks Year-to-Date:
Celcuity [284.87%], OptimizeRx [232.1%], Precigen [225%], CommScope Holding[195.39%], Willdan Group[179%], 908 Devices[173.64%], Centrus Energy[166.15%], nLIGHT [157.86%], Cooper-Standard [153.02%], Rigel [149.64%], Kratos Defense[145.56%] Best Smallcap Stocks This Week:
Precigen [96.76%], ALX Oncology[57.25%], Immuneering [52.3%], Plymouth Industrial[40.4%], Array [37.99%], Cato [34.15%], SelectQuote [30.15%], Karyopharm [29.46%], Zentalis [26.35%], Guess [25.88%], Shoals [25.49%] Best Smallcap Stocks Daily:
SelectQuote [41.53%], Immuneering [34.99%], Cato [34.15%], ALX Oncology[23.8%], Cooper-Standard [16.38%], Tyra Biosciences[14.26%], Zentalis [14.02%], Zura Bio[13.71%], X4 [13.57%], Precigen [13.4%], Mersana [11.25%]