
 Login Sign Up


| |||||
 |  | ||||

| 12Stocks.com Market Intelligence |
Best S&P 100 Stocks
| In a hurry? S&P 100 Stocks Lists: Performance Trends Table, Stock Charts
Sort S&P 100 stocks: Daily, Weekly, Year-to-Date, Market Cap & Trends. |
| 12Stocks.com S&P 100 Stocks Performances & Trends Daily | |||||||||
|
|  The overall Smart Investing & Trading Score is 90 (0-bearish to 100-bullish) which puts S&P 100 index in short term bullish trend. The Smart Investing & Trading Score from previous trading session is 80 and an improvement of trend continues.
| ||||||||
Here are the Smart Investing & Trading Scores of the most requested S&P 100 stocks at 12Stocks.com (click stock name for detailed review):
|


| 12Stocks.com: Top Performing S&P 100 Index Stocks | ||||||||||||||||||||||||||||||||||||||||||||||||
 The top performing S&P 100 Index stocks year to date are
Now, more recently, over last week, the top performing S&P 100 Index stocks on the move are


|
||||||||||||||||||||||||||||||||||||||||||||||||
| 12Stocks.com: Investing in S&P 100 Index with Stocks | |
|
The following table helps investors and traders sort through current performance and trends (as measured by Smart Investing & Trading Score) of various
stocks in the S&P 100 Index. Quick View: Move mouse or cursor over stock symbol (ticker) to view short-term technical chart and over stock name to view long term chart. Click on  to add stock symbol to your watchlist and to add stock symbol to your watchlist and  to view watchlist. Click on any ticker or stock name for detailed market intelligence report for that stock. to view watchlist. Click on any ticker or stock name for detailed market intelligence report for that stock. |
12Stocks.com Performance of Stocks in S&P 100 Index
| Ticker | Stock Name | Watchlist | Category | Recent Price | Smart Investing & Trading Score | Change % | YTD Change% |
| MSFT | Microsoft |   | Technology | 515.74 | 60 | -0.76 | 23.69% |
| CVX | Chevron Corp | | Energy | 153.37 | 50 | -0.78 | 6.99% |
| GS | Goldman Sachs | | Financials | 779.38 | 20 | -0.78 | 36.90% |
| KHC | Kraft Heinz | | Consumer Staples | 26.07 | 50 | -0.80 | -12.89% |
| MO | Altria | | Consumer Staples | 65.75 | 40 | -0.81 | 29.68% |
| CL | Colgate-Palmolive Co | | Consumer Staples | 78.31 | 0 | -0.89 | -12.02% |
| SO | Southern | | Utilities | 93.89 | 40 | -0.96 | 16.34% |
| VZ | Verizon | | Technology | 43.40 | 40 | -0.98 | 13.47% |
| MS | Morgan Stanley | | Financials | 155.30 | 20 | -1.01 | 27.17% |
| KO | Coca-Cola Co | | Consumer Staples | 66.10 | 20 | -1.02 | 8.44% |
| JPM | JPMorgan Chase | | Financials | 307.55 | 30 | -1.02 | 30.23% |
| TMO | Thermo Fisher | | Health Care | 524.96 | 100 | -1.09 | 0.65% |
| AMT | American Tower | | Financials | 191.17 | 10 | -1.11 | 7.31% |
| DHR | Danaher Corp | | Health Care | 210.33 | 100 | -1.20 | -8.19% |
| TMUS | T-Mobile US | | Technology | 230.14 | 0 | -1.34 | 5.57% |
| C | Citi | | Financials | 97.34 | 20 | -1.39 | 42.19% |
| CMCSA | Comcast Corp | | Technology | 30.40 | 0 | -1.75 | -16.58% |
| PM | Philip Morris | | Consumer Staples | 157.91 | 0 | -1.83 | 32.54% |
| T | AT&T | | Technology | 27.01 | 0 | -1.96 | 22.33% |
| CHTR | Charter | | Technology | 269.61 | 40 | -2.00 | -22.83% |
| COP | Conoco Phillips | | Energy | 93.38 | 40 | -2.18 | -5.14% |
| MDLZ | Mondelez | | Consumer Staples | 61.78 | 0 | -2.20 | 5.29% |
| ABBV | Abbvie | | Health Care | 236.56 | 100 | -3.20 | 35.47% |
| GM | General Motors | | Services & Goods | 59.36 | 50 | -3.23 | 16.22% |
| BMY | Bristol-Myers | | Health Care | 45.73 | 80 | -3.58 | -16.62% |
| For chart view version of above stock list: Chart View ➞ 0 - 25 , 25 - 50 , 50 - 75 , 75 - 100 , 100 - 125 | ||
 | Click To Change The Sort Order: By Market Cap or Company Size Performance: Year-to-date, Week and Day |  |
|
Get the most comprehensive stock market coverage daily at 12Stocks.com ➞ Best Stocks Today ➞ Best Stocks Weekly ➞ Best Stocks Year-to-Date ➞ Best Stocks Trends ➞  Best Stocks Today 12Stocks.com Best Nasdaq Stocks ➞ Best S&P 500 Stocks ➞ Best Tech Stocks ➞ Best Biotech Stocks ➞ |
| Detailed Overview of S&P 100 Stocks |
| S&P 100 Technical Overview, Leaders & Laggards, Top S&P 100 ETF Funds & Detailed S&P 100 Stocks List, Charts, Trends & More |
| S&P 100: Technical Analysis, Trends & YTD Performance | |
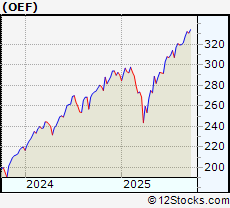
| S&P 100 index as represented by
OEF, an exchange-traded fund [ETF], holds basket of one hundred US (mostly largecap) stocks from across all major sectors of the US stock market. The S&P 100 index (contains stocks like Apple and Exxon) is up by 16.5396% and is currently outperforming the overall market by 1.7817% year-to-date. Below is a quick view of technical charts and trends: | |
 OEF Weekly Chart |
|
| Long Term Trend: Very Good | |
| Medium Term Trend: Good | |
 OEF Daily Chart |
|
| Short Term Trend: Very Good | |
| Overall Trend Score: 90 | |
| YTD Performance: 16.5396% | |
| **Trend Scores & Views Are Only For Educational Purposes And Not For Investing | |
| 12Stocks.com: Investing in S&P 100 Index using Exchange Traded Funds | |
|
The following table shows list of key exchange traded funds (ETF) that
help investors track S&P 100 index. We have also included ETF funds that track S&P 500 index since it is market-cap weighted. The following list also includes leveraged ETF funds that track twice or thrice the daily returns of S&P 100 indices. Short or inverse ETF funds move in the opposite direction to the index they track and are useful during market pullbacks or during bear markets. Quick View: Move mouse or cursor over ETF symbol (ticker) to view short-term technical chart and over ETF name to view long term chart. Click on ticker or stock name for detailed view. Click on to add stock symbol to your watchlist and to view watchlist. |
12Stocks.com List of ETFs that track S&P 100 Index
| Ticker | ETF Name | Watchlist | Recent Price | Smart Investing & Trading Score | Change % | Week % | Year-to-date % |
| SPY | SPDR S&P 500 ETF Trust | | 669.22 | 90 | 0.115192 | 1.22826 | 15.1527% |
| SPXU | ProShares UltraPro Short S&P 500 | | 13.34 | 10 | -0.224383 | -3.26323 | -40.0301% |
| SDS | ProShares UltraShort S&P500 -2x Shares | | 14.33 | 10 | -0.139373 | -2.1843 | -25.9516% |
| SH | ProShares Short S&P500 -1x Shares | | 36.80 | 10 | -0.0543183 | -1.07527 | -11.8852% |
| VOO | Vanguard S&P 500 ETF | | 615.25 | 90 | 0.107389 | 0.943396 | 15.2251% |
| UPRO | ProShares UltraPro S&P 500 ETF 3x Shares | | 113.01 | 90 | 0.275067 | 3.45112 | 29.2069% |
| SPXS | Direxion Daily S&P 500 Bear -3X Shares | | 37.50 | 70 | -0.239425 | 868.992 | 503.962% |
| SPXL | Direxion Daily S&P 500 Bull 3X Shares | | 214.76 | 90 | 0.28953 | 3.47386 | 29.2396% |
| SSO | ProShares Ultra S&P500 2x Shares | | 113.12 | 90 | 0.177117 | 2.334 | 23.4297% |
| OEF | iShares S&P 100 ETF | | 334.28 | 90 | 0.00598337 | 1.05505 | 16.5396% |
| 12Stocks.com: Charts, Trends, Fundamental Data and Performances of S&P 100 Stocks | |
|
We now take in-depth look at all S&P 100 stocks including charts, multi-period performances and overall trends (as measured by Smart Investing & Trading Score). One can sort S&P 100 stocks (click link to choose) by Daily, Weekly and by Year-to-Date performances. Also, one can sort by size of the company or by market capitalization. |
| Select Your Default Chart Type: | |||||
| |||||
| Click on stock symbol or name for detailed view. Click on to add stock symbol to your watchlist and to view watchlist. Quick View: Move mouse or cursor over "Daily" to quickly view daily technical stock chart and over "Weekly" to view weekly technical stock chart. | |||||

 | MSFT Microsoft Corporation |
| Sector: Technology | |
| SubSector: Software - Infrastructure | |
| MarketCap: 3679420 Millions | |
| Recent Price: 515.74 Smart Investing & Trading Score: 60 | |
| Day Percent Change: -0.763888% Day Change: -2.57 | |
| Week Change: 1.09576% Year-to-date Change: 23.7% | |
| MSFT Links: Profile News Message Board | |
| Charts:- Daily , Weekly | |
| Add MSFT to Watchlist: View: Get Complete MSFT Trend Analysis ➞ | |
 | CVX Chevron Corp |
| Sector: Energy | |
| SubSector: Oil & Gas Integrated | |
| MarketCap: 314603 Millions | |
| Recent Price: 153.37 Smart Investing & Trading Score: 50 | |
| Day Percent Change: -0.782766% Day Change: -0.63 | |
| Week Change: -3.64996% Year-to-date Change: 7.0% | |
| CVX Links: Profile News Message Board | |
| Charts:- Daily , Weekly | |
| Add CVX to Watchlist: View: Get Complete CVX Trend Analysis ➞ | |
 | GS Goldman Sachs Group, Inc |
| Sector: Financials | |
| SubSector: Capital Markets | |
| MarketCap: 223472 Millions | |
| Recent Price: 779.38 Smart Investing & Trading Score: 20 | |
| Day Percent Change: -0.780385% Day Change: -3.74 | |
| Week Change: -1.64683% Year-to-date Change: 36.9% | |
| GS Links: Profile News Message Board | |
| Charts:- Daily , Weekly | |
| Add GS to Watchlist: View: Get Complete GS Trend Analysis ➞ | |
 | KHC Kraft Heinz Co |
| Sector: Consumer Staples | |
| SubSector: Packaged Foods | |
| MarketCap: 32300.4 Millions | |
| Recent Price: 26.07 Smart Investing & Trading Score: 50 | |
| Day Percent Change: -0.799087% Day Change: -0.27 | |
| Week Change: -2.50561% Year-to-date Change: -12.9% | |
| KHC Links: Profile News Message Board | |
| Charts:- Daily , Weekly | |
| Add KHC to Watchlist: View: Get Complete KHC Trend Analysis ➞ | |
 | MO Altria Group Inc |
| Sector: Consumer Staples | |
| SubSector: Tobacco | |
| MarketCap: 111797 Millions | |
| Recent Price: 65.75 Smart Investing & Trading Score: 40 | |
| Day Percent Change: -0.814602% Day Change: -0.3 | |
| Week Change: 0.951942% Year-to-date Change: 29.7% | |
| MO Links: Profile News Message Board | |
| Charts:- Daily , Weekly | |
| Add MO to Watchlist: View: Get Complete MO Trend Analysis ➞ | |
 | CL Colgate-Palmolive Co |
| Sector: Consumer Staples | |
| SubSector: Household & Personal Products | |
| MarketCap: 68803.8 Millions | |
| Recent Price: 78.31 Smart Investing & Trading Score: 0 | |
| Day Percent Change: -0.885964% Day Change: -0.47 | |
| Week Change: -3.4759% Year-to-date Change: -12.0% | |
| CL Links: Profile News Message Board | |
| Charts:- Daily , Weekly | |
| Add CL to Watchlist: View: Get Complete CL Trend Analysis ➞ | |
 | SO Southern Company |
| Sector: Utilities | |
| SubSector: Utilities - Regulated Electric | |
| MarketCap: 100962 Millions | |
| Recent Price: 93.89 Smart Investing & Trading Score: 40 | |
| Day Percent Change: -0.959916% Day Change: -1.05 | |
| Week Change: -0.550789% Year-to-date Change: 16.3% | |
| SO Links: Profile News Message Board | |
| Charts:- Daily , Weekly | |
| Add SO to Watchlist: View: Get Complete SO Trend Analysis ➞ | |
 | VZ Verizon Communications Inc |
| Sector: Technology | |
| SubSector: Telecom Services | |
| MarketCap: 187121 Millions | |
| Recent Price: 43.40 Smart Investing & Trading Score: 40 | |
| Day Percent Change: -0.981063% Day Change: -0.34 | |
| Week Change: 0.509495% Year-to-date Change: 13.5% | |
| VZ Links: Profile News Message Board | |
| Charts:- Daily , Weekly | |
| Add VZ to Watchlist: View: Get Complete VZ Trend Analysis ➞ | |
 | MS Morgan Stanley |
| Sector: Financials | |
| SubSector: Capital Markets | |
| MarketCap: 236401 Millions | |
| Recent Price: 155.30 Smart Investing & Trading Score: 20 | |
| Day Percent Change: -1.01345% Day Change: -1.4 | |
| Week Change: -1.63415% Year-to-date Change: 27.2% | |
| MS Links: Profile News Message Board | |
| Charts:- Daily , Weekly | |
| Add MS to Watchlist: View: Get Complete MS Trend Analysis ➞ | |
 | KO Coca-Cola Co |
| Sector: Consumer Staples | |
| SubSector: Beverages - Non-Alcoholic | |
| MarketCap: 292477 Millions | |
| Recent Price: 66.10 Smart Investing & Trading Score: 20 | |
| Day Percent Change: -1.01827% Day Change: -0.76 | |
| Week Change: -0.526712% Year-to-date Change: 8.4% | |
| KO Links: Profile News Message Board | |
| Charts:- Daily , Weekly | |
| Add KO to Watchlist: View: Get Complete KO Trend Analysis ➞ | |
 | JPM JPMorgan Chase & Co |
| Sector: Financials | |
| SubSector: Banks - Diversified | |
| MarketCap: 809472 Millions | |
| Recent Price: 307.55 Smart Investing & Trading Score: 30 | |
| Day Percent Change: -1.01703% Day Change: -3.39 | |
| Week Change: -1.87289% Year-to-date Change: 30.2% | |
| JPM Links: Profile News Message Board | |
| Charts:- Daily , Weekly | |
| Add JPM to Watchlist: View: Get Complete JPM Trend Analysis ➞ | |
 | TMO Thermo Fisher Scientific Inc |
| Sector: Health Care | |
| SubSector: Diagnostics & Research | |
| MarketCap: 186012 Millions | |
| Recent Price: 524.96 Smart Investing & Trading Score: 100 | |
| Day Percent Change: -1.08718% Day Change: -2.56 | |
| Week Change: 12.1709% Year-to-date Change: 0.6% | |
| TMO Links: Profile News Message Board | |
| Charts:- Daily , Weekly | |
| Add TMO to Watchlist: View: Get Complete TMO Trend Analysis ➞ | |
 | AMT American Tower Corp |
| Sector: Financials | |
| SubSector: REIT - Specialty | |
| MarketCap: 92863.6 Millions | |
| Recent Price: 191.17 Smart Investing & Trading Score: 10 | |
| Day Percent Change: -1.11215% Day Change: -1.69 | |
| Week Change: -0.912248% Year-to-date Change: 7.3% | |
| AMT Links: Profile News Message Board | |
| Charts:- Daily , Weekly | |
| Add AMT to Watchlist: View: Get Complete AMT Trend Analysis ➞ | |
 | DHR Danaher Corp |
| Sector: Health Care | |
| SubSector: Diagnostics & Research | |
| MarketCap: 143361 Millions | |
| Recent Price: 210.33 Smart Investing & Trading Score: 100 | |
| Day Percent Change: -1.19786% Day Change: -1.46 | |
| Week Change: 13.1354% Year-to-date Change: -8.2% | |
| DHR Links: Profile News Message Board | |
| Charts:- Daily , Weekly | |
| Add DHR to Watchlist: View: Get Complete DHR Trend Analysis ➞ | |
 | TMUS T-Mobile US Inc |
| Sector: Technology | |
| SubSector: Telecom Services | |
| MarketCap: 284461 Millions | |
| Recent Price: 230.14 Smart Investing & Trading Score: 0 | |
| Day Percent Change: -1.33756% Day Change: -2.58 | |
| Week Change: -3.46477% Year-to-date Change: 5.6% | |
| TMUS Links: Profile News Message Board | |
| Charts:- Daily , Weekly | |
| Add TMUS to Watchlist: View: Get Complete TMUS Trend Analysis ➞ | |
 | C Citigroup Inc |
| Sector: Financials | |
| SubSector: Banks - Diversified | |
| MarketCap: 175622 Millions | |
| Recent Price: 97.34 Smart Investing & Trading Score: 20 | |
| Day Percent Change: -1.3879% Day Change: -1.6 | |
| Week Change: -4.24004% Year-to-date Change: 42.2% | |
| C Links: Profile News Message Board | |
| Charts:- Daily , Weekly | |
| Add C to Watchlist: View: Get Complete C Trend Analysis ➞ | |
 | CMCSA Comcast Corp |
| Sector: Technology | |
| SubSector: Telecom Services | |
| MarketCap: 125203 Millions | |
| Recent Price: 30.40 Smart Investing & Trading Score: 0 | |
| Day Percent Change: -1.74531% Day Change: -0.22 | |
| Week Change: -3.8279% Year-to-date Change: -16.6% | |
| CMCSA Links: Profile News Message Board | |
| Charts:- Daily , Weekly | |
| Add CMCSA to Watchlist: View: Get Complete CMCSA Trend Analysis ➞ | |
 | PM Philip Morris International Inc |
| Sector: Consumer Staples | |
| SubSector: Tobacco | |
| MarketCap: 251467 Millions | |
| Recent Price: 157.91 Smart Investing & Trading Score: 0 | |
| Day Percent Change: -1.83389% Day Change: -1.89 | |
| Week Change: -3.1227% Year-to-date Change: 32.5% | |
| PM Links: Profile News Message Board | |
| Charts:- Daily , Weekly | |
| Add PM to Watchlist: View: Get Complete PM Trend Analysis ➞ | |
 | T AT&T, Inc |
| Sector: Technology | |
| SubSector: Telecom Services | |
| MarketCap: 211580 Millions | |
| Recent Price: 27.01 Smart Investing & Trading Score: 0 | |
| Day Percent Change: -1.96007% Day Change: -0.55 | |
| Week Change: -4.62571% Year-to-date Change: 22.3% | |
| T Links: Profile News Message Board | |
| Charts:- Daily , Weekly | |
| Add T to Watchlist: View: Get Complete T Trend Analysis ➞ | |
 | CHTR Charter Communications Inc |
| Sector: Technology | |
| SubSector: Telecom Services | |
| MarketCap: 39864.3 Millions | |
| Recent Price: 269.61 Smart Investing & Trading Score: 40 | |
| Day Percent Change: -1.99564% Day Change: -1.21 | |
| Week Change: 2.36152% Year-to-date Change: -22.8% | |
| CHTR Links: Profile News Message Board | |
| Charts:- Daily , Weekly | |
| Add CHTR to Watchlist: View: Get Complete CHTR Trend Analysis ➞ | |
 | COP Conoco Phillips |
| Sector: Energy | |
| SubSector: Oil & Gas E&P | |
| MarketCap: 116089 Millions | |
| Recent Price: 93.38 Smart Investing & Trading Score: 40 | |
| Day Percent Change: -2.17892% Day Change: -1.78 | |
| Week Change: -2.35282% Year-to-date Change: -5.1% | |
| COP Links: Profile News Message Board | |
| Charts:- Daily , Weekly | |
| Add COP to Watchlist: View: Get Complete COP Trend Analysis ➞ | |
 | MDLZ Mondelez International Inc |
| Sector: Consumer Staples | |
| SubSector: Confectioners | |
| MarketCap: 79888.2 Millions | |
| Recent Price: 61.78 Smart Investing & Trading Score: 0 | |
| Day Percent Change: -2.20041% Day Change: -1.1 | |
| Week Change: -4.05342% Year-to-date Change: 5.3% | |
| MDLZ Links: Profile News Message Board | |
| Charts:- Daily , Weekly | |
| Add MDLZ to Watchlist: View: Get Complete MDLZ Trend Analysis ➞ | |
 | ABBV Abbvie Inc |
| Sector: Health Care | |
| SubSector: Drug Manufacturers - General | |
| MarketCap: 375500 Millions | |
| Recent Price: 236.56 Smart Investing & Trading Score: 100 | |
| Day Percent Change: -3.19993% Day Change: -6.41 | |
| Week Change: 7.53216% Year-to-date Change: 35.5% | |
| ABBV Links: Profile News Message Board | |
| Charts:- Daily , Weekly | |
| Add ABBV to Watchlist: View: Get Complete ABBV Trend Analysis ➞ | |
 | GM General Motors Company |
| Sector: Services & Goods | |
| SubSector: Auto Manufacturers | |
| MarketCap: 55477.6 Millions | |
| Recent Price: 59.36 Smart Investing & Trading Score: 50 | |
| Day Percent Change: -3.22791% Day Change: -1.63 | |
| Week Change: -0.934579% Year-to-date Change: 16.2% | |
| GM Links: Profile News Message Board | |
| Charts:- Daily , Weekly | |
| Add GM to Watchlist: View: Get Complete GM Trend Analysis ➞ | |
 | BMY Bristol-Myers Squibb Co |
| Sector: Health Care | |
| SubSector: Drug Manufacturers - General | |
| MarketCap: 95950.5 Millions | |
| Recent Price: 45.73 Smart Investing & Trading Score: 80 | |
| Day Percent Change: -3.58423% Day Change: -1.45 | |
| Week Change: 3.55525% Year-to-date Change: -16.6% | |
| BMY Links: Profile News Message Board | |
| Charts:- Daily , Weekly | |
| Add BMY to Watchlist: View: Get Complete BMY Trend Analysis ➞ | |
| For tabular summary view of above stock list: Summary View ➞ 0 - 25 , 25 - 50 , 50 - 75 , 75 - 100 , 100 - 125 | ||
| Click To Change The Sort Order: By Market Cap or Company Size Performance: Year-to-date, Week and Day | |
| Select Chart Type: | ||
|
Best Stocks Today 12Stocks.com |
� 2025 12Stocks.com Terms & Conditions Privacy Contact Us
All Information Provided Only For Education And Not To Be Used For Investing or Trading. See Terms & Conditions


One More Thing ... Get Best Stocks Delivered Daily!
Never Ever Miss A Move With Our Top Ten Stocks Lists
Find Best Stocks In Any Market - Bull or Bear Market
Take A Peek At Our Top Ten Stocks Lists: Daily, Weekly, Year-to-Date & Top Trends
Find Best Stocks In Any Market - Bull or Bear Market
Take A Peek At Our Top Ten Stocks Lists: Daily, Weekly, Year-to-Date & Top Trends
S&P 100 Stocks With Best Up Trends [0-bearish to 100-bullish]: Intel Corp[100], Caterpillar [100], Unitedhealth [100], Fedex Corp[100], NVIDIA Corp[100], CVS Health[100], General Dynamics[100], Johnson & Johnson[100], AMGEN [100], Ford Motor[100], Pfizer [100]
Best S&P 100 Stocks Year-to-Date:
Intel Corp[84.4708%], CVS Health[81.156%], GE Aerospace[78.2112%], Oracle Corp[75.3817%], Broadcom [46.567%], Citi [42.1898%], Advanced Micro[40.703%], Bank Of[39.805%], Caterpillar [38.0414%], Goldman Sachs[36.9027%], NVIDIA Corp[36.6279%] Best S&P 100 Stocks This Week:
Intel Corp[19.4747%], Danaher Corp[13.1354%], Pfizer [12.4118%], Merck & Co[12.3509%], Thermo Fisher[12.1709%], Lilly(Eli) & Co[10.5143%], Abbvie [7.53216%], Business[7.17303%], NVIDIA Corp[6.76386%], AMGEN [6.51099%], NextEra Energy[5.89191%] Best S&P 100 Stocks Daily:
Intel Corp[3.78408%], Advanced Micro[3.48759%], PayPal [3.40534%], Dow [2.77657%], Starbucks Corp[2.76066%], Adobe [2.27802%], Deere & Co[2.23364%], Caterpillar [2.02779%], 3M Co[1.79487%], Blackrock [1.70629%], Unitedhealth [1.55613%]