
 Login Sign Up


| |||||
 |  | ||||

| 12Stocks.com Market Intelligence |
Best S&P 100 Stocks
| In a hurry? S&P 100 Stocks Lists: Performance Trends Table, Stock Charts
Sort S&P 100 stocks: Daily, Weekly, Year-to-Date, Market Cap & Trends. |
| 12Stocks.com S&P 100 Stocks Performances & Trends Daily | |||||||||
|
|  The overall Smart Investing & Trading Score is 60 (0-bearish to 100-bullish) which puts S&P 100 index in short term neutral to bullish trend. The Smart Investing & Trading Score from previous trading session is 30 and hence an improvement of trend.
| ||||||||
Here are the Smart Investing & Trading Scores of the most requested S&P 100 stocks at 12Stocks.com (click stock name for detailed review):
|


| 12Stocks.com: Top Performing S&P 100 Index Stocks | ||||||||||||||||||||||||||||||||||||||||||||||||
 The top performing S&P 100 Index stocks year to date are
Now, more recently, over last week, the top performing S&P 100 Index stocks on the move are


|
||||||||||||||||||||||||||||||||||||||||||||||||
| 12Stocks.com: Investing in S&P 100 Index with Stocks | |
|
The following table helps investors and traders sort through current performance and trends (as measured by Smart Investing & Trading Score) of various
stocks in the S&P 100 Index. Quick View: Move mouse or cursor over stock symbol (ticker) to view short-term technical chart and over stock name to view long term chart. Click on  to add stock symbol to your watchlist and to add stock symbol to your watchlist and  to view watchlist. Click on any ticker or stock name for detailed market intelligence report for that stock. to view watchlist. Click on any ticker or stock name for detailed market intelligence report for that stock. |
12Stocks.com Performance of Stocks in S&P 100 Index
| Ticker | Stock Name | Watchlist | Category | Recent Price | Smart Investing & Trading Score | Change % | YTD Change% |
| DUK | Duke Energy |   | Utilities | 121.5 | 20 | -0.32% | 10.49% |
| LOW | Lowe s | | Services & Goods | 260.68 | 90 | 0.75% | 1.31% |
| TGT | Target | | Services & Goods | 92.35 | 0 | -0.10% | -31.69% |
| MS | Morgan Stanley | | Financials | 148.53 | 60 | -0.21% | 8.91% |
| GS | Goldman Sachs | | Financials | 730.56 | 30 | -0.04% | 15.22% |
| SO | Southern | | Utilities | 91.66 | 0 | -0.47% | 11.04% |
| BKNG | Booking | | Services & Goods | 5582.95 | 30 | 1.41% | 18.29% |
| AMD | Advanced Micro | | Technology | 161.25 | 20 | -0.66% | 39.07% |
| SCHW | Charles Schwab | | Financials | 95.45 | 60 | -0.70% | 16.47% |
| DE | Deere & | | Industrials | 468.5 | 0 | -1.74% | -1.04% |
| GD | General Dynamics | | Industrials | 322.81 | 80 | -0.49% | 26.96% |
| EXC | Exelon | | Utilities | 43.38 | 10 | 0.02% | 11.42% |
| COP | ConocoPhillips | | Energy | 94.65 | 30 | -4.38% | -2.63% |
| FDX | FedEx | | Transports | 225.34 | 0 | 0.52% | -13.91% |
| KHC | Kraft Heinz | | Consumer Staples | 26.93 | 10 | 3.50% | -7.21% |
| EMR | Emerson Electric | | Industrials | 129.21 | 0 | -1.65% | 0.29% |
| BK | Bank of New York | | Financials | 103.86 | 60 | -0.80% | 22.29% |
| GM | General Motors | | Consumer Staples | 57.75 | 70 | -1.33% | 17.43% |
| MET | MetLife | | Financials | 80.38 | 50 | -0.22% | -5.07% |
| DOW | Dow | | Materials | 23.99 | 20 | -1.72% | -35.87% |
| COF | Capital One | | Financials | 221.33 | 40 | -0.87% | 9.32% |
| AIG | American | | Financials | 81.34 | 10 | 0.36% | 11.55% |
| F | Ford Motor | | Consumer Staples | 11.62 | 50 | -0.85% | 22.40% |
| SPG | Simon Property | | Financials | 179.86 | 100 | 0.55% | 6.11% |
| SPY | SPDR S&P | | Utilities | 643.74 | 70 | 0.54% | 7.61% |
| For chart view version of above stock list: Chart View ➞ 0 - 25 , 25 - 50 , 50 - 75 , 75 - 100 , 100 - 125 | ||
 | Click To Change The Sort Order: By Market Cap or Company Size Performance: Year-to-date, Week and Day |  |
|
Get the most comprehensive stock market coverage daily at 12Stocks.com ➞ Best Stocks Today ➞ Best Stocks Weekly ➞ Best Stocks Year-to-Date ➞ Best Stocks Trends ➞  Best Stocks Today 12Stocks.com Best Nasdaq Stocks ➞ Best S&P 500 Stocks ➞ Best Tech Stocks ➞ Best Biotech Stocks ➞ |
| Detailed Overview of S&P 100 Stocks |
| S&P 100 Technical Overview, Leaders & Laggards, Top S&P 100 ETF Funds & Detailed S&P 100 Stocks List, Charts, Trends & More |
| S&P 100: Technical Analysis, Trends & YTD Performance | |
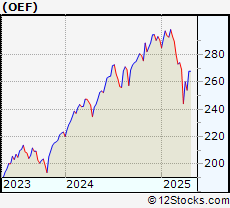
| S&P 100 index as represented by
OEF, an exchange-traded fund [ETF], holds basket of one hundred US (mostly largecap) stocks from across all major sectors of the US stock market. The S&P 100 index (contains stocks like Apple and Exxon) is up by 8.89% and is currently outperforming the overall market by 1.92% year-to-date. Below is a quick view of technical charts and trends: | |
 OEF Weekly Chart |
|
| Long Term Trend: Very Good | |
| Medium Term Trend: Deteriorating | |
 OEF Daily Chart |
|
| Short Term Trend: Not Good | |
| Overall Trend Score: 60 | |
| YTD Performance: 8.89% | |
| **Trend Scores & Views Are Only For Educational Purposes And Not For Investing | |
| 12Stocks.com: Investing in S&P 100 Index using Exchange Traded Funds | |
|
The following table shows list of key exchange traded funds (ETF) that
help investors track S&P 100 index. We have also included ETF funds that track S&P 500 index since it is market-cap weighted. The following list also includes leveraged ETF funds that track twice or thrice the daily returns of S&P 100 indices. Short or inverse ETF funds move in the opposite direction to the index they track and are useful during market pullbacks or during bear markets. Quick View: Move mouse or cursor over ETF symbol (ticker) to view short-term technical chart and over ETF name to view long term chart. Click on ticker or stock name for detailed view. Click on to add stock symbol to your watchlist and to view watchlist. |
12Stocks.com List of ETFs that track S&P 100 Index
| Ticker | ETF Name | Watchlist | Recent Price | Smart Investing & Trading Score | Change % | Week % | Year-to-date % |
| SPY | SPDR S&P 500 ETF | | 643.74 | 70 | 0.54 | -0.2 | 7.61% |
| SPXS | Direxion Daily S&P 500 Bear 3X ETF | | 4.21 | 60 | 1.38 | 5.01 | -28.57% |
| SPXU | ProShares UltraPro Short S&P500 | | 15.17 | 60 | -1.49 | 0.8 | -25.94% |
| SDS | ProShares UltraShort S&P500 | | 15.62 | 60 | -0.95 | 0.45 | -14.99% |
| VOO | Vanguard 500 ETF | | 593.08 | 70 | -0.39 | -1.45 | 9.15% |
| SH | ProShares Short S&P500 | | 38.59 | 50 | -0.46 | 0.29 | -5.35% |
| UPRO | ProShares UltraPro S&P500 | | 100.87 | 60 | 1.5 | -0.75 | 7.19% |
| SPXL | Direxion Daily S&P500 Bull 3X ETF | | 193.01 | 60 | -1.22 | -4.54 | 10.56% |
| SSO | ProShares Ultra S&P500 | | 104.75 | 60 | 1.02 | -0.5 | 8.55% |
| OEF | iShares S&P 100 | | 319.69 | 60 | 1.47 | -0.41 | 8.89% |
| 12Stocks.com: Charts, Trends, Fundamental Data and Performances of S&P 100 Stocks | |
|
We now take in-depth look at all S&P 100 stocks including charts, multi-period performances and overall trends (as measured by Smart Investing & Trading Score). One can sort S&P 100 stocks (click link to choose) by Daily, Weekly and by Year-to-Date performances. Also, one can sort by size of the company or by market capitalization. |
| Select Your Default Chart Type: | |||||
| |||||
| Click on stock symbol or name for detailed view. Click on to add stock symbol to your watchlist and to view watchlist. Quick View: Move mouse or cursor over "Daily" to quickly view daily technical stock chart and over "Weekly" to view weekly technical stock chart. | |||||

 | DUK Duke Energy Corporation |
| Sector: Utilities | |
| SubSector: Electric Utilities | |
| MarketCap: 56678.2 Millions | |
| Recent Price: 121.5 Smart Investing & Trading Score: 20 | |
| Day Percent Change: -0.32% Day Change: -0.39 | |
| Week Change: -0.81% Year-to-date Change: 10.5% | |
| DUK Links: Profile News Message Board | |
| Charts:- Daily , Weekly | |
| Add DUK to Watchlist: View: Get Complete DUK Trend Analysis ➞ | |
 | LOW Lowe s Companies, Inc. |
| Sector: Services & Goods | |
| SubSector: Home Improvement Stores | |
| MarketCap: 56084.2 Millions | |
| Recent Price: 260.68 Smart Investing & Trading Score: 90 | |
| Day Percent Change: 0.75% Day Change: 1.94 | |
| Week Change: 1.02% Year-to-date Change: 1.3% | |
| LOW Links: Profile News Message Board | |
| Charts:- Daily , Weekly | |
| Add LOW to Watchlist: View: Get Complete LOW Trend Analysis ➞ | |
 | TGT Target Corporation |
| Sector: Services & Goods | |
| SubSector: Discount, Variety Stores | |
| MarketCap: 55980.6 Millions | |
| Recent Price: 92.35 Smart Investing & Trading Score: 0 | |
| Day Percent Change: -0.1% Day Change: -0.09 | |
| Week Change: -3.78% Year-to-date Change: -31.7% | |
| TGT Links: Profile News Message Board | |
| Charts:- Daily , Weekly | |
| Add TGT to Watchlist: View: Get Complete TGT Trend Analysis ➞ | |
 | MS Morgan Stanley |
| Sector: Financials | |
| SubSector: Investment Brokerage - National | |
| MarketCap: 55876.7 Millions | |
| Recent Price: 148.53 Smart Investing & Trading Score: 60 | |
| Day Percent Change: -0.21% Day Change: -0.32 | |
| Week Change: -1.3% Year-to-date Change: 8.9% | |
| MS Links: Profile News Message Board | |
| Charts:- Daily , Weekly | |
| Add MS to Watchlist: View: Get Complete MS Trend Analysis ➞ | |
 | GS The Goldman Sachs Group, Inc. |
| Sector: Financials | |
| SubSector: Investment Brokerage - National | |
| MarketCap: 54579.3 Millions | |
| Recent Price: 730.56 Smart Investing & Trading Score: 30 | |
| Day Percent Change: -0.04% Day Change: -0.29 | |
| Week Change: -1.97% Year-to-date Change: 15.2% | |
| GS Links: Profile News Message Board | |
| Charts:- Daily , Weekly | |
| Add GS to Watchlist: View: Get Complete GS Trend Analysis ➞ | |
 | SO The Southern Company |
| Sector: Utilities | |
| SubSector: Electric Utilities | |
| MarketCap: 54483.6 Millions | |
| Recent Price: 91.66 Smart Investing & Trading Score: 0 | |
| Day Percent Change: -0.47% Day Change: -0.43 | |
| Week Change: -0.69% Year-to-date Change: 11.0% | |
| SO Links: Profile News Message Board | |
| Charts:- Daily , Weekly | |
| Add SO to Watchlist: View: Get Complete SO Trend Analysis ➞ | |
 | BKNG Booking Holdings Inc. |
| Sector: Services & Goods | |
| SubSector: Business Services | |
| MarketCap: 54467.9 Millions | |
| Recent Price: 5582.95 Smart Investing & Trading Score: 30 | |
| Day Percent Change: 1.41% Day Change: 77.4 | |
| Week Change: -0.29% Year-to-date Change: 18.3% | |
| BKNG Links: Profile News Message Board | |
| Charts:- Daily , Weekly | |
| Add BKNG to Watchlist: View: Get Complete BKNG Trend Analysis ➞ | |
 | AMD Advanced Micro Devices, Inc. |
| Sector: Technology | |
| SubSector: Semiconductor - Broad Line | |
| MarketCap: 54275.1 Millions | |
| Recent Price: 161.25 Smart Investing & Trading Score: 20 | |
| Day Percent Change: -0.66% Day Change: -1.07 | |
| Week Change: -0.85% Year-to-date Change: 39.1% | |
| AMD Links: Profile News Message Board | |
| Charts:- Daily , Weekly | |
| Add AMD to Watchlist: View: Get Complete AMD Trend Analysis ➞ | |
 | SCHW The Charles Schwab Corporation |
| Sector: Financials | |
| SubSector: Investment Brokerage - National | |
| MarketCap: 45115.8 Millions | |
| Recent Price: 95.45 Smart Investing & Trading Score: 60 | |
| Day Percent Change: -0.7% Day Change: -0.67 | |
| Week Change: -0.41% Year-to-date Change: 16.5% | |
| SCHW Links: Profile News Message Board | |
| Charts:- Daily , Weekly | |
| Add SCHW to Watchlist: View: Get Complete SCHW Trend Analysis ➞ | |
 | DE Deere & Company |
| Sector: Industrials | |
| SubSector: Farm & Construction Machinery | |
| MarketCap: 39168.7 Millions | |
| Recent Price: 468.5 Smart Investing & Trading Score: 0 | |
| Day Percent Change: -1.74% Day Change: -8.28 | |
| Week Change: -2.12% Year-to-date Change: -1.0% | |
| DE Links: Profile News Message Board | |
| Charts:- Daily , Weekly | |
| Add DE to Watchlist: View: Get Complete DE Trend Analysis ➞ | |
 | GD General Dynamics Corporation |
| Sector: Industrials | |
| SubSector: Aerospace/Defense Products & Services | |
| MarketCap: 37063.8 Millions | |
| Recent Price: 322.81 Smart Investing & Trading Score: 80 | |
| Day Percent Change: -0.49% Day Change: -1.58 | |
| Week Change: -0.54% Year-to-date Change: 27.0% | |
| GD Links: Profile News Message Board | |
| Charts:- Daily , Weekly | |
| Add GD to Watchlist: View: Get Complete GD Trend Analysis ➞ | |
 | EXC Exelon Corporation |
| Sector: Utilities | |
| SubSector: Diversified Utilities | |
| MarketCap: 34091.9 Millions | |
| Recent Price: 43.38 Smart Investing & Trading Score: 10 | |
| Day Percent Change: 0.02% Day Change: 0.01 | |
| Week Change: -0.69% Year-to-date Change: 11.4% | |
| EXC Links: Profile News Message Board | |
| Charts:- Daily , Weekly | |
| Add EXC to Watchlist: View: Get Complete EXC Trend Analysis ➞ | |
 | COP ConocoPhillips |
| Sector: Energy | |
| SubSector: Independent Oil & Gas | |
| MarketCap: 33504.3 Millions | |
| Recent Price: 94.65 Smart Investing & Trading Score: 30 | |
| Day Percent Change: -4.38% Day Change: -4.34 | |
| Week Change: -4.36% Year-to-date Change: -2.6% | |
| COP Links: Profile News Message Board | |
| Charts:- Daily , Weekly | |
| Add COP to Watchlist: View: Get Complete COP Trend Analysis ➞ | |
 | FDX FedEx Corporation |
| Sector: Transports | |
| SubSector: Air Delivery & Freight Services | |
| MarketCap: 33188 Millions | |
| Recent Price: 225.34 Smart Investing & Trading Score: 0 | |
| Day Percent Change: 0.52% Day Change: 1.16 | |
| Week Change: -2.48% Year-to-date Change: -13.9% | |
| FDX Links: Profile News Message Board | |
| Charts:- Daily , Weekly | |
| Add FDX to Watchlist: View: Get Complete FDX Trend Analysis ➞ | |
 | KHC The Kraft Heinz Company |
| Sector: Consumer Staples | |
| SubSector: Food - Major Diversified | |
| MarketCap: 32096.3 Millions | |
| Recent Price: 26.93 Smart Investing & Trading Score: 10 | |
| Day Percent Change: 3.5% Day Change: 0.91 | |
| Week Change: -3.72% Year-to-date Change: -7.2% | |
| KHC Links: Profile News Message Board | |
| Charts:- Daily , Weekly | |
| Add KHC to Watchlist: View: Get Complete KHC Trend Analysis ➞ | |
 | EMR Emerson Electric Co. |
| Sector: Industrials | |
| SubSector: Industrial Electrical Equipment | |
| MarketCap: 30457.9 Millions | |
| Recent Price: 129.21 Smart Investing & Trading Score: 0 | |
| Day Percent Change: -1.65% Day Change: -2.17 | |
| Week Change: -2.11% Year-to-date Change: 0.3% | |
| EMR Links: Profile News Message Board | |
| Charts:- Daily , Weekly | |
| Add EMR to Watchlist: View: Get Complete EMR Trend Analysis ➞ | |
 | BK The Bank of New York Mellon Corporation |
| Sector: Financials | |
| SubSector: Asset Management | |
| MarketCap: 29807.5 Millions | |
| Recent Price: 103.86 Smart Investing & Trading Score: 60 | |
| Day Percent Change: -0.8% Day Change: -0.84 | |
| Week Change: -1.65% Year-to-date Change: 22.3% | |
| BK Links: Profile News Message Board | |
| Charts:- Daily , Weekly | |
| Add BK to Watchlist: View: Get Complete BK Trend Analysis ➞ | |
 | GM General Motors Company |
| Sector: Consumer Staples | |
| SubSector: Auto Manufacturers - Major | |
| MarketCap: 29252.4 Millions | |
| Recent Price: 57.75 Smart Investing & Trading Score: 70 | |
| Day Percent Change: -1.33% Day Change: -0.78 | |
| Week Change: -1.43% Year-to-date Change: 17.4% | |
| GM Links: Profile News Message Board | |
| Charts:- Daily , Weekly | |
| Add GM to Watchlist: View: Get Complete GM Trend Analysis ➞ | |
 | MET MetLife, Inc. |
| Sector: Financials | |
| SubSector: Life Insurance | |
| MarketCap: 26272.9 Millions | |
| Recent Price: 80.38 Smart Investing & Trading Score: 50 | |
| Day Percent Change: -0.22% Day Change: -0.18 | |
| Week Change: -1.2% Year-to-date Change: -5.1% | |
| MET Links: Profile News Message Board | |
| Charts:- Daily , Weekly | |
| Add MET to Watchlist: View: Get Complete MET Trend Analysis ➞ | |
 | DOW Dow Inc. |
| Sector: Materials | |
| SubSector: Chemicals - Major Diversified | |
| MarketCap: 24098.6 Millions | |
| Recent Price: 23.99 Smart Investing & Trading Score: 20 | |
| Day Percent Change: -1.72% Day Change: -0.42 | |
| Week Change: -2.6% Year-to-date Change: -35.9% | |
| DOW Links: Profile News Message Board | |
| Charts:- Daily , Weekly | |
| Add DOW to Watchlist: View: Get Complete DOW Trend Analysis ➞ | |
 | COF Capital One Financial Corporation |
| Sector: Financials | |
| SubSector: Credit Services | |
| MarketCap: 23094.2 Millions | |
| Recent Price: 221.33 Smart Investing & Trading Score: 40 | |
| Day Percent Change: -0.87% Day Change: -1.94 | |
| Week Change: -2.59% Year-to-date Change: 9.3% | |
| COF Links: Profile News Message Board | |
| Charts:- Daily , Weekly | |
| Add COF to Watchlist: View: Get Complete COF Trend Analysis ➞ | |
 | AIG American International Group, Inc. |
| Sector: Financials | |
| SubSector: Property & Casualty Insurance | |
| MarketCap: 21219 Millions | |
| Recent Price: 81.34 Smart Investing & Trading Score: 10 | |
| Day Percent Change: 0.36% Day Change: 0.29 | |
| Week Change: 0.02% Year-to-date Change: 11.6% | |
| AIG Links: Profile News Message Board | |
| Charts:- Daily , Weekly | |
| Add AIG to Watchlist: View: Get Complete AIG Trend Analysis ➞ | |
 | F Ford Motor Company |
| Sector: Consumer Staples | |
| SubSector: Auto Manufacturers - Major | |
| MarketCap: 19052.1 Millions | |
| Recent Price: 11.62 Smart Investing & Trading Score: 50 | |
| Day Percent Change: -0.85% Day Change: -0.1 | |
| Week Change: -1.27% Year-to-date Change: 22.4% | |
| F Links: Profile News Message Board | |
| Charts:- Daily , Weekly | |
| Add F to Watchlist: View: Get Complete F Trend Analysis ➞ | |
 | SPG Simon Property Group, Inc. |
| Sector: Financials | |
| SubSector: REIT - Retail | |
| MarketCap: 17959.6 Millions | |
| Recent Price: 179.86 Smart Investing & Trading Score: 100 | |
| Day Percent Change: 0.55% Day Change: 0.99 | |
| Week Change: -0.44% Year-to-date Change: 6.1% | |
| SPG Links: Profile News Message Board | |
| Charts:- Daily , Weekly | |
| Add SPG to Watchlist: View: Get Complete SPG Trend Analysis ➞ | |
 | SPY SPDR S&P 500 ETF |
| Sector: Utilities | |
| SubSector: Exchange Traded Fund | |
| MarketCap: 0 Millions | |
| Recent Price: 643.74 Smart Investing & Trading Score: 70 | |
| Day Percent Change: 0.54% Day Change: 3.47 | |
| Week Change: -0.2% Year-to-date Change: 7.6% | |
| SPY Links: Profile News Message Board | |
| Charts:- Daily , Weekly | |
| Add SPY to Watchlist: View: Get Complete SPY Trend Analysis ➞ | |
| For tabular summary view of above stock list: Summary View ➞ 0 - 25 , 25 - 50 , 50 - 75 , 75 - 100 , 100 - 125 | ||
| Click To Change The Sort Order: By Market Cap or Company Size Performance: Year-to-date, Week and Day | |
| Select Chart Type: | ||
|
Best Stocks Today 12Stocks.com |
� 2025 12Stocks.com Terms & Conditions Privacy Contact Us
All Information Provided Only For Education And Not To Be Used For Investing or Trading. See Terms & Conditions


One More Thing ... Get Best Stocks Delivered Daily!
Never Ever Miss A Move With Our Top Ten Stocks Lists
Find Best Stocks In Any Market - Bull or Bear Market
Take A Peek At Our Top Ten Stocks Lists: Daily, Weekly, Year-to-Date & Top Trends
Find Best Stocks In Any Market - Bull or Bear Market
Take A Peek At Our Top Ten Stocks Lists: Daily, Weekly, Year-to-Date & Top Trends
S&P 100 Stocks With Best Up Trends [0-bearish to 100-bullish]: Google [100], Google [100], Apple [100], Simon Property[100], McDonald s[100], Lowe s[90], Mastercard [90], AbbVie [90], CVS Health[90], General Electric[80], Johnson & Johnson[80]
Best S&P 100 Stocks Year-to-Date:
NVIDIA [42.12%], Advanced Micro[39.07%], Broadcom [36.85%], General Electric[36%], CVS Health[32.58%], Oracle [32.15%], Altria [32.12%], Boeing [31.65%], Philip Morris[27.42%], General Dynamics[26.96%], Netflix [25.54%] Best S&P 100 Stocks This Week:
Google [8.34%], Google [8.23%], Apple [2.73%], Walmart [2.54%], Netflix [1.48%], Broadcom [1.27%], Lowe s[1.02%], McDonald s[0.91%], Eli Lilly[0.72%], Procter & Gamble[0.72%], AbbVie [0.69%] Best S&P 100 Stocks Daily:
Google [9.14%], Google [9.01%], Apple [3.81%], Kraft Heinz[3.5%], Walmart [1.62%], iShares S&P[1.47%], Tesla [1.44%], salesforce.com [1.42%], Booking [1.41%], Costco Wholesale[1.17%], Business[1.08%]