
 Login Sign Up


| |||||
 |  | ||||

| 12Stocks.com Market Intelligence |
Best S&P 100 Stocks
| In a hurry? S&P 100 Stocks Lists: Performance Trends Table, Stock Charts
Sort S&P 100 stocks: Daily, Weekly, Year-to-Date, Market Cap & Trends. |
| 12Stocks.com S&P 100 Stocks Performances & Trends Daily | |||||||||
|
|  The overall Smart Investing & Trading Score is 90 (0-bearish to 100-bullish) which puts S&P 100 index in short term bullish trend. The Smart Investing & Trading Score from previous trading session is 100 and a deterioration of trend continues.
| ||||||||
Here are the Smart Investing & Trading Scores of the most requested S&P 100 stocks at 12Stocks.com (click stock name for detailed review):
|


| 12Stocks.com: Top Performing S&P 100 Index Stocks | ||||||||||||||||||||||||||||||||||||||||||||||||
 The top performing S&P 100 Index stocks year to date are
Now, more recently, over last week, the top performing S&P 100 Index stocks on the move are


|
||||||||||||||||||||||||||||||||||||||||||||||||
| 12Stocks.com: Investing in S&P 100 Index with Stocks | |
|
The following table helps investors and traders sort through current performance and trends (as measured by Smart Investing & Trading Score) of various
stocks in the S&P 100 Index. Quick View: Move mouse or cursor over stock symbol (ticker) to view short-term technical chart and over stock name to view long term chart. Click on  to add stock symbol to your watchlist and to add stock symbol to your watchlist and  to view watchlist. Click on any ticker or stock name for detailed market intelligence report for that stock. to view watchlist. Click on any ticker or stock name for detailed market intelligence report for that stock. |
12Stocks.com Performance of Stocks in S&P 100 Index
| Ticker | Stock Name | Watchlist | Category | Recent Price | Smart Investing & Trading Score | Change % | YTD Change% |
| KO | Coca-Cola Co |   | Consumer Staples | 67.96 | 0 | -0.42% | 8.61% |
| UNH | Unitedhealth | | Health Care | 315.39 | 80 | 1.61% | -41.20% |
| TMUS | T-Mobile US | | Technology | 251.93 | 60 | -0.08% | 8.90% |
| CSCO | Cisco Systems | | Technology | 66.9 | 10 | -1.60% | 11.80% |
| WFC | Wells Fargo | | Financials | 78.96 | 20 | -3.51% | 1.84% |
| PM | Philip Morris | | Consumer Staples | 161.55 | 0 | 0.25% | 26.12% |
| AMD | Advanced Micro | | Technology | 151.34 | 20 | -6.46% | 30.52% |
| CRM | Salesforce | | Technology | 250.76 | 50 | 2.77% | -26.38% |
| MS | Morgan Stanley | | Financials | 148.09 | 40 | -1.62% | 8.59% |
| IBM | Business | | Technology | 248.53 | 70 | 0.55% | -0.84% |
| ABT | Abbott | | Health Care | 132.94 | 60 | 0.10% | 4.87% |
| AXP | American Express | | Financials | 326.22 | 70 | -1.34% | 3.36% |
| MCD | McDonald's Corp | | Services & Goods | 314.38 | 60 | -0.82% | 10.14% |
| GS | Goldman Sachs | | Financials | 738.21 | 60 | -1.43% | 16.42% |
| LIN | Linde | | Materials | 467.07 | 20 | -1.13% | 5.38% |
| DIS | Walt Disney | | Technology | 117.91 | 40 | -0.76% | 4.73% |
| MRK | Merck & Co | | Health Care | 84.71 | 70 | 0.79% | -12.67% |
| T | AT&T | | Technology | 29.59 | 90 | 0.03% | 27.28% |
| PEP | PepsiCo | | Consumer Staples | 146.39 | 40 | -0.34% | -0.92% |
| CAT | Caterpillar | | Industrials | 423.08 | 80 | 0.68% | 14.89% |
| VZ | Verizon | | Technology | 44.38 | 80 | 0.45% | 16.33% |
| TMO | Thermo Fisher | | Health Care | 490.2 | 90 | 0.15% | -17.84% |
| BLK | Blackrock | | Financials | 1099.15 | 20 | -0.87% | 3.30% |
| BKNG | Booking | | Services & Goods | 5505.8 | 40 | -1.43% | 16.65% |
| C | Citi | | Financials | 95.4 | 80 | -1.73% | 19.69% |
| For chart view version of above stock list: Chart View ➞ 0 - 25 , 25 - 50 , 50 - 75 , 75 - 100 , 100 - 125 | ||
 | Click To Change The Sort Order: By Market Cap or Company Size Performance: Year-to-date, Week and Day |  |
|
Get the most comprehensive stock market coverage daily at 12Stocks.com ➞ Best Stocks Today ➞ Best Stocks Weekly ➞ Best Stocks Year-to-Date ➞ Best Stocks Trends ➞  Best Stocks Today 12Stocks.com Best Nasdaq Stocks ➞ Best S&P 500 Stocks ➞ Best Tech Stocks ➞ Best Biotech Stocks ➞ |
| Detailed Overview of S&P 100 Stocks |
| S&P 100 Technical Overview, Leaders & Laggards, Top S&P 100 ETF Funds & Detailed S&P 100 Stocks List, Charts, Trends & More |
| S&P 100: Technical Analysis, Trends & YTD Performance | |
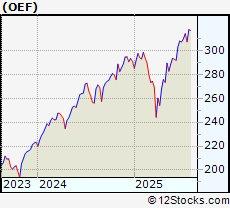
| S&P 100 index as represented by
OEF, an exchange-traded fund [ETF], holds basket of one hundred US (mostly largecap) stocks from across all major sectors of the US stock market. The S&P 100 index (contains stocks like Apple and Exxon) is up by 8.89% and is currently outperforming the overall market by 1.17% year-to-date. Below is a quick view of technical charts and trends: | |
 OEF Weekly Chart |
|
| Long Term Trend: Very Good | |
| Medium Term Trend: Good | |
 OEF Daily Chart |
|
| Short Term Trend: Very Good | |
| Overall Trend Score: 90 | |
| YTD Performance: 8.89% | |
| **Trend Scores & Views Are Only For Educational Purposes And Not For Investing | |
| 12Stocks.com: Investing in S&P 100 Index using Exchange Traded Funds | |
|
The following table shows list of key exchange traded funds (ETF) that
help investors track S&P 100 index. We have also included ETF funds that track S&P 500 index since it is market-cap weighted. The following list also includes leveraged ETF funds that track twice or thrice the daily returns of S&P 100 indices. Short or inverse ETF funds move in the opposite direction to the index they track and are useful during market pullbacks or during bear markets. Quick View: Move mouse or cursor over ETF symbol (ticker) to view short-term technical chart and over ETF name to view long term chart. Click on ticker or stock name for detailed view. Click on to add stock symbol to your watchlist and to view watchlist. |
12Stocks.com List of ETFs that track S&P 100 Index
| Ticker | ETF Name | Watchlist | Recent Price | Smart Investing & Trading Score | Change % | Week % | Year-to-date % |
| SPY | SPDR S&P 500 ETF Trust | | 647.24 | 80 | -0.29 | 0.3 | 8.19% |
| SPXS | Direxion Daily S&P 500 Bear -3X Shares | | 4.21 | 30 | 1.38 | 5.01 | -28.57% |
| SPXU | ProShares UltraPro Short S&P 500 | | 14.94 | 20 | 1.01 | -0.4 | -27.06% |
| SDS | ProShares UltraShort S&P500 -2x Shares | | 15.46 | 20 | 0.65 | -0.26 | -15.86% |
| UPRO | ProShares UltraPro S&P 500 ETF 3x Shares | | 102.38 | 80 | -0.97 | 0.39 | 8.8% |
| VOO | Vanguard S&P 500 ETF | | 593.08 | 80 | -0.39 | -1.45 | 9.15% |
| SH | ProShares Short S&P500 -1x Shares | | 38.39 | 20 | 0.31 | -0.03 | -5.84% |
| SPXL | Direxion Daily S&P 500 Bull 3X Shares | | 193.01 | 80 | -1.22 | -4.54 | 10.56% |
| SSO | ProShares Ultra S&P500 2x Shares | | 105.86 | 80 | -0.58 | 0.37 | 9.7% |
| OEF | iShares S&P 100 ETF | | 319.69 | 90 | 1.47 | -0.41 | 8.89% |
| 12Stocks.com: Charts, Trends, Fundamental Data and Performances of S&P 100 Stocks | |
|
We now take in-depth look at all S&P 100 stocks including charts, multi-period performances and overall trends (as measured by Smart Investing & Trading Score). One can sort S&P 100 stocks (click link to choose) by Daily, Weekly and by Year-to-Date performances. Also, one can sort by size of the company or by market capitalization. |
| Select Your Default Chart Type: | |||||
| |||||
| Click on stock symbol or name for detailed view. Click on to add stock symbol to your watchlist and to view watchlist. Quick View: Move mouse or cursor over "Daily" to quickly view daily technical stock chart and over "Weekly" to view weekly technical stock chart. | |||||

 | KO Coca-Cola Co |
| Sector: Consumer Staples | |
| SubSector: Beverages - Non-Alcoholic | |
| MarketCap: 292477 Millions | |
| Recent Price: 67.96 Smart Investing & Trading Score: 0 | |
| Day Percent Change: -0.42% Day Change: -0.29 | |
| Week Change: -3.09% Year-to-date Change: 8.6% | |
| KO Links: Profile News Message Board | |
| Charts:- Daily , Weekly | |
| Add KO to Watchlist: View: Get Complete KO Trend Analysis ➞ | |
 | UNH Unitedhealth Group Inc |
| Sector: Health Care | |
| SubSector: Healthcare Plans | |
| MarketCap: 285640 Millions | |
| Recent Price: 315.39 Smart Investing & Trading Score: 80 | |
| Day Percent Change: 1.61% Day Change: 5.01 | |
| Week Change: 2.59% Year-to-date Change: -41.2% | |
| UNH Links: Profile News Message Board | |
| Charts:- Daily , Weekly | |
| Add UNH to Watchlist: View: Get Complete UNH Trend Analysis ➞ | |
 | TMUS T-Mobile US Inc |
| Sector: Technology | |
| SubSector: Telecom Services | |
| MarketCap: 284461 Millions | |
| Recent Price: 251.93 Smart Investing & Trading Score: 60 | |
| Day Percent Change: -0.08% Day Change: -0.19 | |
| Week Change: -0.01% Year-to-date Change: 8.9% | |
| TMUS Links: Profile News Message Board | |
| Charts:- Daily , Weekly | |
| Add TMUS to Watchlist: View: Get Complete TMUS Trend Analysis ➞ | |
 | CSCO Cisco Systems, Inc |
| Sector: Technology | |
| SubSector: Communication Equipment | |
| MarketCap: 264469 Millions | |
| Recent Price: 66.9 Smart Investing & Trading Score: 10 | |
| Day Percent Change: -1.6% Day Change: -1.09 | |
| Week Change: -0.62% Year-to-date Change: 11.8% | |
| CSCO Links: Profile News Message Board | |
| Charts:- Daily , Weekly | |
| Add CSCO to Watchlist: View: Get Complete CSCO Trend Analysis ➞ | |
 | WFC Wells Fargo & Co |
| Sector: Financials | |
| SubSector: Banks - Diversified | |
| MarketCap: 252944 Millions | |
| Recent Price: 78.96 Smart Investing & Trading Score: 20 | |
| Day Percent Change: -3.51% Day Change: -2.87 | |
| Week Change: -0.18% Year-to-date Change: 1.8% | |
| WFC Links: Profile News Message Board | |
| Charts:- Daily , Weekly | |
| Add WFC to Watchlist: View: Get Complete WFC Trend Analysis ➞ | |
 | PM Philip Morris International Inc |
| Sector: Consumer Staples | |
| SubSector: Tobacco | |
| MarketCap: 251467 Millions | |
| Recent Price: 161.55 Smart Investing & Trading Score: 0 | |
| Day Percent Change: 0.25% Day Change: 0.4 | |
| Week Change: -5.94% Year-to-date Change: 26.1% | |
| PM Links: Profile News Message Board | |
| Charts:- Daily , Weekly | |
| Add PM to Watchlist: View: Get Complete PM Trend Analysis ➞ | |
 | AMD Advanced Micro Devices Inc |
| Sector: Technology | |
| SubSector: Semiconductors | |
| MarketCap: 245277 Millions | |
| Recent Price: 151.34 Smart Investing & Trading Score: 20 | |
| Day Percent Change: -6.46% Day Change: -10.45 | |
| Week Change: -9.79% Year-to-date Change: 30.5% | |
| AMD Links: Profile News Message Board | |
| Charts:- Daily , Weekly | |
| Add AMD to Watchlist: View: Get Complete AMD Trend Analysis ➞ | |
 | CRM Salesforce Inc |
| Sector: Technology | |
| SubSector: Software - Application | |
| MarketCap: 238724 Millions | |
| Recent Price: 250.76 Smart Investing & Trading Score: 50 | |
| Day Percent Change: 2.77% Day Change: 6.75 | |
| Week Change: 0.99% Year-to-date Change: -26.4% | |
| CRM Links: Profile News Message Board | |
| Charts:- Daily , Weekly | |
| Add CRM to Watchlist: View: Get Complete CRM Trend Analysis ➞ | |
 | MS Morgan Stanley |
| Sector: Financials | |
| SubSector: Capital Markets | |
| MarketCap: 236401 Millions | |
| Recent Price: 148.09 Smart Investing & Trading Score: 40 | |
| Day Percent Change: -1.62% Day Change: -2.44 | |
| Week Change: 0.05% Year-to-date Change: 8.6% | |
| MS Links: Profile News Message Board | |
| Charts:- Daily , Weekly | |
| Add MS to Watchlist: View: Get Complete MS Trend Analysis ➞ | |
 | IBM International Business Machines Corp |
| Sector: Technology | |
| SubSector: Information Technology Services | |
| MarketCap: 231510 Millions | |
| Recent Price: 248.53 Smart Investing & Trading Score: 70 | |
| Day Percent Change: 0.55% Day Change: 1.35 | |
| Week Change: 2.66% Year-to-date Change: -0.8% | |
| IBM Links: Profile News Message Board | |
| Charts:- Daily , Weekly | |
| Add IBM to Watchlist: View: Get Complete IBM Trend Analysis ➞ | |
 | ABT Abbott Laboratories |
| Sector: Health Care | |
| SubSector: Medical Devices | |
| MarketCap: 231377 Millions | |
| Recent Price: 132.94 Smart Investing & Trading Score: 60 | |
| Day Percent Change: 0.1% Day Change: 0.13 | |
| Week Change: 0.26% Year-to-date Change: 4.9% | |
| ABT Links: Profile News Message Board | |
| Charts:- Daily , Weekly | |
| Add ABT to Watchlist: View: Get Complete ABT Trend Analysis ➞ | |
 | AXP American Express Co |
| Sector: Financials | |
| SubSector: Credit Services | |
| MarketCap: 227011 Millions | |
| Recent Price: 326.22 Smart Investing & Trading Score: 70 | |
| Day Percent Change: -1.34% Day Change: -4.43 | |
| Week Change: 2.21% Year-to-date Change: 3.4% | |
| AXP Links: Profile News Message Board | |
| Charts:- Daily , Weekly | |
| Add AXP to Watchlist: View: Get Complete AXP Trend Analysis ➞ | |
 | MCD McDonald's Corp |
| Sector: Services & Goods | |
| SubSector: Restaurants | |
| MarketCap: 224343 Millions | |
| Recent Price: 314.38 Smart Investing & Trading Score: 60 | |
| Day Percent Change: -0.82% Day Change: -2.61 | |
| Week Change: 0.1% Year-to-date Change: 10.1% | |
| MCD Links: Profile News Message Board | |
| Charts:- Daily , Weekly | |
| Add MCD to Watchlist: View: Get Complete MCD Trend Analysis ➞ | |
 | GS Goldman Sachs Group, Inc |
| Sector: Financials | |
| SubSector: Capital Markets | |
| MarketCap: 223472 Millions | |
| Recent Price: 738.21 Smart Investing & Trading Score: 60 | |
| Day Percent Change: -1.43% Day Change: -10.69 | |
| Week Change: -0.5% Year-to-date Change: 16.4% | |
| GS Links: Profile News Message Board | |
| Charts:- Daily , Weekly | |
| Add GS to Watchlist: View: Get Complete GS Trend Analysis ➞ | |
 | LIN Linde Plc |
| Sector: Materials | |
| SubSector: Specialty Chemicals | |
| MarketCap: 220162 Millions | |
| Recent Price: 467.07 Smart Investing & Trading Score: 20 | |
| Day Percent Change: -1.13% Day Change: -5.32 | |
| Week Change: -3.03% Year-to-date Change: 5.4% | |
| LIN Links: Profile News Message Board | |
| Charts:- Daily , Weekly | |
| Add LIN to Watchlist: View: Get Complete LIN Trend Analysis ➞ | |
 | DIS Walt Disney Co |
| Sector: Technology | |
| SubSector: Entertainment | |
| MarketCap: 211994 Millions | |
| Recent Price: 117.91 Smart Investing & Trading Score: 40 | |
| Day Percent Change: -0.76% Day Change: -0.9 | |
| Week Change: -0.8% Year-to-date Change: 4.7% | |
| DIS Links: Profile News Message Board | |
| Charts:- Daily , Weekly | |
| Add DIS to Watchlist: View: Get Complete DIS Trend Analysis ➞ | |
 | MRK Merck & Co Inc |
| Sector: Health Care | |
| SubSector: Drug Manufacturers - General | |
| MarketCap: 211587 Millions | |
| Recent Price: 84.71 Smart Investing & Trading Score: 70 | |
| Day Percent Change: 0.79% Day Change: 0.66 | |
| Week Change: -3.04% Year-to-date Change: -12.7% | |
| MRK Links: Profile News Message Board | |
| Charts:- Daily , Weekly | |
| Add MRK to Watchlist: View: Get Complete MRK Trend Analysis ➞ | |
 | T AT&T, Inc |
| Sector: Technology | |
| SubSector: Telecom Services | |
| MarketCap: 211580 Millions | |
| Recent Price: 29.59 Smart Investing & Trading Score: 90 | |
| Day Percent Change: 0.03% Day Change: 0.01 | |
| Week Change: 2.85% Year-to-date Change: 27.3% | |
| T Links: Profile News Message Board | |
| Charts:- Daily , Weekly | |
| Add T to Watchlist: View: Get Complete T Trend Analysis ➞ | |
 | PEP PepsiCo Inc |
| Sector: Consumer Staples | |
| SubSector: Beverages - Non-Alcoholic | |
| MarketCap: 200419 Millions | |
| Recent Price: 146.39 Smart Investing & Trading Score: 40 | |
| Day Percent Change: -0.34% Day Change: -0.5 | |
| Week Change: -2.17% Year-to-date Change: -0.9% | |
| PEP Links: Profile News Message Board | |
| Charts:- Daily , Weekly | |
| Add PEP to Watchlist: View: Get Complete PEP Trend Analysis ➞ | |
 | CAT Caterpillar Inc |
| Sector: Industrials | |
| SubSector: Farm & Heavy Construction Machinery | |
| MarketCap: 198204 Millions | |
| Recent Price: 423.08 Smart Investing & Trading Score: 80 | |
| Day Percent Change: 0.68% Day Change: 2.86 | |
| Week Change: -2.89% Year-to-date Change: 14.9% | |
| CAT Links: Profile News Message Board | |
| Charts:- Daily , Weekly | |
| Add CAT to Watchlist: View: Get Complete CAT Trend Analysis ➞ | |
 | VZ Verizon Communications Inc |
| Sector: Technology | |
| SubSector: Telecom Services | |
| MarketCap: 187121 Millions | |
| Recent Price: 44.38 Smart Investing & Trading Score: 80 | |
| Day Percent Change: 0.45% Day Change: 0.2 | |
| Week Change: -0.14% Year-to-date Change: 16.3% | |
| VZ Links: Profile News Message Board | |
| Charts:- Daily , Weekly | |
| Add VZ to Watchlist: View: Get Complete VZ Trend Analysis ➞ | |
 | TMO Thermo Fisher Scientific Inc |
| Sector: Health Care | |
| SubSector: Diagnostics & Research | |
| MarketCap: 186012 Millions | |
| Recent Price: 490.2 Smart Investing & Trading Score: 90 | |
| Day Percent Change: 0.15% Day Change: 0.71 | |
| Week Change: -1.96% Year-to-date Change: -17.8% | |
| TMO Links: Profile News Message Board | |
| Charts:- Daily , Weekly | |
| Add TMO to Watchlist: View: Get Complete TMO Trend Analysis ➞ | |
 | BLK Blackrock Inc |
| Sector: Financials | |
| SubSector: Asset Management | |
| MarketCap: 179366 Millions | |
| Recent Price: 1099.15 Smart Investing & Trading Score: 20 | |
| Day Percent Change: -0.87% Day Change: -9.61 | |
| Week Change: -4.27% Year-to-date Change: 3.3% | |
| BLK Links: Profile News Message Board | |
| Charts:- Daily , Weekly | |
| Add BLK to Watchlist: View: Get Complete BLK Trend Analysis ➞ | |
 | BKNG Booking Holdings Inc |
| Sector: Services & Goods | |
| SubSector: Travel Services | |
| MarketCap: 178442 Millions | |
| Recent Price: 5505.8 Smart Investing & Trading Score: 40 | |
| Day Percent Change: -1.43% Day Change: -80.06 | |
| Week Change: -3.76% Year-to-date Change: 16.7% | |
| BKNG Links: Profile News Message Board | |
| Charts:- Daily , Weekly | |
| Add BKNG to Watchlist: View: Get Complete BKNG Trend Analysis ➞ | |
 | C Citigroup Inc |
| Sector: Financials | |
| SubSector: Banks - Diversified | |
| MarketCap: 175622 Millions | |
| Recent Price: 95.4 Smart Investing & Trading Score: 80 | |
| Day Percent Change: -1.73% Day Change: -1.68 | |
| Week Change: 0.15% Year-to-date Change: 19.7% | |
| C Links: Profile News Message Board | |
| Charts:- Daily , Weekly | |
| Add C to Watchlist: View: Get Complete C Trend Analysis ➞ | |
| For tabular summary view of above stock list: Summary View ➞ 0 - 25 , 25 - 50 , 50 - 75 , 75 - 100 , 100 - 125 | ||
| Click To Change The Sort Order: By Market Cap or Company Size Performance: Year-to-date, Week and Day | |
| Select Chart Type: | ||
|
Best Stocks Today 12Stocks.com |
� 2025 12Stocks.com Terms & Conditions Privacy Contact Us
All Information Provided Only For Education And Not To Be Used For Investing or Trading. See Terms & Conditions


One More Thing ... Get Best Stocks Delivered Daily!
Never Ever Miss A Move With Our Top Ten Stocks Lists
Find Best Stocks In Any Market - Bull or Bear Market
Take A Peek At Our Top Ten Stocks Lists: Daily, Weekly, Year-to-Date & Top Trends
Find Best Stocks In Any Market - Bull or Bear Market
Take A Peek At Our Top Ten Stocks Lists: Daily, Weekly, Year-to-Date & Top Trends
S&P 100 Stocks With Best Up Trends [0-bearish to 100-bullish]: Broadcom [100], Lowe's Cos[100], Home Depot[100], Lockheed Martin[100], Google [100], Google [100], Apple [100], Tesla [90], iShares S&P[90], Procter & Gamble Co[90], Simon Property[90]
Best S&P 100 Stocks Year-to-Date:
Broadcom [53.62%], NVIDIA Corp[39.12%], Oracle Corp[37.68%], GE Aerospace[37.62%], CVS Health[33.42%], Altria [31.96%], Advanced Micro[30.52%], Boeing Co[30.08%], Netflix [27.34%], AT&T [27.28%], General Dynamics[26.98%] Best S&P 100 Stocks This Week:
Broadcom [15%], Google [14.03%], Google [13.76%], Apple [5.24%], GE Aerospace[4.76%], Lockheed Martin[3.97%], Walmart [3.8%], CVS Health[3.48%], Netflix [3.25%], Simon Property[3.22%], Tesla [3.19%] Best S&P 100 Stocks Daily:
Broadcom [10.45%], Oracle Corp[4.39%], Tesla [3.64%], Salesforce [2.77%], Lowe's Cos[2.04%], Gilead Sciences[2.02%], American Tower[1.85%], Home Depot[1.76%], Colgate-Palmolive Co[1.74%], Unitedhealth [1.61%], Lockheed Martin[1.54%]