
 Login Sign Up


| |||||
 |  | ||||

| 12Stocks.com Market Intelligence |
Best Nasdaq Stocks
|
On this page, you will find the most comprehensive analysis of Nasdaq 100 stocks and ETFs - from latest trends to performances to charts ➞. First, here are the year-to-date (YTD) performances of the most requested Nasdaq stocks at 12Stocks.com (click stock for review):
| NVIDIA 76% | ||
| Google 20% | ||
| Amazon.com 18% | ||
| QUALCOMM 15% | ||
| Netflix 14% | ||
| Costco 9% | ||
| Microsoft 7% | ||
| Amgen -5% | ||
| Starbucks -8% | ||
| Apple -9% | ||
| Expedia -10% | ||
| Baidu -11% | ||
| Comcast -12% | ||
| Biogen -16% | ||
| Gilead -18% | ||
| Tesla -24% | ||
| Intel -38% | ||
| Nasdaq 100 Stocks Lists: Performances & Trends, Nasdaq 100 Stock Charts
Sort Nasdaq 100 stocks: Daily, Weekly, Year-to-Date, Market Cap & Trends. |
| 12Stocks.com Nasdaq Stocks Performances & Trends Daily Report | |||||||||
|
| 
The overall Smart Investing & Trading Score is 68 (0-bearish to 100-bullish) which puts Nasdaq index in short term neutral to bullish trend. The Smart Investing & Trading Score from previous trading session is 58 and hence an improvement of trend. | ||||||||
| Here are the Smart Investing & Trading Scores of the most requested Nasdaq 100 stocks at 12Stocks.com (click stock name for detailed review): |


| 12Stocks.com: Top Performing Nasdaq 100 Index Stocks | ||||||||||||||||||||||||||||||||||||||||||||||||
 The top performing Nasdaq 100 Index stocks year to date are
Now, more recently, over last week, the top performing Nasdaq 100 Index stocks on the move are


|
||||||||||||||||||||||||||||||||||||||||||||||||
| 12Stocks.com: Investing in Nasdaq 100 Index with Stocks | |
|
The following table helps investors and traders sort through current performance and trends (as measured by Smart Investing & Trading Score) of various
stocks in the Nasdaq 100 Index. Quick View: Move mouse or cursor over stock symbol (ticker) to view short-term technical chart and over stock name to view long term chart. Click on  to add stock symbol to your watchlist and to add stock symbol to your watchlist and  to view watchlist. Click on any ticker or stock name for detailed market intelligence report for that stock. to view watchlist. Click on any ticker or stock name for detailed market intelligence report for that stock. |
12Stocks.com Performance of Stocks in Nasdaq 100 Index
| Ticker | Stock Name | Watchlist | Category | Recent Price | Smart Investing & Trading Score | Change % | YTD Change% |
| AAPL | Apple |   | Technology | 174.78 | 49 | 3.24% | -9.22% |
| MELI | MercadoLibre | | Services & Goods | 1431.65 | 49 | 1.82% | -8.90% |
| AMD | Advanced Micro | | Technology | 159.84 | 49 | 1.55% | 8.43% |
| EA | Electronic Arts | | Technology | 128.32 | 49 | 0.33% | -6.21% |
| COST | Costco | | Services & Goods | 721.55 | 48 | -1.05% | 9.31% |
| SBUX | Starbucks | | Services & Goods | 88.25 | 45 | 0.00% | -8.08% |
| MAR | Marriott | | Services & Goods | 241.62 | 43 | 0.32% | 7.14% |
| FANG | Diamondback Energy | | Energy | 205.23 | 43 | -1.22% | 32.34% |
| XEL | Xcel Energy | | Utilities | 54.56 | 42 | 1.11% | -11.87% |
| VRSK | Verisk Analytics | | Services & Goods | 222.17 | 42 | 0.47% | -6.99% |
| TTWO | Take-Two Interactive | | Technology | 144.96 | 42 | 0.34% | -9.94% |
| ADBE | Adobe | | Technology | 475.74 | 42 | -0.38% | -20.26% |
| CHTR | Charter | | Technology | 260.02 | 42 | 2.12% | -33.10% |
| BKNG | Booking | | Services & Goods | 3489.46 | 40 | -0.90% | -1.63% |
| FAST | Fastenal | | Services & Goods | 68.17 | 38 | 0.00% | 5.25% |
| ANSS | ANSYS | | Technology | 329.03 | 38 | -1.41% | -9.33% |
| MSFT | Microsoft | | Technology | 401.29 | 36 | -1.24% | 6.71% |
| GILD | Gilead | | Health Care | 66.61 | 35 | 1.81% | -17.78% |
| ZS | Zscaler | | Technology | 178.66 | 35 | 0.91% | -19.36% |
| CTSH | Cognizant | | Technology | 67.10 | 35 | 0.24% | -11.16% |
| FTNT | Fortinet | | Technology | 64.13 | 33 | -0.08% | 9.57% |
| CDNS | Cadence Design | | Technology | 281.32 | 32 | -0.38% | 3.29% |
| SIRI | Sirius XM | | Services & Goods | 3.17 | 27 | 4.97% | -42.05% |
| CMCSA | Comcast | | Services & Goods | 38.80 | 27 | 0.58% | -11.53% |
| SQQQ | UltraPro | | Utilities | 11.36 | 27 | -0.61% | -15.54% |
| META | Meta Platforms | | Technology | 433.75 | 26 | -2.15% | 22.52% |
| ORLY | O Reilly | | Services & Goods | 1034.96 | 26 | -0.86% | 8.93% |
| DXCM | DexCom | | Health Care | 124.24 | 26 | -0.08% | 0.12% |
| ADSK | Autodesk | | Technology | 216.14 | 25 | -0.82% | -11.23% |
| VRTX | Vertex | | Health Care | 396.17 | 25 | -0.33% | -2.64% |
| For chart view version of above stock list: Chart View ➞ 0 - 30 , 30 - 60 , 60 - 90 , 90 - 120 | ||
 | Click To Change The Sort Order: By Market Cap or Company Size Performance: Year-to-date, Week and Day |  |
|
Get the most comprehensive stock market coverage daily at 12Stocks.com ➞ Best Stocks Today ➞ Best Stocks Weekly ➞ Best Stocks Year-to-Date ➞ Best Stocks Trends ➞  Best Stocks Today 12Stocks.com Best Dow Stocks ➞ Best S&P 500 Stocks ➞ Best Tech Stocks ➞ Best Biotech Stocks ➞ |
| Detailed Overview of Nasdaq 100 Stocks |
| Nasdaq 100 Technical Overview, Leaders & Laggards, Top Nasdaq 100 ETF Funds & Detailed Nasdaq 100 Stocks List, Charts, Trends & More |
| Nasdaq 100: Technical Analysis, Trends & YTD Performance | |
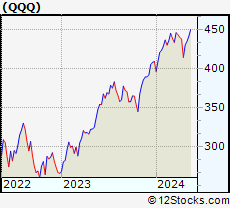
| Nasdaq 100 index as represented by
QQQ, an exchange-traded fund [ETF], holds basket of one hundred (mostly largecap) stocks from technology, biotech & retail sectors of the US stock market. The Nasdaq 100 index (contains stocks like Apple and Amgen) is up by 5.46% and is currently underperforming the overall market by -1.04% year-to-date. Below is a quick view of technical charts and trends: | |
 QQQ Weekly Chart |
|
| Long Term Trend: Good | |
| Medium Term Trend: Not Good | |
 QQQ Daily Chart |
|
| Short Term Trend: Very Good | |
| Overall Trend Score: 68 | |
| YTD Performance: 5.46% | |
| **Trend Scores & Views Are Only For Educational Purposes And Not For Investing | |
| 12Stocks.com: Investing in Nasdaq 100 Index using Exchange Traded Funds | |
|
The following table shows list of key exchange traded funds (ETF) that
help investors track Nasdaq 100 index. The following list also includes leveraged ETF funds that track twice or thrice the daily returns of Nasdaq 100 indices. Short or inverse ETF funds move in the opposite direction to the index they track and are useful during market pullbacks or during bear markets. Quick View: Move mouse or cursor over ETF symbol (ticker) to view short-term technical chart and over ETF name to view long term chart. Click on ticker or stock name for detailed view. Click on to add stock symbol to your watchlist and to view watchlist. |
12Stocks.com List of ETFs that track Nasdaq 100 Index
| Ticker | ETF Name | Watchlist | Recent Price | Smart Investing & Trading Score | Change % | Week % | Year-to-date % |
| SQQQ | ProShares UltraPro Short QQQ | | 11.36 | 27 | -0.61 | -0.61 | -15.54% |
| TQQQ | ProShares UltraPro QQQ | | 55.65 | 68 | 0.67 | 0.67 | 9.76% |
| QQQ | PowerShares QQQ ETF | | 431.87 | 68 | 0.20 | 0.2 | 5.46% |
| QYLD | Recon Capital NASDAQ 100 Cov Call ETF | | 17.49 | 45 | 0.06 | 0.06 | 0.87% |
| QID | ProShares UltraShort QQQ | | 47.45 | 30 | -0.53 | -0.53 | -10.57% |
| QLD | ProShares Ultra QQQ | | 82.19 | 75 | 0.44 | 0.44 | 8.14% |
| QQEW | First Trust NASDAQ-100 Equal Wtd ETF | | 119.23 | 83 | 0.36 | 0.36 | 1.52% |
| QQQX | Nuveen Nasdaq 100 Dynamic Overwrite Fund | | 23.09 | 68 | 0.41 | 0.41 | -0.24% |
| QQQE | Direxion NASDAQ-100 Equal Wtd ETF | | 85.90 | 83 | 0.42 | 0.42 | 1.49% |
| QTEC | First Trust NASDAQ-100-Tech Sector ETF | | 183.52 | 75 | -0.26 | -0.26 | 4.59% |
| QQXT | First Trust NASDAQ-100 ex-Tech Sect ETF | | 87.59 | 70 | 0.66 | 0.66 | -0.61% |
| 12Stocks.com: Charts, Trends, Fundamental Data and Performances of Nasdaq 100 Stocks | |
|
We now take in-depth look at all Nasdaq 100 stocks including charts, multi-period performances and overall trends (as measured by Smart Investing & Trading Score). One can sort Nasdaq 100 stocks (click link to choose) by Daily, Weekly and by Year-to-Date performances. Also, one can sort by size of the company or by market capitalization. |
| Select Your Default Chart Type: | |||||
| |||||
| Click on stock symbol or name for detailed view. Click on to add stock symbol to your watchlist and to view watchlist. Quick View: Move mouse or cursor over "Daily" to quickly view daily technical stock chart and over "Weekly" to view weekly technical stock chart. | |||||

 | AAPL Apple Inc. |
| Sector: Technology | |
| SubSector: Electronic Equipment | |
| MarketCap: 1112940 Millions | |
| Recent Price: 174.78 Smart Investing & Trading Score: 49 | |
| Day Percent Change: 3.24% Day Change: 5.48 | |
| Week Change: 3.24% Year-to-date Change: -9.2% | |
| AAPL Links: Profile News Message Board | |
| Charts:- Daily , Weekly | |
| Add AAPL to Watchlist: View: Get Complete AAPL Trend Analysis ➞ | |
 | MELI MercadoLibre, Inc. |
| Sector: Services & Goods | |
| SubSector: Catalog & Mail Order Houses | |
| MarketCap: 24695.5 Millions | |
| Recent Price: 1431.65 Smart Investing & Trading Score: 49 | |
| Day Percent Change: 1.82% Day Change: 25.64 | |
| Week Change: 1.82% Year-to-date Change: -8.9% | |
| MELI Links: Profile News Message Board | |
| Charts:- Daily , Weekly | |
| Add MELI to Watchlist: View: Get Complete MELI Trend Analysis ➞ | |
 | AMD Advanced Micro Devices, Inc. |
| Sector: Technology | |
| SubSector: Semiconductor - Broad Line | |
| MarketCap: 54275.1 Millions | |
| Recent Price: 159.84 Smart Investing & Trading Score: 49 | |
| Day Percent Change: 1.55% Day Change: 2.44 | |
| Week Change: 1.55% Year-to-date Change: 8.4% | |
| AMD Links: Profile News Message Board | |
| Charts:- Daily , Weekly | |
| Add AMD to Watchlist: View: Get Complete AMD Trend Analysis ➞ | |
 | EA Electronic Arts Inc. |
| Sector: Technology | |
| SubSector: Multimedia & Graphics Software | |
| MarketCap: 27296.5 Millions | |
| Recent Price: 128.32 Smart Investing & Trading Score: 49 | |
| Day Percent Change: 0.33% Day Change: 0.42 | |
| Week Change: 0.33% Year-to-date Change: -6.2% | |
| EA Links: Profile News Message Board | |
| Charts:- Daily , Weekly | |
| Add EA to Watchlist: View: Get Complete EA Trend Analysis ➞ | |
 | COST Costco Wholesale Corporation |
| Sector: Services & Goods | |
| SubSector: Discount, Variety Stores | |
| MarketCap: 136355 Millions | |
| Recent Price: 721.55 Smart Investing & Trading Score: 48 | |
| Day Percent Change: -1.05% Day Change: -7.63 | |
| Week Change: -1.05% Year-to-date Change: 9.3% | |
| COST Links: Profile News Message Board | |
| Charts:- Daily , Weekly | |
| Add COST to Watchlist: View: Get Complete COST Trend Analysis ➞ | |
 | SBUX Starbucks Corporation |
| Sector: Services & Goods | |
| SubSector: Specialty Eateries | |
| MarketCap: 74909.7 Millions | |
| Recent Price: 88.25 Smart Investing & Trading Score: 45 | |
| Day Percent Change: 0.00% Day Change: 0.00 | |
| Week Change: 0% Year-to-date Change: -8.1% | |
| SBUX Links: Profile News Message Board | |
| Charts:- Daily , Weekly | |
| Add SBUX to Watchlist: View: Get Complete SBUX Trend Analysis ➞ | |
 | MAR Marriott International, Inc. |
| Sector: Services & Goods | |
| SubSector: Lodging | |
| MarketCap: 25831.6 Millions | |
| Recent Price: 241.62 Smart Investing & Trading Score: 43 | |
| Day Percent Change: 0.32% Day Change: 0.78 | |
| Week Change: 0.32% Year-to-date Change: 7.1% | |
| MAR Links: Profile News Message Board | |
| Charts:- Daily , Weekly | |
| Add MAR to Watchlist: View: Get Complete MAR Trend Analysis ➞ | |
 | FANG Diamondback Energy, Inc. |
| Sector: Energy | |
| SubSector: Independent Oil & Gas | |
| MarketCap: 3009.13 Millions | |
| Recent Price: 205.23 Smart Investing & Trading Score: 43 | |
| Day Percent Change: -1.22% Day Change: -2.53 | |
| Week Change: -1.22% Year-to-date Change: 32.3% | |
| FANG Links: Profile News Message Board | |
| Charts:- Daily , Weekly | |
| Add FANG to Watchlist: View: Get Complete FANG Trend Analysis ➞ | |
 | XEL Xcel Energy Inc. |
| Sector: Utilities | |
| SubSector: Electric Utilities | |
| MarketCap: 28960.8 Millions | |
| Recent Price: 54.56 Smart Investing & Trading Score: 42 | |
| Day Percent Change: 1.11% Day Change: 0.60 | |
| Week Change: 1.11% Year-to-date Change: -11.9% | |
| XEL Links: Profile News Message Board | |
| Charts:- Daily , Weekly | |
| Add XEL to Watchlist: View: Get Complete XEL Trend Analysis ➞ | |
 | VRSK Verisk Analytics, Inc. |
| Sector: Services & Goods | |
| SubSector: Business Services | |
| MarketCap: 22033.2 Millions | |
| Recent Price: 222.17 Smart Investing & Trading Score: 42 | |
| Day Percent Change: 0.47% Day Change: 1.03 | |
| Week Change: 0.47% Year-to-date Change: -7.0% | |
| VRSK Links: Profile News Message Board | |
| Charts:- Daily , Weekly | |
| Add VRSK to Watchlist: View: Get Complete VRSK Trend Analysis ➞ | |
 | TTWO Take-Two Interactive Software, Inc. |
| Sector: Technology | |
| SubSector: Multimedia & Graphics Software | |
| MarketCap: 12479.6 Millions | |
| Recent Price: 144.96 Smart Investing & Trading Score: 42 | |
| Day Percent Change: 0.34% Day Change: 0.49 | |
| Week Change: 0.34% Year-to-date Change: -9.9% | |
| TTWO Links: Profile News Message Board | |
| Charts:- Daily , Weekly | |
| Add TTWO to Watchlist: View: Get Complete TTWO Trend Analysis ➞ | |
 | ADBE Adobe Inc. |
| Sector: Technology | |
| SubSector: Application Software | |
| MarketCap: 157868 Millions | |
| Recent Price: 475.74 Smart Investing & Trading Score: 42 | |
| Day Percent Change: -0.38% Day Change: -1.82 | |
| Week Change: -0.38% Year-to-date Change: -20.3% | |
| ADBE Links: Profile News Message Board | |
| Charts:- Daily , Weekly | |
| Add ADBE to Watchlist: View: Get Complete ADBE Trend Analysis ➞ | |
 | CHTR Charter Communications, Inc. |
| Sector: Technology | |
| SubSector: CATV Systems | |
| MarketCap: 82268.3 Millions | |
| Recent Price: 260.02 Smart Investing & Trading Score: 42 | |
| Day Percent Change: 2.12% Day Change: 5.41 | |
| Week Change: 2.12% Year-to-date Change: -33.1% | |
| CHTR Links: Profile News Message Board | |
| Charts:- Daily , Weekly | |
| Add CHTR to Watchlist: View: Get Complete CHTR Trend Analysis ➞ | |
 | BKNG Booking Holdings Inc. |
| Sector: Services & Goods | |
| SubSector: Business Services | |
| MarketCap: 54467.9 Millions | |
| Recent Price: 3489.46 Smart Investing & Trading Score: 40 | |
| Day Percent Change: -0.90% Day Change: -31.62 | |
| Week Change: -0.9% Year-to-date Change: -1.6% | |
| BKNG Links: Profile News Message Board | |
| Charts:- Daily , Weekly | |
| Add BKNG to Watchlist: View: Get Complete BKNG Trend Analysis ➞ | |
 | FAST Fastenal Company |
| Sector: Services & Goods | |
| SubSector: Industrial Equipment Wholesale | |
| MarketCap: 17609.9 Millions | |
| Recent Price: 68.17 Smart Investing & Trading Score: 38 | |
| Day Percent Change: 0.00% Day Change: 0.00 | |
| Week Change: 0% Year-to-date Change: 5.3% | |
| FAST Links: Profile News Message Board | |
| Charts:- Daily , Weekly | |
| Add FAST to Watchlist: View: Get Complete FAST Trend Analysis ➞ | |
 | ANSS ANSYS, Inc. |
| Sector: Technology | |
| SubSector: Application Software | |
| MarketCap: 19497.4 Millions | |
| Recent Price: 329.03 Smart Investing & Trading Score: 38 | |
| Day Percent Change: -1.41% Day Change: -4.72 | |
| Week Change: -1.41% Year-to-date Change: -9.3% | |
| ANSS Links: Profile News Message Board | |
| Charts:- Daily , Weekly | |
| Add ANSS to Watchlist: View: Get Complete ANSS Trend Analysis ➞ | |
 | MSFT Microsoft Corporation |
| Sector: Technology | |
| SubSector: Business Software & Services | |
| MarketCap: 1154150 Millions | |
| Recent Price: 401.29 Smart Investing & Trading Score: 36 | |
| Day Percent Change: -1.24% Day Change: -5.03 | |
| Week Change: -1.24% Year-to-date Change: 6.7% | |
| MSFT Links: Profile News Message Board | |
| Charts:- Daily , Weekly | |
| Add MSFT to Watchlist: View: Get Complete MSFT Trend Analysis ➞ | |
 | GILD Gilead Sciences, Inc. |
| Sector: Health Care | |
| SubSector: Biotechnology | |
| MarketCap: 99485.6 Millions | |
| Recent Price: 66.61 Smart Investing & Trading Score: 35 | |
| Day Percent Change: 1.81% Day Change: 1.19 | |
| Week Change: 1.81% Year-to-date Change: -17.8% | |
| GILD Links: Profile News Message Board | |
| Charts:- Daily , Weekly | |
| Add GILD to Watchlist: View: Get Complete GILD Trend Analysis ➞ | |
 | ZS Zscaler, Inc. |
| Sector: Technology | |
| SubSector: Security Software & Services | |
| MarketCap: 7532.17 Millions | |
| Recent Price: 178.66 Smart Investing & Trading Score: 35 | |
| Day Percent Change: 0.91% Day Change: 1.61 | |
| Week Change: 0.91% Year-to-date Change: -19.4% | |
| ZS Links: Profile News Message Board | |
| Charts:- Daily , Weekly | |
| Add ZS to Watchlist: View: Get Complete ZS Trend Analysis ➞ | |
 | CTSH Cognizant Technology Solutions Corporation |
| Sector: Technology | |
| SubSector: Information Technology Services | |
| MarketCap: 26249.7 Millions | |
| Recent Price: 67.10 Smart Investing & Trading Score: 35 | |
| Day Percent Change: 0.24% Day Change: 0.16 | |
| Week Change: 0.24% Year-to-date Change: -11.2% | |
| CTSH Links: Profile News Message Board | |
| Charts:- Daily , Weekly | |
| Add CTSH to Watchlist: View: Get Complete CTSH Trend Analysis ➞ | |
 | FTNT Fortinet, Inc. |
| Sector: Technology | |
| SubSector: Application Software | |
| MarketCap: 16993.8 Millions | |
| Recent Price: 64.13 Smart Investing & Trading Score: 33 | |
| Day Percent Change: -0.08% Day Change: -0.05 | |
| Week Change: -0.08% Year-to-date Change: 9.6% | |
| FTNT Links: Profile News Message Board | |
| Charts:- Daily , Weekly | |
| Add FTNT to Watchlist: View: Get Complete FTNT Trend Analysis ➞ | |
 | CDNS Cadence Design Systems, Inc. |
| Sector: Technology | |
| SubSector: Application Software | |
| MarketCap: 16865.8 Millions | |
| Recent Price: 281.32 Smart Investing & Trading Score: 32 | |
| Day Percent Change: -0.38% Day Change: -1.09 | |
| Week Change: -0.38% Year-to-date Change: 3.3% | |
| CDNS Links: Profile News Message Board | |
| Charts:- Daily , Weekly | |
| Add CDNS to Watchlist: View: Get Complete CDNS Trend Analysis ➞ | |
 | SIRI Sirius XM Holdings Inc. |
| Sector: Services & Goods | |
| SubSector: Broadcasting - Radio | |
| MarketCap: 21325.5 Millions | |
| Recent Price: 3.17 Smart Investing & Trading Score: 27 | |
| Day Percent Change: 4.97% Day Change: 0.15 | |
| Week Change: 4.97% Year-to-date Change: -42.1% | |
| SIRI Links: Profile News Message Board | |
| Charts:- Daily , Weekly | |
| Add SIRI to Watchlist: View: Get Complete SIRI Trend Analysis ➞ | |
 | CMCSA Comcast Corporation |
| Sector: Services & Goods | |
| SubSector: Entertainment - Diversified | |
| MarketCap: 164849 Millions | |
| Recent Price: 38.80 Smart Investing & Trading Score: 27 | |
| Day Percent Change: 0.58% Day Change: 0.23 | |
| Week Change: 0.58% Year-to-date Change: -11.5% | |
| CMCSA Links: Profile News Message Board | |
| Charts:- Daily , Weekly | |
| Add CMCSA to Watchlist: View: Get Complete CMCSA Trend Analysis ➞ | |
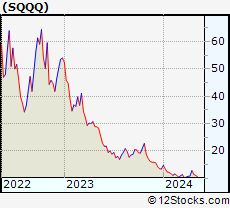 | SQQQ ProShares UltraPro Short QQQ |
| Sector: Utilities | |
| SubSector: Exchange Traded Fund | |
| MarketCap: 0 Millions | |
| Recent Price: 11.36 Smart Investing & Trading Score: 27 | |
| Day Percent Change: -0.61% Day Change: -0.07 | |
| Week Change: -0.61% Year-to-date Change: -15.5% | |
| SQQQ Links: Profile News Message Board | |
| Charts:- Daily , Weekly | |
| Add SQQQ to Watchlist: View: Get Complete SQQQ Trend Analysis ➞ | |
 | META Meta Platforms, Inc. |
| Sector: Technology | |
| SubSector: Internet Content & Information | |
| MarketCap: 732990 Millions | |
| Recent Price: 433.75 Smart Investing & Trading Score: 26 | |
| Day Percent Change: -2.15% Day Change: -9.55 | |
| Week Change: -2.15% Year-to-date Change: 22.5% | |
| META Links: Profile News Message Board | |
| Charts:- Daily , Weekly | |
| Add META to Watchlist: View: Get Complete META Trend Analysis ➞ | |
 | ORLY O Reilly Automotive, Inc. |
| Sector: Services & Goods | |
| SubSector: Auto Parts Stores | |
| MarketCap: 22391.5 Millions | |
| Recent Price: 1034.96 Smart Investing & Trading Score: 26 | |
| Day Percent Change: -0.86% Day Change: -8.97 | |
| Week Change: -0.86% Year-to-date Change: 8.9% | |
| ORLY Links: Profile News Message Board | |
| Charts:- Daily , Weekly | |
| Add ORLY to Watchlist: View: Get Complete ORLY Trend Analysis ➞ | |
 | DXCM DexCom, Inc. |
| Sector: Health Care | |
| SubSector: Medical Laboratories & Research | |
| MarketCap: 19559 Millions | |
| Recent Price: 124.24 Smart Investing & Trading Score: 26 | |
| Day Percent Change: -0.08% Day Change: -0.10 | |
| Week Change: -0.08% Year-to-date Change: 0.1% | |
| DXCM Links: Profile News Message Board | |
| Charts:- Daily , Weekly | |
| Add DXCM to Watchlist: View: Get Complete DXCM Trend Analysis ➞ | |
 | ADSK Autodesk, Inc. |
| Sector: Technology | |
| SubSector: Technical & System Software | |
| MarketCap: 36975.8 Millions | |
| Recent Price: 216.14 Smart Investing & Trading Score: 25 | |
| Day Percent Change: -0.82% Day Change: -1.79 | |
| Week Change: -0.82% Year-to-date Change: -11.2% | |
| ADSK Links: Profile News Message Board | |
| Charts:- Daily , Weekly | |
| Add ADSK to Watchlist: View: Get Complete ADSK Trend Analysis ➞ | |
 | VRTX Vertex Pharmaceuticals Incorporated |
| Sector: Health Care | |
| SubSector: Biotechnology | |
| MarketCap: 57669.6 Millions | |
| Recent Price: 396.17 Smart Investing & Trading Score: 25 | |
| Day Percent Change: -0.33% Day Change: -1.31 | |
| Week Change: -0.33% Year-to-date Change: -2.6% | |
| VRTX Links: Profile News Message Board | |
| Charts:- Daily , Weekly | |
| Add VRTX to Watchlist: View: Get Complete VRTX Trend Analysis ➞ | |
| For tabular summary view of above stock list: Summary View ➞ 0 - 30 , 30 - 60 , 60 - 90 , 90 - 120 | ||
| Click To Change The Sort Order: By Market Cap or Company Size Performance: Year-to-date, Week and Day | |
| Select Chart Type: | ||
|
Best Stocks Today 12Stocks.com |
© 2024 12Stocks.com Terms & Conditions Privacy Contact Us
All Information Provided Only For Education And Not To Be Used For Investing or Trading. See Terms & Conditions


One More Thing ... Get Best Stocks Delivered Daily!
Never Ever Miss A Move With Our Top Ten Stocks Lists
Find Best Stocks In Any Market - Bull or Bear Market
Take A Peek At Our Top Ten Stocks Lists: Daily, Weekly, Year-to-Date & Top Trends
Find Best Stocks In Any Market - Bull or Bear Market
Take A Peek At Our Top Ten Stocks Lists: Daily, Weekly, Year-to-Date & Top Trends
Nasdaq 100 Stocks With Best Up Trends [0-bearish to 100-bullish]: Tesla [100], Moderna [100], PayPal [100], AstraZeneca [100], NXP Semiconductors[100], KLA [100], Texas Instruments[100], Analog Devices[100], Microchip [100], Coca-Cola European[95], Google [93]
Best Nasdaq 100 Stocks Year-to-Date:
NVIDIA [75.74%], DoorDash [34.45%], Micron [33%], Diamondback Energy[32.34%], Applied Materials[25.46%], Meta Platforms[22.52%], KLA [21.86%], Google [20.4%], Google [20.22%], ASML Holding[19.91%], CrowdStrike [19.78%] Best Nasdaq 100 Stocks This Week:
Tesla [12.73%], Sirius XM[4.97%], Biogen [4.61%], Moderna [3.54%], Apple [3.24%], ON Semiconductor[3.06%], Illumina [2.8%], Charter [2.12%], MercadoLibre [1.82%], Gilead [1.81%], Advanced Micro[1.55%] Best Nasdaq 100 Stocks Daily:
Tesla [12.73%], Sirius XM[4.97%], Biogen [4.61%], Moderna [3.54%], Apple [3.24%], ON Semiconductor[3.06%], Illumina [2.80%], Charter [2.12%], MercadoLibre [1.82%], Gilead [1.81%], Advanced Micro[1.55%]