
 Login Sign Up


| |||||
 |  | ||||

| 12Stocks.com Market Intelligence |
Best MidCap Stocks
|
| In a hurry? Mid Cap Stocks Lists: Performance Trends Table, Stock Charts
Sort midcap stocks: Daily, Weekly, Year-to-Date, Market Cap & Trends. Filter midcap stocks list by sector: Show all, Tech, Finance, Energy, Staples, Retail, Industrial, Materials, Utilities and HealthCare Filter midcap stocks list by size:All MidCap Large Mid-Range Small |
| 12Stocks.com Mid Cap Stocks Performances & Trends Daily | |||||||||
|
|  The overall Smart Investing & Trading Score is 70 (0-bearish to 100-bullish) which puts Mid Cap index in short term neutral to bullish trend. The Smart Investing & Trading Score from previous trading session is 60 and an improvement of trend continues.
| ||||||||
Here are the Smart Investing & Trading Scores of the most requested mid cap stocks at 12Stocks.com (click stock name for detailed review):
|


| 12Stocks.com: Top Performing Mid Cap Index Stocks | ||||||||||||||||||||||||||||||||||||||||||||||||
 The top performing Mid Cap Index stocks year to date are
Now, more recently, over last week, the top performing Mid Cap Index stocks on the move are


|
||||||||||||||||||||||||||||||||||||||||||||||||
| 12Stocks.com: Investing in Midcap Index with Stocks | |
|
The following table helps investors and traders sort through current performance and trends (as measured by Smart Investing & Trading Score) of various
stocks in the Midcap Index. Quick View: Move mouse or cursor over stock symbol (ticker) to view short-term technical chart and over stock name to view long term chart. Click on  to add stock symbol to your watchlist and to add stock symbol to your watchlist and  to view watchlist. Click on any ticker or stock name for detailed market intelligence report for that stock. to view watchlist. Click on any ticker or stock name for detailed market intelligence report for that stock. |
12Stocks.com Performance of Stocks in Midcap Index
| Ticker | Stock Name | Watchlist | Category | Recent Price | Smart Investing & Trading Score | Change % | YTD Change% |
| DASH | DoorDash |   | Services & Goods | 270.17 | 40 | 0.95% | 58.32% |
| RCL | Royal Caribbean | | Services & Goods | 320.11 | 20 | 1.29% | 40.66% |
| HLT | Hilton Worldwide | | Services & Goods | 258.91 | 10 | 0.84% | 5.75% |
| DHI | D.R. Horton | | Services & Goods | 171.47 | 80 | -0.56% | 25.67% |
| CPNG | Coupang | | Services & Goods | 32.56 | 60 | 0.40% | 46.07% |
| ROST | Ross Stores | | Services & Goods | 156.17 | 100 | 1.94% | 2.96% |
| EBAY | EBay | | Services & Goods | 88.40 | 0 | 0.94% | 43.18% |
| CCL | Carnival Corp | | Services & Goods | 28.85 | 10 | 1.73% | 15.35% |
| YUM | Yum | | Services & Goods | 151.35 | 50 | -1.20% | 14.42% |
| LEN | Lennar Corp | | Services & Goods | 128.33 | 80 | 0.09% | 8.42% |
| TSCO | Tractor Supply | | Services & Goods | 56.23 | 10 | 0.55% | 8.28% |
| PHM | Pulte | | Services & Goods | 134.88 | 80 | 0.33% | 25.84% |
| ROL | Rollins | | Services & Goods | 58.31 | 40 | 0.31% | 27.79% |
| EXPE | Expedia | | Services & Goods | 217.79 | 40 | -0.07% | 18.04% |
| IP | Paper | | Services & Goods | 46.65 | 60 | 0.86% | -10.66% |
| WSM | Williams-Sonoma | | Services & Goods | 196.14 | 50 | 0.43% | 5.80% |
| DRI | Darden Restaurants | | Services & Goods | 193.49 | 60 | 0.57% | 6.04% |
| NVR | NVR | | Services & Goods | 8071.61 | 60 | 0.44% | 1.02% |
| ULTA | Ulta Beauty | | Services & Goods | 557.82 | 100 | 0.32% | 29.98% |
| TPR | Tapestry | | Services & Goods | 115.56 | 100 | 1.52% | 77.62% |
| PKG | Packaging Corp | | Services & Goods | 215.64 | 50 | 0.37% | -3.01% |
| GPC | Genuine Parts | | Services & Goods | 140.39 | 70 | 1.61% | 22.96% |
| AMCR | Amcor | | Services & Goods | 8.23 | 50 | 0.49% | -9.62% |
| RL | Ralph Lauren | | Services & Goods | 322.38 | 100 | 1.56% | 40.20% |
| CASY | Casey's General | | Services & Goods | 561.23 | 90 | 0.37% | 42.69% |
| For chart view version of above stock list: Chart View ➞ 0 - 25 , 25 - 50 , 50 - 75 , 75 - 100 , 100 - 125 | ||
 | Click To Change The Sort Order: By Market Cap or Company Size Performance: Year-to-date, Week and Day |  |
|
Get the most comprehensive stock market coverage daily at 12Stocks.com ➞ Best Stocks Today ➞ Best Stocks Weekly ➞ Best Stocks Year-to-Date ➞ Best Stocks Trends ➞  Best Stocks Today 12Stocks.com Best Nasdaq Stocks ➞ Best S&P 500 Stocks ➞ Best Tech Stocks ➞ Best Biotech Stocks ➞ |
| Detailed Overview of Midcap Stocks |
| Midcap Technical Overview, Leaders & Laggards, Top Midcap ETF Funds & Detailed Midcap Stocks List, Charts, Trends & More |
| Midcap: Technical Analysis, Trends & YTD Performance | |
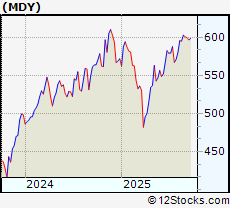
| MidCap segment as represented by
MDY, an exchange-traded fund [ETF], holds basket of about four hundred midcap stocks from across all major sectors of the US stock market. The midcap index (contains stocks like Green Mountain Coffee Roasters and Tractor Supply Company) is up by 5.96788% and is currently underperforming the overall market by -8.79002% year-to-date. Below is a quick view of technical charts and trends: | |
 MDY Weekly Chart |
|
| Long Term Trend: Very Good | |
| Medium Term Trend: Not Good | |
 MDY Daily Chart |
|
| Short Term Trend: Very Good | |
| Overall Trend Score: 70 | |
| YTD Performance: 5.96788% | |
| **Trend Scores & Views Are Only For Educational Purposes And Not For Investing | |
| 12Stocks.com: Investing in Midcap Index using Exchange Traded Funds | |
|
The following table shows list of key exchange traded funds (ETF) that
help investors track Midcap index. The following list also includes leveraged ETF funds that track twice or thrice the daily returns of Midcap indices. Short or inverse ETF funds move in the opposite direction to the index they track and are useful during market pullbacks or during bear markets. Quick View: Move mouse or cursor over ETF symbol (ticker) to view short-term technical chart and over ETF name to view long term chart. Click on ticker or stock name for detailed view. Click on to add stock symbol to your watchlist and to view watchlist. |
12Stocks.com List of ETFs that track Midcap Index
| Ticker | ETF Name | Watchlist | Recent Price | Smart Investing & Trading Score | Change % | Week % | Year-to-date % |
| IJH | iShares Core S&P Mid-Cap ETF | | 65.57 | 70 | 0.122156 | 0.814883 | 6.12728% |
| IWR | iShares Russell Mid-Cap ETF | | 96.94 | 80 | 0.435143 | 1.095 | 10.4451% |
| MDY | S&P MidCap 400 ETF | | 598.78 | 70 | 0.135458 | 0.799623 | 5.96788% |
| IWP | iShares Russell Mid-Cap Growth ETF | | 143.46 | 60 | 1.06375 | 0.709021 | 12.7484% |
| IWS | iShares Russell Mid-Cap Value ETF | | 140.24 | 90 | 0.293213 | 1.2417 | 9.61902% |
| XMLV | Invesco S&P MidCap Low Volatility ETF | | 63.15 | 40 | -0.468716 | 0.529449 | 5.75473% |
| IJK | iShares S&P Mid-Cap 400 Growth ETF | | 96.25 | 70 | 0.176936 | 0.669386 | 6.02707% |
| IJJ | iShares S&P Mid-Cap 400 Value ETF | | 130.47 | 70 | 0.138153 | 0.850274 | 5.90097% |
| MYY | ProShares Short Midcap400 -1x Shares | | 17.72 | 10 | -0.221847 | -0.638093 | -5.50223% |
| UMDD | ProShares UltraPro MidCap400 3x Shares | | 25.88 | 70 | 0.622084 | 2.09476 | -1.51345% |
| MZZ | ProShares UltraShort MidCap400 -2x Shares | | 8.16 | 10 | -0.237155 | -1.19976 | -15.2687% |
| MVV | ProShares Ultra MidCap400 2X Shares | | 69.74 | 70 | 0.273185 | 1.4105 | 3.63664% |
| SMDD | ProShares UltraPro Short MidCap400 -3x Shares | | 13.01 | 20 | -0.306513 | -1.99919 | -26.369% |
| 12Stocks.com: Charts, Trends, Fundamental Data and Performances of MidCap Stocks | |
|
We now take in-depth look at all MidCap stocks including charts, multi-period performances and overall trends (as measured by Smart Investing & Trading Score). One can sort MidCap stocks (click link to choose) by Daily, Weekly and by Year-to-Date performances. Also, one can sort by size of the company or by market capitalization. |
| Select Your Default Chart Type: | |||||
| |||||
| Click on stock symbol or name for detailed view. Click on to add stock symbol to your watchlist and to view watchlist. Quick View: Move mouse or cursor over "Daily" to quickly view daily technical stock chart and over "Weekly" to view weekly technical stock chart. | |||||

 | DASH DoorDash Inc |
| Sector: Services & Goods | |
| SubSector: Internet Retail | |
| MarketCap: 105453 Millions | |
| Recent Price: 270.17 Smart Investing & Trading Score: 40 | |
| Day Percent Change: 0.9453% Day Change: 1.46 | |
| Week Change: 3.61663% Year-to-date Change: 58.3% | |
| DASH Links: Profile News Message Board | |
| Charts:- Daily , Weekly | |
| Add DASH to Watchlist: View: Get Complete DASH Trend Analysis ➞ | |
 | RCL Royal Caribbean Group |
| Sector: Services & Goods | |
| SubSector: Travel Services | |
| MarketCap: 95686.3 Millions | |
| Recent Price: 320.11 Smart Investing & Trading Score: 20 | |
| Day Percent Change: 1.29422% Day Change: 2.73 | |
| Week Change: -2.11601% Year-to-date Change: 40.7% | |
| RCL Links: Profile News Message Board | |
| Charts:- Daily , Weekly | |
| Add RCL to Watchlist: View: Get Complete RCL Trend Analysis ➞ | |
 | HLT Hilton Worldwide Holdings Inc |
| Sector: Services & Goods | |
| SubSector: Lodging | |
| MarketCap: 64043.3 Millions | |
| Recent Price: 258.91 Smart Investing & Trading Score: 10 | |
| Day Percent Change: 0.841285% Day Change: 2.23 | |
| Week Change: -1.61873% Year-to-date Change: 5.7% | |
| HLT Links: Profile News Message Board | |
| Charts:- Daily , Weekly | |
| Add HLT to Watchlist: View: Get Complete HLT Trend Analysis ➞ | |
 | DHI D.R. Horton Inc |
| Sector: Services & Goods | |
| SubSector: Residential Construction | |
| MarketCap: 54198.9 Millions | |
| Recent Price: 171.47 Smart Investing & Trading Score: 80 | |
| Day Percent Change: -0.562514% Day Change: -1.17 | |
| Week Change: 2.40072% Year-to-date Change: 25.7% | |
| DHI Links: Profile News Message Board | |
| Charts:- Daily , Weekly | |
| Add DHI to Watchlist: View: Get Complete DHI Trend Analysis ➞ | |
 | CPNG Coupang Inc |
| Sector: Services & Goods | |
| SubSector: Internet Retail | |
| MarketCap: 52704.8 Millions | |
| Recent Price: 32.56 Smart Investing & Trading Score: 60 | |
| Day Percent Change: 0.400863% Day Change: -0.61 | |
| Week Change: 1.62297% Year-to-date Change: 46.1% | |
| CPNG Links: Profile News Message Board | |
| Charts:- Daily , Weekly | |
| Add CPNG to Watchlist: View: Get Complete CPNG Trend Analysis ➞ | |
 | ROST Ross Stores, Inc |
| Sector: Services & Goods | |
| SubSector: Apparel Retail | |
| MarketCap: 49371.3 Millions | |
| Recent Price: 156.17 Smart Investing & Trading Score: 100 | |
| Day Percent Change: 1.93864% Day Change: 3.42 | |
| Week Change: 4.51047% Year-to-date Change: 3.0% | |
| ROST Links: Profile News Message Board | |
| Charts:- Daily , Weekly | |
| Add ROST to Watchlist: View: Get Complete ROST Trend Analysis ➞ | |
 | EBAY EBay Inc |
| Sector: Services & Goods | |
| SubSector: Internet Retail | |
| MarketCap: 42345.6 Millions | |
| Recent Price: 88.40 Smart Investing & Trading Score: 0 | |
| Day Percent Change: 0.936287% Day Change: 0.98 | |
| Week Change: -5.31277% Year-to-date Change: 43.2% | |
| EBAY Links: Profile News Message Board | |
| Charts:- Daily , Weekly | |
| Add EBAY to Watchlist: View: Get Complete EBAY Trend Analysis ➞ | |
 | CCL Carnival Corp |
| Sector: Services & Goods | |
| SubSector: Travel Services | |
| MarketCap: 41060.4 Millions | |
| Recent Price: 28.85 Smart Investing & Trading Score: 10 | |
| Day Percent Change: 1.72779% Day Change: 0.45 | |
| Week Change: -5.00494% Year-to-date Change: 15.4% | |
| CCL Links: Profile News Message Board | |
| Charts:- Daily , Weekly | |
| Add CCL to Watchlist: View: Get Complete CCL Trend Analysis ➞ | |
 | YUM Yum Brands Inc |
| Sector: Services & Goods | |
| SubSector: Restaurants | |
| MarketCap: 40126.1 Millions | |
| Recent Price: 151.35 Smart Investing & Trading Score: 50 | |
| Day Percent Change: -1.20112% Day Change: -1.65 | |
| Week Change: 1.27133% Year-to-date Change: 14.4% | |
| YUM Links: Profile News Message Board | |
| Charts:- Daily , Weekly | |
| Add YUM to Watchlist: View: Get Complete YUM Trend Analysis ➞ | |
 | LEN Lennar Corp |
| Sector: Services & Goods | |
| SubSector: Residential Construction | |
| MarketCap: 36567.6 Millions | |
| Recent Price: 128.33 Smart Investing & Trading Score: 80 | |
| Day Percent Change: 0.0935964% Day Change: 0.01 | |
| Week Change: 2.10041% Year-to-date Change: 8.4% | |
| LEN Links: Profile News Message Board | |
| Charts:- Daily , Weekly | |
| Add LEN to Watchlist: View: Get Complete LEN Trend Analysis ➞ | |
 | TSCO Tractor Supply Co |
| Sector: Services & Goods | |
| SubSector: Specialty Retail | |
| MarketCap: 32072.7 Millions | |
| Recent Price: 56.23 Smart Investing & Trading Score: 10 | |
| Day Percent Change: 0.554363% Day Change: 0.27 | |
| Week Change: -1.95292% Year-to-date Change: 8.3% | |
| TSCO Links: Profile News Message Board | |
| Charts:- Daily , Weekly | |
| Add TSCO to Watchlist: View: Get Complete TSCO Trend Analysis ➞ | |
 | PHM PulteGroup Inc |
| Sector: Services & Goods | |
| SubSector: Residential Construction | |
| MarketCap: 27734.1 Millions | |
| Recent Price: 134.88 Smart Investing & Trading Score: 80 | |
| Day Percent Change: 0.327284% Day Change: 0.56 | |
| Week Change: 3.04049% Year-to-date Change: 25.8% | |
| PHM Links: Profile News Message Board | |
| Charts:- Daily , Weekly | |
| Add PHM to Watchlist: View: Get Complete PHM Trend Analysis ➞ | |
 | ROL Rollins, Inc |
| Sector: Services & Goods | |
| SubSector: Personal Services | |
| MarketCap: 27391.8 Millions | |
| Recent Price: 58.31 Smart Investing & Trading Score: 40 | |
| Day Percent Change: 0.309651% Day Change: 0.34 | |
| Week Change: 3.92087% Year-to-date Change: 27.8% | |
| ROL Links: Profile News Message Board | |
| Charts:- Daily , Weekly | |
| Add ROL to Watchlist: View: Get Complete ROL Trend Analysis ➞ | |
 | EXPE Expedia Group Inc |
| Sector: Services & Goods | |
| SubSector: Travel Services | |
| MarketCap: 26592.7 Millions | |
| Recent Price: 217.79 Smart Investing & Trading Score: 40 | |
| Day Percent Change: -0.0734113% Day Change: -1.31 | |
| Week Change: -0.0183629% Year-to-date Change: 18.0% | |
| EXPE Links: Profile News Message Board | |
| Charts:- Daily , Weekly | |
| Add EXPE to Watchlist: View: Get Complete EXPE Trend Analysis ➞ | |
 | IP International Paper Co |
| Sector: Services & Goods | |
| SubSector: Packaging & Containers | |
| MarketCap: 25707.4 Millions | |
| Recent Price: 46.65 Smart Investing & Trading Score: 60 | |
| Day Percent Change: 0.864865% Day Change: 0.13 | |
| Week Change: 0.864865% Year-to-date Change: -10.7% | |
| IP Links: Profile News Message Board | |
| Charts:- Daily , Weekly | |
| Add IP to Watchlist: View: Get Complete IP Trend Analysis ➞ | |
 | WSM Williams-Sonoma, Inc |
| Sector: Services & Goods | |
| SubSector: Specialty Retail | |
| MarketCap: 24652.8 Millions | |
| Recent Price: 196.14 Smart Investing & Trading Score: 50 | |
| Day Percent Change: 0.430108% Day Change: 0.2 | |
| Week Change: -2.12086% Year-to-date Change: 5.8% | |
| WSM Links: Profile News Message Board | |
| Charts:- Daily , Weekly | |
| Add WSM to Watchlist: View: Get Complete WSM Trend Analysis ➞ | |
 | DRI Darden Restaurants, Inc |
| Sector: Services & Goods | |
| SubSector: Restaurants | |
| MarketCap: 24593.5 Millions | |
| Recent Price: 193.49 Smart Investing & Trading Score: 60 | |
| Day Percent Change: 0.566528% Day Change: 0.87 | |
| Week Change: 3.68683% Year-to-date Change: 6.0% | |
| DRI Links: Profile News Message Board | |
| Charts:- Daily , Weekly | |
| Add DRI to Watchlist: View: Get Complete DRI Trend Analysis ➞ | |
 | NVR NVR Inc |
| Sector: Services & Goods | |
| SubSector: Residential Construction | |
| MarketCap: 24399.1 Millions | |
| Recent Price: 8071.61 Smart Investing & Trading Score: 60 | |
| Day Percent Change: 0.437132% Day Change: 34.57 | |
| Week Change: 0.435257% Year-to-date Change: 1.0% | |
| NVR Links: Profile News Message Board | |
| Charts:- Daily , Weekly | |
| Add NVR to Watchlist: View: Get Complete NVR Trend Analysis ➞ | |
 | ULTA Ulta Beauty Inc |
| Sector: Services & Goods | |
| SubSector: Specialty Retail | |
| MarketCap: 23085.5 Millions | |
| Recent Price: 557.82 Smart Investing & Trading Score: 100 | |
| Day Percent Change: 0.320121% Day Change: -1.68 | |
| Week Change: 4.14667% Year-to-date Change: 30.0% | |
| ULTA Links: Profile News Message Board | |
| Charts:- Daily , Weekly | |
| Add ULTA to Watchlist: View: Get Complete ULTA Trend Analysis ➞ | |
 | TPR Tapestry Inc |
| Sector: Services & Goods | |
| SubSector: Luxury Goods | |
| MarketCap: 21682.3 Millions | |
| Recent Price: 115.56 Smart Investing & Trading Score: 100 | |
| Day Percent Change: 1.51981% Day Change: 1.52 | |
| Week Change: 1.88679% Year-to-date Change: 77.6% | |
| TPR Links: Profile News Message Board | |
| Charts:- Daily , Weekly | |
| Add TPR to Watchlist: View: Get Complete TPR Trend Analysis ➞ | |
 | PKG Packaging Corp Of America |
| Sector: Services & Goods | |
| SubSector: Packaging & Containers | |
| MarketCap: 19817.8 Millions | |
| Recent Price: 215.64 Smart Investing & Trading Score: 50 | |
| Day Percent Change: 0.367698% Day Change: 0.15 | |
| Week Change: 0.148616% Year-to-date Change: -3.0% | |
| PKG Links: Profile News Message Board | |
| Charts:- Daily , Weekly | |
| Add PKG to Watchlist: View: Get Complete PKG Trend Analysis ➞ | |
 | GPC Genuine Parts Co |
| Sector: Services & Goods | |
| SubSector: Auto Parts | |
| MarketCap: 19403.4 Millions | |
| Recent Price: 140.39 Smart Investing & Trading Score: 70 | |
| Day Percent Change: 1.60672% Day Change: 2.06 | |
| Week Change: 1.28418% Year-to-date Change: 23.0% | |
| GPC Links: Profile News Message Board | |
| Charts:- Daily , Weekly | |
| Add GPC to Watchlist: View: Get Complete GPC Trend Analysis ➞ | |
 | AMCR Amcor Plc |
| Sector: Services & Goods | |
| SubSector: Packaging & Containers | |
| MarketCap: 19134.5 Millions | |
| Recent Price: 8.23 Smart Investing & Trading Score: 50 | |
| Day Percent Change: 0.4884% Day Change: 0.03 | |
| Week Change: 3.13283% Year-to-date Change: -9.6% | |
| AMCR Links: Profile News Message Board | |
| Charts:- Daily , Weekly | |
| Add AMCR to Watchlist: View: Get Complete AMCR Trend Analysis ➞ | |
 | RL Ralph Lauren Corp |
| Sector: Services & Goods | |
| SubSector: Apparel Manufacturing | |
| MarketCap: 18906.2 Millions | |
| Recent Price: 322.38 Smart Investing & Trading Score: 100 | |
| Day Percent Change: 1.5626% Day Change: 4.34 | |
| Week Change: 3.32361% Year-to-date Change: 40.2% | |
| RL Links: Profile News Message Board | |
| Charts:- Daily , Weekly | |
| Add RL to Watchlist: View: Get Complete RL Trend Analysis ➞ | |
 | CASY Casey's General Stores, Inc |
| Sector: Services & Goods | |
| SubSector: Specialty Retail | |
| MarketCap: 18800.2 Millions | |
| Recent Price: 561.23 Smart Investing & Trading Score: 90 | |
| Day Percent Change: 0.370198% Day Change: 1.18 | |
| Week Change: 2.59208% Year-to-date Change: 42.7% | |
| CASY Links: Profile News Message Board | |
| Charts:- Daily , Weekly | |
| Add CASY to Watchlist: View: Get Complete CASY Trend Analysis ➞ | |
| For tabular summary view of above stock list: Summary View ➞ 0 - 25 , 25 - 50 , 50 - 75 , 75 - 100 , 100 - 125 | ||
| Click To Change The Sort Order: By Market Cap or Company Size Performance: Year-to-date, Week and Day | |
| Select Chart Type: | ||
|
Best Stocks Today 12Stocks.com |
© 2025 12Stocks.com Terms & Conditions Privacy Contact Us
All Information Provided Only For Education And Not To Be Used For Investing or Trading. See Terms & Conditions


One More Thing ... Get Best Stocks Delivered Daily!
Never Ever Miss A Move With Our Top Ten Stocks Lists
Find Best Stocks In Any Market - Bull or Bear Market
Take A Peek At Our Top Ten Stocks Lists: Daily, Weekly, Year-to-Date & Top Trends
Find Best Stocks In Any Market - Bull or Bear Market
Take A Peek At Our Top Ten Stocks Lists: Daily, Weekly, Year-to-Date & Top Trends
Midcap Stocks With Best Up Trends [0-bearish to 100-bullish]: Fair Isaac[100], Sarepta [100], Ginkgo Bioworks[100], Acadia [100], Robinhood Markets[100], Sunrun [100], Confluent [100], MKS [100], Ionis [100], Bio-Techne Corp[100], DuPont de[100]
Best Midcap Stocks Year-to-Date:
Lucid [695.38%], MP Materials[332.947%], Wolfspeed [307.01%], Robinhood Markets[269.422%], SSR Mining[227.298%], Viasat [224.029%], Western Digital[181.204%], QuantumScape Corp[158.123%], Palantir Technologies[148.77%], Roblox [126.886%], Celsius [116.544%] Best Midcap Stocks This Week:
Wolfspeed [1961.98%], Splunk [38.7643%], Ginkgo Bioworks[38.5082%], Stericycle [31.4276%], Sarepta [22.3987%], Bio-Techne Corp[21.2222%], Electronic Arts[20.1076%], QuidelOrtho [19.7078%], Western Digital[19.6645%], Sunrun [19.4081%], Certara [19.0227%] Best Midcap Stocks Daily:
Fair Isaac[17.979%], Sarepta [15.6832%], Ginkgo Bioworks[8.86162%], Teladoc Health[8.71795%], Acadia [8.51324%], Agilon Health[8%], Coinbase Global[7.48187%], Celanese Corp[6.98937%], Bentley [6.91632%], AMC Entertainment[6.77966%], Kinsale Capital[6.00493%]