
 Login Sign Up


| |||||
 |  | ||||

| 12Stocks.com Market Intelligence |
Best Latin America Stocks
|
|
| Quick Read: Top Latin America Stocks By Performances & Trends: Daily, Weekly, Year-to-Date, Market Cap (Size) & Technical Trends | |||
| Best Latin America Views: Quick Browse View, Summary & Slide Show | |||
| 12Stocks.com Latin America Stocks Performances & Trends Daily | |||||||||
|
|  The overall market intelligence score is 40 (0-bearish to 100-bullish) which puts Latin America index in short term bearish to neutral trend. The market intelligence score from previous trading session is 50 and a deterioration of trend continues.
| ||||||||
Here are the market intelligence trend scores of the most requested Latin America stocks at 12Stocks.com (click stock name for detailed review):
| |||||||||||||||||||||||||
| Scroll down this page for most comprehensive review of Latin America stocks by performance, trends, technical analysis, charts, fund plays & more | |||||||||||||||||||||||||


| 12Stocks.com: Top Performing Latin America Index Stocks | ||||||||||||||||||||||||||||||||||||||||||||||||
 The top performing Latin America Index stocks year to date are
Now, more recently, over last week, the top performing Latin America Index stocks on the move are


|
||||||||||||||||||||||||||||||||||||||||||||||||
| 12Stocks.com: Investing in Latin America Index with Stocks | |
|
The following table helps investors and traders sort through current performance and trends (as measured by market intelligence score) of various
stocks in the Latin America Index. Quick View: Move mouse or cursor over stock symbol (ticker) to view short-term technical chart and over stock name to view long term chart. Click on  to add stock symbol to your watchlist and to add stock symbol to your watchlist and  to view watchlist. Click on any ticker or stock name for detailed market intelligence report for that stock. to view watchlist. Click on any ticker or stock name for detailed market intelligence report for that stock. |
12Stocks.com Performance of Stocks in Latin America Index
| Ticker | Stock Name | Watchlist | Category | Recent Price | Market Intelligence Score | Change % | YTD Change% |
| TRX | TRX Gold |   | Materials | 0.62 | 80 | -1.25% | 95.53% |
| PPP | Primero Mining | | Materials | 10.64 | 0 | 0.38% | 0.00% |
| NEPT | Neptune Wellness | | Health Care | 59.64 | 80 | 0.07% | 0.00% |
| PCOM | Points | | Technology | 42.14 | 70 | 4.33% | 0.00% |
| MSLI | Merus Labs | | Health Care | 31.79 | 20 | -2.18% | 0.00% |
| ONCY | Oncolytics Biotech | | Health Care | 1.42 | 100 | 0.00% | 52.72% |
| XRA | Exeter Resource | | Materials | 1.56 | 20 | -0.64% | 0.00% |
| CRME | Cardiome Pharma | | Health Care | 62.56 | 80 | 1.87% | 0.00% |
| CXRX | Concordia | | Health Care | 42.14 | 70 | 4.33% | 0.00% |
| GPL | Great Panther | | Materials | 32.25 | 100 | 2.19% | 0.00% |
| ALYA | Alithya | | Technology | 1.54 | 100 | 36.28% | 0.00% |
| IMV | IMV | | Health Care | 0.08 | 20 | 0.00% | 0.00% |
| LOOP | Loop Industries | | Materials | 1.61 | 60 | 8.05% | 36.44% |
| MDCA | MDC Partners | | Services & Goods | 11.25 | 80 | 0.27% | 0.00% |
| EGI | Entree Gold | | Materials | 43.29 | 80 | 0.00% | 0.00% |
| AUG | Auryn Resources | | Materials | 3.70 | 20 | -3.90% | 0.00% |
| HYGS | Hydrogenics | | Industrials | 1.57 | 20 | 1.29% | 0.00% |
| CRHM | CRH Medical | | Health Care | 18.50 | 80 | -6.04% | 0.00% |
| NTL | Nortel Inversora | | Technology | 3.84 | 70 | 4.63% | 0.00% |
| GSV | Gold Standard | | Materials | 0.40 | 30 | 0.00% | 0.00% |
| RPTX | Repare | | Health Care | 1.85 | 100 | 3.35% | 40.15% |
| IPCI | IntelliPharmaCeutics | | Health Care | 121.30 | 30 | -1.90% | 0.00% |
| DDMX | DD3 Acquisition | | Transports | 9.42 | 10 | 0.00% | 0.00% |
| SOLO | Electrameccanica Vehicles | | Consumer Staples | 0.21 | 20 | -3.55% | 0.00% |
| JE | Just Energy | | Utilities | 85.84 | 100 | 1.63% | 0.00% |
| To view more stocks, click on Next / Previous arrows or select different range: 0 - 25 , 25 - 50 , 50 - 75 , 75 - 100 , 100 - 125 , 125 - 150 , 150 - 175 , 175 - 200 , 200 - 225 , 225 - 250 , 250 - 275 , 275 - 300 , 300 - 325 | ||
 | Click To Change The Sort Order: By Market Cap or Company Size Performance: Year-to-date, Week and Day |  |
| Detailed Overview Of Latin America Stocks |
| Latin America Technical Overview, Leaders & Laggards, Top Latin America ETF Funds & Detailed Latin America Stocks List, Charts, Trends & More |
| Latin America: Technical Analysis, Trends & YTD Performance | |
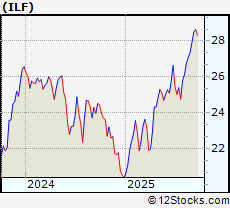
 ILF Weekly Chart |
|
| Long Term Trend: Very Good | |
| Medium Term Trend: Very Good | |
 ILF Daily Chart |
|
| Short Term Trend: Not Good | |
| Overall Trend Score: 40 | |
| YTD Performance: 37.1981% | |
| **Trend Scores & Views Are Only For Educational Purposes And Not For Investing | |
| 12Stocks.com: Investing in Latin America Index using Exchange Traded Funds | |
|
The following table shows list of key exchange traded funds (ETF) that
help investors play Latin America stock market. For detailed view, check out our ETF Funds section of our website. Quick View: Move mouse or cursor over ETF symbol (ticker) to view short-term technical chart and over ETF name to view long term chart. Click on ticker or stock name for detailed view. Click on to add stock symbol to your watchlist and to view watchlist. |
12Stocks.com List of ETFs that track Latin America Index
| Ticker | ETF Name | Watchlist | Recent Price | Market Intelligence Score | Change % | Week % | Year-to-date % |
| LBJ | Latin America Bull | | 60.40 | 50 | 0 | 0 | 0% |
| DBBR | Brazil Hedgd Eq | | 54.06 | 70 | -0.478645 | 0.632911 | 0% |
| FBZ | Brazil AlphaDEX | | 11.52 | 30 | 0 | 0 | 29.5955% |
| 12Stocks.com: Charts, Trends, Fundamental Data and Performances of Latin America Stocks | |
|
We now take in-depth look at all Latin America stocks including charts, multi-period performances and overall trends (as measured by market intelligence score). One can sort Latin America stocks (click link to choose) by Daily, Weekly and by Year-to-Date performances. Also, one can sort by size of the company or by market capitalization. |
| Select Your Default Chart Type: | |||||
| |||||
| Click on stock symbol or name for detailed view. Click on to add stock symbol to your watchlist and to view watchlist. Quick View: Move mouse or cursor over "Daily" to quickly view daily technical stock chart and over "Weekly" to view weekly technical stock chart. | |||||

 | TRX TRX Gold Corp |
| Sector: Materials | |
| SubSector: Gold | |
| MarketCap: 114.48 Millions | |
| Recent Price: 0.62 Market Intelligence Score: 80 | |
| Day Percent Change: -1.2482% Day Change: 0.01 | |
| Week Change: 2.86714% Year-to-date Change: 95.5% | |
| TRX Links: Profile News Message Board | |
| Charts:- Daily , Weekly | |
| Add TRX to Watchlist: View: Get Complete TRX Trend Analysis ➞ | |
 | PPP Primero Mining Corp. |
| Sector: Materials | |
| SubSector: Gold | |
| MarketCap: 114.12 Millions | |
| Recent Price: 10.64 Market Intelligence Score: 0 | |
| Day Percent Change: 0.377358% Day Change: -9999 | |
| Week Change: -23.2323% Year-to-date Change: 0.0% | |
| PPP Links: Profile News Message Board | |
| Charts:- Daily , Weekly | |
| Add PPP to Watchlist: View: Get Complete PPP Trend Analysis ➞ | |
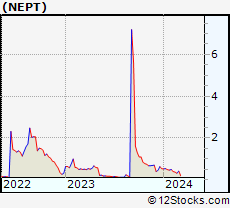 | NEPT Neptune Wellness Solutions Inc. |
| Sector: Health Care | |
| SubSector: Biotechnology | |
| MarketCap: 113.785 Millions | |
| Recent Price: 59.64 Market Intelligence Score: 80 | |
| Day Percent Change: 0.0671141% Day Change: -9999 | |
| Week Change: 14100% Year-to-date Change: 0.0% | |
| NEPT Links: Profile News Message Board | |
| Charts:- Daily , Weekly | |
| Add NEPT to Watchlist: View: Get Complete NEPT Trend Analysis ➞ | |
 | PCOM Points International Ltd. |
| Sector: Technology | |
| SubSector: Internet Information Providers | |
| MarketCap: 111.98 Millions | |
| Recent Price: 42.14 Market Intelligence Score: 70 | |
| Day Percent Change: 4.33276% Day Change: -9999 | |
| Week Change: 68.6274% Year-to-date Change: 0.0% | |
| PCOM Links: Profile News Message Board | |
| Charts:- Daily , Weekly | |
| Add PCOM to Watchlist: View: Get Complete PCOM Trend Analysis ➞ | |
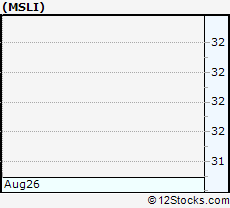 | MSLI Merus Labs International Inc. |
| Sector: Health Care | |
| SubSector: Drug Manufacturers - Other | |
| MarketCap: 109.34 Millions | |
| Recent Price: 31.79 Market Intelligence Score: 20 | |
| Day Percent Change: -2.18462% Day Change: -9999 | |
| Week Change: -29.3556% Year-to-date Change: 0.0% | |
| MSLI Links: Profile News Message Board | |
| Charts:- Daily , Weekly | |
| Add MSLI to Watchlist: View: Get Complete MSLI Trend Analysis ➞ | |
 | ONCY Oncolytics Biotech, Inc |
| Sector: Health Care | |
| SubSector: Biotechnology | |
| MarketCap: 107.32 Millions | |
| Recent Price: 1.42 Market Intelligence Score: 100 | |
| Day Percent Change: 0% Day Change: 0 | |
| Week Change: 13.6% Year-to-date Change: 52.7% | |
| ONCY Links: Profile News Message Board | |
| Charts:- Daily , Weekly | |
| Add ONCY to Watchlist: View: Get Complete ONCY Trend Analysis ➞ | |
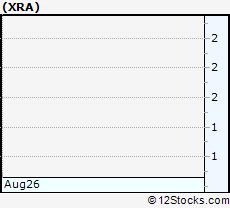 | XRA Exeter Resource Corporation |
| Sector: Materials | |
| SubSector: Gold | |
| MarketCap: 105.97 Millions | |
| Recent Price: 1.56 Market Intelligence Score: 20 | |
| Day Percent Change: -0.636943% Day Change: -9999 | |
| Week Change: -53.012% Year-to-date Change: 0.0% | |
| XRA Links: Profile News Message Board | |
| Charts:- Daily , Weekly | |
| Add XRA to Watchlist: View: Get Complete XRA Trend Analysis ➞ | |
 | CRME Cardiome Pharma Corp. |
| Sector: Health Care | |
| SubSector: Drug Manufacturers - Other | |
| MarketCap: 101.35 Millions | |
| Recent Price: 62.56 Market Intelligence Score: 80 | |
| Day Percent Change: 1.87266% Day Change: -9999 | |
| Week Change: 4.15383% Year-to-date Change: 0.0% | |
| CRME Links: Profile News Message Board | |
| Charts:- Daily , Weekly | |
| Add CRME to Watchlist: View: Get Complete CRME Trend Analysis ➞ | |
 | CXRX Concordia International Corp. |
| Sector: Health Care | |
| SubSector: Biotechnology | |
| MarketCap: 101.01 Millions | |
| Recent Price: 42.14 Market Intelligence Score: 70 | |
| Day Percent Change: 4.33276% Day Change: -9999 | |
| Week Change: 283.789% Year-to-date Change: 0.0% | |
| CXRX Links: Profile News Message Board | |
| Charts:- Daily , Weekly | |
| Add CXRX to Watchlist: View: Get Complete CXRX Trend Analysis ➞ | |
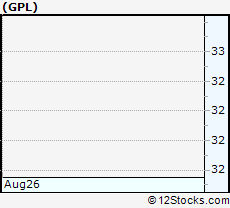 | GPL Great Panther Mining Limited |
| Sector: Materials | |
| SubSector: Silver | |
| MarketCap: 96.9456 Millions | |
| Recent Price: 32.25 Market Intelligence Score: 100 | |
| Day Percent Change: 2.18631% Day Change: -9999 | |
| Week Change: 33847.4% Year-to-date Change: 0.0% | |
| GPL Links: Profile News Message Board | |
| Charts:- Daily , Weekly | |
| Add GPL to Watchlist: View: Get Complete GPL Trend Analysis ➞ | |
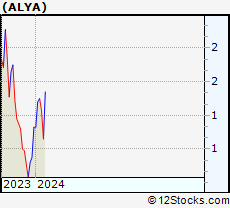 | ALYA Alithya Group Inc. |
| Sector: Technology | |
| SubSector: Information Technology Services | |
| MarketCap: 93.5468 Millions | |
| Recent Price: 1.54 Market Intelligence Score: 100 | |
| Day Percent Change: 36.2832% Day Change: -9999 | |
| Week Change: 27.2727% Year-to-date Change: 0.0% | |
| ALYA Links: Profile News Message Board | |
| Charts:- Daily , Weekly | |
| Add ALYA to Watchlist: View: Get Complete ALYA Trend Analysis ➞ | |
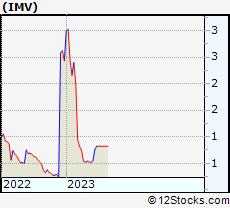 | IMV IMV Inc. |
| Sector: Health Care | |
| SubSector: Biotechnology | |
| MarketCap: 89.1785 Millions | |
| Recent Price: 0.08 Market Intelligence Score: 20 | |
| Day Percent Change: 0% Day Change: -9999 | |
| Week Change: -1.09756% Year-to-date Change: 0.0% | |
| IMV Links: Profile News Message Board | |
| Charts:- Daily , Weekly | |
| Add IMV to Watchlist: View: Get Complete IMV Trend Analysis ➞ | |
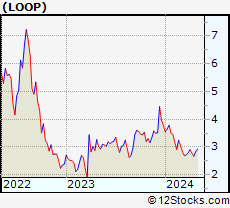 | LOOP Loop Industries Inc |
| Sector: Materials | |
| SubSector: Specialty Chemicals | |
| MarketCap: 88.76 Millions | |
| Recent Price: 1.61 Market Intelligence Score: 60 | |
| Day Percent Change: 8.05369% Day Change: -0.03 | |
| Week Change: -3.59281% Year-to-date Change: 36.4% | |
| LOOP Links: Profile News Message Board | |
| Charts:- Daily , Weekly | |
| Add LOOP to Watchlist: View: Get Complete LOOP Trend Analysis ➞ | |
 | MDCA MDC Partners Inc. |
| Sector: Services & Goods | |
| SubSector: Marketing Services | |
| MarketCap: 84.9015 Millions | |
| Recent Price: 11.25 Market Intelligence Score: 80 | |
| Day Percent Change: 0.26738% Day Change: -9999 | |
| Week Change: 107.565% Year-to-date Change: 0.0% | |
| MDCA Links: Profile News Message Board | |
| Charts:- Daily , Weekly | |
| Add MDCA to Watchlist: View: Get Complete MDCA Trend Analysis ➞ | |
 | EGI Entree Gold Inc. |
| Sector: Materials | |
| SubSector: Gold | |
| MarketCap: 84.5 Millions | |
| Recent Price: 43.29 Market Intelligence Score: 80 | |
| Day Percent Change: 0% Day Change: -9999 | |
| Week Change: 113.356% Year-to-date Change: 0.0% | |
| EGI Links: Profile News Message Board | |
| Charts:- Daily , Weekly | |
| Add EGI to Watchlist: View: Get Complete EGI Trend Analysis ➞ | |
 | AUG Auryn Resources Inc. |
| Sector: Materials | |
| SubSector: Industrial Metals & Minerals | |
| MarketCap: 82.291 Millions | |
| Recent Price: 3.70 Market Intelligence Score: 20 | |
| Day Percent Change: -3.8961% Day Change: -9999 | |
| Week Change: -21.7759% Year-to-date Change: 0.0% | |
| AUG Links: Profile News Message Board | |
| Charts:- Daily , Weekly | |
| Add AUG to Watchlist: View: Get Complete AUG Trend Analysis ➞ | |
 | HYGS Hydrogenics Corporation |
| Sector: Industrials | |
| SubSector: Industrial Electrical Equipment | |
| MarketCap: 81.15 Millions | |
| Recent Price: 1.57 Market Intelligence Score: 20 | |
| Day Percent Change: 1.29032% Day Change: -9999 | |
| Week Change: -64.5598% Year-to-date Change: 0.0% | |
| HYGS Links: Profile News Message Board | |
| Charts:- Daily , Weekly | |
| Add HYGS to Watchlist: View: Get Complete HYGS Trend Analysis ➞ | |
 | CRHM CRH Medical Corporation |
| Sector: Health Care | |
| SubSector: Medical Instruments & Supplies | |
| MarketCap: 80.286 Millions | |
| Recent Price: 18.50 Market Intelligence Score: 80 | |
| Day Percent Change: -6.04368% Day Change: -9999 | |
| Week Change: 363.659% Year-to-date Change: 0.0% | |
| CRHM Links: Profile News Message Board | |
| Charts:- Daily , Weekly | |
| Add CRHM to Watchlist: View: Get Complete CRHM Trend Analysis ➞ | |
 | NTL Nortel Inversora S.A. |
| Sector: Technology | |
| SubSector: Telecom Services - Foreign | |
| MarketCap: 77.14 Millions | |
| Recent Price: 3.84 Market Intelligence Score: 70 | |
| Day Percent Change: 4.63215% Day Change: -9999 | |
| Week Change: 118.182% Year-to-date Change: 0.0% | |
| NTL Links: Profile News Message Board | |
| Charts:- Daily , Weekly | |
| Add NTL to Watchlist: View: Get Complete NTL Trend Analysis ➞ | |
 | GSV Gold Standard Ventures Corp |
| Sector: Materials | |
| SubSector: Gold | |
| MarketCap: 75.2619 Millions | |
| Recent Price: 0.40 Market Intelligence Score: 30 | |
| Day Percent Change: 0% Day Change: -9999 | |
| Week Change: 0% Year-to-date Change: 0.0% | |
| GSV Links: Profile News Message Board | |
| Charts:- Daily , Weekly | |
| Add GSV to Watchlist: View: Get Complete GSV Trend Analysis ➞ | |
 | RPTX Repare Therapeutics Inc |
| Sector: Health Care | |
| SubSector: Biotechnology | |
| MarketCap: 72.6 Millions | |
| Recent Price: 1.85 Market Intelligence Score: 100 | |
| Day Percent Change: 3.35196% Day Change: 0.01 | |
| Week Change: 7.24638% Year-to-date Change: 40.2% | |
| RPTX Links: Profile News Message Board | |
| Charts:- Daily , Weekly | |
| Add RPTX to Watchlist: View: Get Complete RPTX Trend Analysis ➞ | |
 | IPCI IntelliPharmaCeutics International Inc. |
| Sector: Health Care | |
| SubSector: Drug Delivery | |
| MarketCap: 72.59 Millions | |
| Recent Price: 121.30 Market Intelligence Score: 30 | |
| Day Percent Change: -1.90053% Day Change: -9999 | |
| Week Change: -13.0092% Year-to-date Change: 0.0% | |
| IPCI Links: Profile News Message Board | |
| Charts:- Daily , Weekly | |
| Add IPCI to Watchlist: View: Get Complete IPCI Trend Analysis ➞ | |
 | DDMX DD3 Acquisition Corp. |
| Sector: Transports | |
| SubSector: Trucking | |
| MarketCap: 65.7915 Millions | |
| Recent Price: 9.42 Market Intelligence Score: 10 | |
| Day Percent Change: 0% Day Change: -9999 | |
| Week Change: -4.84848% Year-to-date Change: 0.0% | |
| DDMX Links: Profile News Message Board | |
| Charts:- Daily , Weekly | |
| Add DDMX to Watchlist: View: Get Complete DDMX Trend Analysis ➞ | |
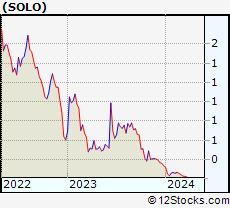 | SOLO Electrameccanica Vehicles Corp. |
| Sector: Consumer Staples | |
| SubSector: Auto Manufacturers - Major | |
| MarketCap: 61.6471 Millions | |
| Recent Price: 0.21 Market Intelligence Score: 20 | |
| Day Percent Change: -3.54545% Day Change: -9999 | |
| Week Change: -6.06463% Year-to-date Change: 0.0% | |
| SOLO Links: Profile News Message Board | |
| Charts:- Daily , Weekly | |
| Add SOLO to Watchlist: View: Get Complete SOLO Trend Analysis ➞ | |
 | JE Just Energy Group Inc. |
| Sector: Utilities | |
| SubSector: Diversified Utilities | |
| MarketCap: 57.668 Millions | |
| Recent Price: 85.84 Market Intelligence Score: 100 | |
| Day Percent Change: 1.63391% Day Change: -9999 | |
| Week Change: 8441.29% Year-to-date Change: 0.0% | |
| JE Links: Profile News Message Board | |
| Charts:- Daily , Weekly | |
| Add JE to Watchlist: View: Get Complete JE Trend Analysis ➞ | |
| To view more stocks, click on Next / Previous arrows or select different range: 0 - 25 , 25 - 50 , 50 - 75 , 75 - 100 , 100 - 125 , 125 - 150 , 150 - 175 , 175 - 200 , 200 - 225 , 225 - 250 , 250 - 275 , 275 - 300 , 300 - 325 | ||
| Click To Change The Sort Order: By Market Cap or Company Size Performance: Year-to-date, Week and Day | |
| Select Chart Type: | ||
 Best Stocks Today 12Stocks.com |
© 2025 12Stocks.com Terms & Conditions Privacy Contact Us
All Information Provided Only For Education And Not To Be Used For Investing or Trading. See Terms & Conditions


One More Thing ... Get Best Stocks Delivered Daily!
Never Ever Miss A Move With Our Top Ten Stocks Lists
Find Best Stocks In Any Market - Bull or Bear Market
Take A Peek At Our Top Ten Stocks Lists: Daily, Weekly, Year-to-Date & Top Trends
Find Best Stocks In Any Market - Bull or Bear Market
Take A Peek At Our Top Ten Stocks Lists: Daily, Weekly, Year-to-Date & Top Trends
Latin America Stocks With Best Up Trends [0-bearish to 100-bullish]: Milestone [100], BRP [100], Turquoise Hill[100], Canada Goose[100], Canadian Solar[100], Nevsun Resources[100], Iamgold Corp[100], Bellatrix Exploration[100], Silvercorp Metals[100], Gerdau S.A.[100], Crescent Point[100]
Best Latin America Stocks Year-to-Date:
Americas Gold[892.308%], Avino Silver[437.523%], Tower[254.565%], Gold Royalty[206.452%], EMX Royalty[189.655%], New Gold[180.534%], Celestica [169.593%], Kinross Gold[153.727%], Iamgold Corp[138.172%], Lithium Americas[124.183%], Vasta Platform[119.556%] Best Latin America Stocks This Week:
Companhia Brasileira[18587.4%], Cosan [16415.2%], Crescent Point[4066.17%], Golden Star[1837.95%], Grupo Financiero[1283.52%], Alexco Resource[690.301%], Yamana Gold[625.812%], Novelion [579.167%], Turquoise Hill[433.11%], Enerplus [415.601%], Nevsun Resources[402.516%] Best Latin America Stocks Daily:
Novelion [7.37813%], Ambipar Emergency[6.89655%], Grupo Supervielle[6.39659%], Milestone [6.34146%], Nutrien [5.50945%], Grupo Financiero[4.91926%], Mitel Networks[4.5045%], BRP [4.30981%], Empresa Distribuidora[4.06396%], Pampa Energia[4.0515%], Loma Negra[3.92707%]