
 Login Sign Up


| |||||
 |  | ||||

| 12Stocks.com Market Intelligence |
Best Industrial Stocks
| In a hurry? Industrial Stocks Lists: Performance Trends Table, Stock Charts
Sort Industrial stocks: Daily, Weekly, Year-to-Date, Market Cap & Trends. Filter Industrial stocks list by size:All Industrial Large Mid-Range Small |
| 12Stocks.com Industrial Stocks Performances & Trends Daily | |||||||||
|
|  The overall Smart Investing & Trading Score is 56 (0-bearish to 100-bullish) which puts Industrial sector in short term neutral trend. The Smart Investing & Trading Score from previous trading session is 63 and a deterioration of trend continues.
| ||||||||
Here are the Smart Investing & Trading Scores of the most requested Industrial stocks at 12Stocks.com (click stock name for detailed review):
|


| 12Stocks.com: Investing in Industrial sector with Stocks | |
|
The following table helps investors and traders sort through current performance and trends (as measured by Smart Investing & Trading Score) of various
stocks in the Industrial sector. Quick View: Move mouse or cursor over stock symbol (ticker) to view short-term Technical chart and over stock name to view long term chart. Click on  to add stock symbol to your watchlist and to add stock symbol to your watchlist and  to view watchlist. Click on any ticker or stock name for detailed market intelligence report for that stock. to view watchlist. Click on any ticker or stock name for detailed market intelligence report for that stock. |
12Stocks.com Performance of Stocks in Industrial Sector
| Ticker | Stock Name | Watchlist | Category | Recent Price | Smart Investing & Trading Score | Change % | YTD Change% |
| SLND | Southland |   | Engineering & Construction | 4.19 | 0 | -4.99% | -18.80% |
| TGI | Triumph | | Aerospace/Defense | 13.42 | 35 | -0.30% | -19.06% |
| BBCP | Concrete Pumping | | Building Materials | 6.63 | 10 | 0.91% | -19.15% |
| PRLB | Proto Labs | | Machine Tools | 31.42 | 20 | -1.66% | -19.35% |
| LEGH | Legacy Housing | | Residential | 20.10 | 28 | -0.54% | -20.30% |
| KRNT | Kornit Digital | | Machinery | 15.21 | 35 | -4.94% | -20.62% |
| CULP | Culp | | Textile Industrial | 4.59 | 35 | 0.44% | -20.73% |
| SYM | Symbotic | | Specialty Industrial Machinery | 39.55 | 0 | -2.06% | -22.28% |
| TWI | Titan | | Machinery | 11.51 | 28 | -2.46% | -22.65% |
| JOBY | Joby Aviation | | Airports & Air | 5.10 | 49 | 6.14% | -23.19% |
| MTW | Manitowoc | | Machinery | 12.79 | 8 | -2.14% | -23.37% |
| ERII | Energy Recovery | | Pollution & Treatment Controls | 14.19 | 42 | 1.50% | -24.68% |
| AMN | AMN Healthcare | | Building Materials | 56.25 | 38 | -1.64% | -24.88% |
| ZIP | ZipRecruiter | | Staffing & Employment | 10.49 | 28 | -0.14% | -25.15% |
| CRGO | Freightos | | Integrated Freight & Logistics | 2.63 | 67 | -4.01% | -25.39% |
| SST | System1 | | Specialty | 1.79 | 36 | -4.79% | -25.73% |
| LILM | Lilium N.V | | Aerospace & Defense | 0.89 | 33 | -2.85% | -26.14% |
| EAF | GrafTech | | Machinery | 1.61 | 66 | -2.42% | -26.48% |
| GMRE | Global Medical | | Conglomerates | 8.09 | 28 | -0.86% | -27.12% |
| SATL | Satellogic | | Aerospace & Defense | 1.22 | 35 | -2.40% | -28.24% |
| PL | Planet Labs | | Aerospace & Defense | 1.76 | 37 | -1.40% | -29.03% |
| BAER | Bridger Aerospace | | Security & Protection | 4.86 | 35 | -1.82% | -30.77% |
| EVEX | Eve Holding | | Aerospace & Defense | 5.01 | 37 | 1.31% | -31.93% |
| BLDP | Ballard Power | | Electrical Equipment | 2.47 | 10 | -2.76% | -33.24% |
| RKLB | Rocket Lab | | Aerospace & Defense | 3.65 | 20 | 0.14% | -33.76% |
| For chart view version of above stock list: Chart View ➞ 0 - 25 , 25 - 50 , 50 - 75 , 75 - 100 , 100 - 125 , 125 - 150 , 150 - 175 , 175 - 200 , 200 - 225 , 225 - 250 , 250 - 275 , 275 - 300 | ||
 | Click To Change The Sort Order: By Market Cap or Company Size Performance: Year-to-date, Week and Day |  |
|
Get the most comprehensive stock market coverage daily at 12Stocks.com ➞ Best Stocks Today ➞ Best Stocks Weekly ➞ Best Stocks Year-to-Date ➞ Best Stocks Trends ➞  Best Stocks Today 12Stocks.com Best Nasdaq Stocks ➞ Best S&P 500 Stocks ➞ Best Tech Stocks ➞ Best Biotech Stocks ➞ |
| Detailed Overview of Industrial Stocks |
| Industrial Technical Overview, Leaders & Laggards, Top Industrial ETF Funds & Detailed Industrial Stocks List, Charts, Trends & More |
| Industrial Sector: Technical Analysis, Trends & YTD Performance | |
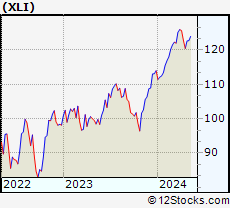
| Industrial sector is composed of stocks
from industrial machinery, aerospace, defense, farm/construction
and industrial services subsectors. Industrial sector, as represented by XLI, an exchange-traded fund [ETF] that holds basket of Industrial stocks (e.g, Caterpillar, Boeing) is up by 7.43% and is currently outperforming the overall market by 2.27% year-to-date. Below is a quick view of Technical charts and trends: |
|
 XLI Weekly Chart |
|
| Long Term Trend: Very Good | |
| Medium Term Trend: Not Good | |
 XLI Daily Chart |
|
| Short Term Trend: Very Good | |
| Overall Trend Score: 56 | |
| YTD Performance: 7.43% | |
| **Trend Scores & Views Are Only For Educational Purposes And Not For Investing | |
| 12Stocks.com: Top Performing Industrial Sector Stocks | ||||||||||||||||||||||||||||||||||||||||||||||||
 The top performing Industrial sector stocks year to date are
Now, more recently, over last week, the top performing Industrial sector stocks on the move are


|
||||||||||||||||||||||||||||||||||||||||||||||||
| 12Stocks.com: Investing in Industrial Sector using Exchange Traded Funds | |
|
The following table shows list of key exchange traded funds (ETF) that
help investors track Industrial Index. For detailed view, check out our ETF Funds section of our website. Quick View: Move mouse or cursor over ETF symbol (ticker) to view short-term Technical chart and over ETF name to view long term chart. Click on ticker or stock name for detailed view. Click on to add stock symbol to your watchlist and to view watchlist. |
12Stocks.com List of ETFs that track Industrial Index
| Ticker | ETF Name | Watchlist | Recent Price | Smart Investing & Trading Score | Change % | Week % | Year-to-date % |
| XLI | Industrial | | 122.46 | 56 | 0.30 | 1.65 | 7.43% |
| UXI | Industrials | | 31.61 | 41 | -1.22 | 0.19 | 9.78% |
| PPA | Aerospace & Defense | | 100.35 | 63 | 0.57 | 2.08 | 8.89% |
| ITA | Aerospace & Defense | | 129.01 | 56 | 0.39 | 0.79 | 1.9% |
| ITB | Home Construction | | 104.41 | 51 | -0.32 | 2 | 2.63% |
| XHB | Homebuilders | | 102.47 | 51 | -0.16 | 2.31 | 7.12% |
| SIJ | Short Industrials | | 9.92 | 39 | -0.40 | -3.06 | -12.52% |
| IYJ | Industrials | | 121.30 | 41 | 0.06 | 1.58 | 6.07% |
| EXI | Global Industrials | | 134.82 | 41 | -0.32 | 1.36 | 5.8% |
| VIS | Industrials | | 236.22 | 56 | 0.29 | 1.73 | 7.16% |
| PSCI | SmallCap Industrials | | 121.06 | 56 | -0.19 | 1.87 | 4.4% |
| XAR | Aerospace & Defense | | 134.60 | 58 | -0.03 | 1.79 | -0.61% |
| ARKQ | ARK Industrial Innovation | | 52.05 | 10 | 0.68 | 4.39 | -9.79% |
| 12Stocks.com: Charts, Trends, Fundamental Data and Performances of Industrial Stocks | |
|
We now take in-depth look at all Industrial stocks including charts, multi-period performances and overall trends (as measured by Smart Investing & Trading Score). One can sort Industrial stocks (click link to choose) by Daily, Weekly and by Year-to-Date performances. Also, one can sort by size of the company or by market capitalization. |
| Select Your Default Chart Type: | |||||
| |||||
| Click on stock symbol or name for detailed view. Click on to add stock symbol to your watchlist and to view watchlist. Quick View: Move mouse or cursor over "Daily" to quickly view daily Technical stock chart and over "Weekly" to view weekly Technical stock chart. | |||||

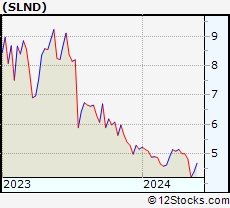 | SLND Southland Holdings, Inc. |
| Sector: Industrials | |
| SubSector: Engineering & Construction | |
| MarketCap: 388 Millions | |
| Recent Price: 4.19 Smart Investing & Trading Score: 0 | |
| Day Percent Change: -4.99% Day Change: -0.22 | |
| Week Change: -13.07% Year-to-date Change: -18.8% | |
| SLND Links: Profile News Message Board | |
| Charts:- Daily , Weekly | |
| Add SLND to Watchlist: View: Get Complete SLND Trend Analysis ➞ | |
 | TGI Triumph Group, Inc. |
| Sector: Industrials | |
| SubSector: Aerospace/Defense Products & Services | |
| MarketCap: 358.901 Millions | |
| Recent Price: 13.42 Smart Investing & Trading Score: 35 | |
| Day Percent Change: -0.30% Day Change: -0.04 | |
| Week Change: 4.68% Year-to-date Change: -19.1% | |
| TGI Links: Profile News Message Board | |
| Charts:- Daily , Weekly | |
| Add TGI to Watchlist: View: Get Complete TGI Trend Analysis ➞ | |
 | BBCP Concrete Pumping Holdings, Inc. |
| Sector: Industrials | |
| SubSector: General Building Materials | |
| MarketCap: 263.653 Millions | |
| Recent Price: 6.63 Smart Investing & Trading Score: 10 | |
| Day Percent Change: 0.91% Day Change: 0.06 | |
| Week Change: -0.45% Year-to-date Change: -19.2% | |
| BBCP Links: Profile News Message Board | |
| Charts:- Daily , Weekly | |
| Add BBCP to Watchlist: View: Get Complete BBCP Trend Analysis ➞ | |
 | PRLB Proto Labs, Inc. |
| Sector: Industrials | |
| SubSector: Machine Tools & Accessories | |
| MarketCap: 1944.78 Millions | |
| Recent Price: 31.42 Smart Investing & Trading Score: 20 | |
| Day Percent Change: -1.66% Day Change: -0.53 | |
| Week Change: -1.69% Year-to-date Change: -19.4% | |
| PRLB Links: Profile News Message Board | |
| Charts:- Daily , Weekly | |
| Add PRLB to Watchlist: View: Get Complete PRLB Trend Analysis ➞ | |
 | LEGH Legacy Housing Corporation |
| Sector: Industrials | |
| SubSector: Residential Construction | |
| MarketCap: 298.006 Millions | |
| Recent Price: 20.10 Smart Investing & Trading Score: 28 | |
| Day Percent Change: -0.54% Day Change: -0.11 | |
| Week Change: 0.8% Year-to-date Change: -20.3% | |
| LEGH Links: Profile News Message Board | |
| Charts:- Daily , Weekly | |
| Add LEGH to Watchlist: View: Get Complete LEGH Trend Analysis ➞ | |
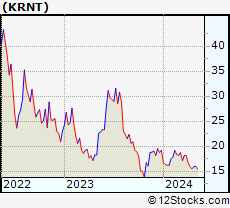 | KRNT Kornit Digital Ltd. |
| Sector: Industrials | |
| SubSector: Diversified Machinery | |
| MarketCap: 1101.86 Millions | |
| Recent Price: 15.21 Smart Investing & Trading Score: 35 | |
| Day Percent Change: -4.94% Day Change: -0.79 | |
| Week Change: -1.74% Year-to-date Change: -20.6% | |
| KRNT Links: Profile News Message Board | |
| Charts:- Daily , Weekly | |
| Add KRNT to Watchlist: View: Get Complete KRNT Trend Analysis ➞ | |
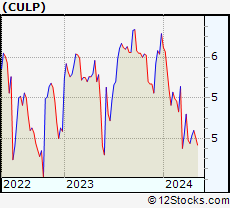 | CULP Culp, Inc. |
| Sector: Industrials | |
| SubSector: Textile Industrial | |
| MarketCap: 107.24 Millions | |
| Recent Price: 4.59 Smart Investing & Trading Score: 35 | |
| Day Percent Change: 0.44% Day Change: 0.02 | |
| Week Change: 1.1% Year-to-date Change: -20.7% | |
| CULP Links: Profile News Message Board | |
| Charts:- Daily , Weekly | |
| Add CULP to Watchlist: View: Get Complete CULP Trend Analysis ➞ | |
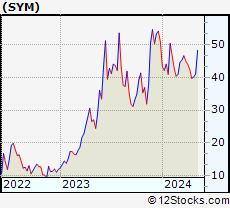 | SYM Symbotic Inc. |
| Sector: Industrials | |
| SubSector: Specialty Industrial Machinery | |
| MarketCap: 24000 Millions | |
| Recent Price: 39.55 Smart Investing & Trading Score: 0 | |
| Day Percent Change: -2.06% Day Change: -0.83 | |
| Week Change: -0.45% Year-to-date Change: -22.3% | |
| SYM Links: Profile News Message Board | |
| Charts:- Daily , Weekly | |
| Add SYM to Watchlist: View: Get Complete SYM Trend Analysis ➞ | |
 | TWI Titan International, Inc. |
| Sector: Industrials | |
| SubSector: Farm & Construction Machinery | |
| MarketCap: 104.607 Millions | |
| Recent Price: 11.51 Smart Investing & Trading Score: 28 | |
| Day Percent Change: -2.46% Day Change: -0.29 | |
| Week Change: -0.17% Year-to-date Change: -22.7% | |
| TWI Links: Profile News Message Board | |
| Charts:- Daily , Weekly | |
| Add TWI to Watchlist: View: Get Complete TWI Trend Analysis ➞ | |
 | JOBY Joby Aviation, Inc. |
| Sector: Industrials | |
| SubSector: Airports & Air Services | |
| MarketCap: 5810 Millions | |
| Recent Price: 5.10 Smart Investing & Trading Score: 49 | |
| Day Percent Change: 6.14% Day Change: 0.29 | |
| Week Change: 12.33% Year-to-date Change: -23.2% | |
| JOBY Links: Profile News Message Board | |
| Charts:- Daily , Weekly | |
| Add JOBY to Watchlist: View: Get Complete JOBY Trend Analysis ➞ | |
 | MTW The Manitowoc Company, Inc. |
| Sector: Industrials | |
| SubSector: Farm & Construction Machinery | |
| MarketCap: 373.707 Millions | |
| Recent Price: 12.79 Smart Investing & Trading Score: 8 | |
| Day Percent Change: -2.14% Day Change: -0.28 | |
| Week Change: -0.7% Year-to-date Change: -23.4% | |
| MTW Links: Profile News Message Board | |
| Charts:- Daily , Weekly | |
| Add MTW to Watchlist: View: Get Complete MTW Trend Analysis ➞ | |
 | ERII Energy Recovery, Inc. |
| Sector: Industrials | |
| SubSector: Pollution & Treatment Controls | |
| MarketCap: 429.375 Millions | |
| Recent Price: 14.19 Smart Investing & Trading Score: 42 | |
| Day Percent Change: 1.50% Day Change: 0.21 | |
| Week Change: 3.5% Year-to-date Change: -24.7% | |
| ERII Links: Profile News Message Board | |
| Charts:- Daily , Weekly | |
| Add ERII to Watchlist: View: Get Complete ERII Trend Analysis ➞ | |
 | AMN AMN Healthcare Services, Inc. |
| Sector: Industrials | |
| SubSector: General Building Materials | |
| MarketCap: 3064.03 Millions | |
| Recent Price: 56.25 Smart Investing & Trading Score: 38 | |
| Day Percent Change: -1.64% Day Change: -0.94 | |
| Week Change: -1.23% Year-to-date Change: -24.9% | |
| AMN Links: Profile News Message Board | |
| Charts:- Daily , Weekly | |
| Add AMN to Watchlist: View: Get Complete AMN Trend Analysis ➞ | |
 | ZIP ZipRecruiter, Inc. |
| Sector: Industrials | |
| SubSector: Staffing & Employment Services | |
| MarketCap: 1730 Millions | |
| Recent Price: 10.49 Smart Investing & Trading Score: 28 | |
| Day Percent Change: -0.14% Day Change: -0.02 | |
| Week Change: -0.29% Year-to-date Change: -25.2% | |
| ZIP Links: Profile News Message Board | |
| Charts:- Daily , Weekly | |
| Add ZIP to Watchlist: View: Get Complete ZIP Trend Analysis ➞ | |
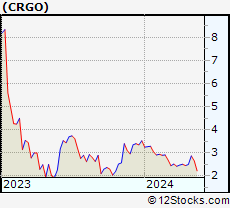 | CRGO Freightos Limited |
| Sector: Industrials | |
| SubSector: Integrated Freight & Logistics | |
| MarketCap: 149 Millions | |
| Recent Price: 2.63 Smart Investing & Trading Score: 67 | |
| Day Percent Change: -4.01% Day Change: -0.11 | |
| Week Change: 5.2% Year-to-date Change: -25.4% | |
| CRGO Links: Profile News Message Board | |
| Charts:- Daily , Weekly | |
| Add CRGO to Watchlist: View: Get Complete CRGO Trend Analysis ➞ | |
 | SST System1, Inc. |
| Sector: Industrials | |
| SubSector: Specialty Business Services | |
| MarketCap: 504 Millions | |
| Recent Price: 1.79 Smart Investing & Trading Score: 36 | |
| Day Percent Change: -4.79% Day Change: -0.09 | |
| Week Change: -10.95% Year-to-date Change: -25.7% | |
| SST Links: Profile News Message Board | |
| Charts:- Daily , Weekly | |
| Add SST to Watchlist: View: Get Complete SST Trend Analysis ➞ | |
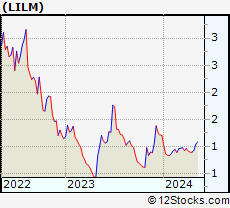 | LILM Lilium N.V. |
| Sector: Industrials | |
| SubSector: Aerospace & Defense | |
| MarketCap: 747 Millions | |
| Recent Price: 0.89 Smart Investing & Trading Score: 33 | |
| Day Percent Change: -2.85% Day Change: -0.03 | |
| Week Change: -0.01% Year-to-date Change: -26.1% | |
| LILM Links: Profile News Message Board | |
| Charts:- Daily , Weekly | |
| Add LILM to Watchlist: View: Get Complete LILM Trend Analysis ➞ | |
 | EAF GrafTech International Ltd. |
| Sector: Industrials | |
| SubSector: Diversified Machinery | |
| MarketCap: 2084.36 Millions | |
| Recent Price: 1.61 Smart Investing & Trading Score: 66 | |
| Day Percent Change: -2.42% Day Change: -0.04 | |
| Week Change: 6.62% Year-to-date Change: -26.5% | |
| EAF Links: Profile News Message Board | |
| Charts:- Daily , Weekly | |
| Add EAF to Watchlist: View: Get Complete EAF Trend Analysis ➞ | |
 | GMRE Global Medical REIT Inc. |
| Sector: Industrials | |
| SubSector: Conglomerates | |
| MarketCap: 529.748 Millions | |
| Recent Price: 8.09 Smart Investing & Trading Score: 28 | |
| Day Percent Change: -0.86% Day Change: -0.07 | |
| Week Change: -1.22% Year-to-date Change: -27.1% | |
| GMRE Links: Profile News Message Board | |
| Charts:- Daily , Weekly | |
| Add GMRE to Watchlist: View: Get Complete GMRE Trend Analysis ➞ | |
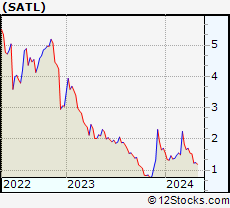 | SATL Satellogic Inc. |
| Sector: Industrials | |
| SubSector: Aerospace & Defense | |
| MarketCap: 170 Millions | |
| Recent Price: 1.22 Smart Investing & Trading Score: 35 | |
| Day Percent Change: -2.40% Day Change: -0.03 | |
| Week Change: -0.81% Year-to-date Change: -28.2% | |
| SATL Links: Profile News Message Board | |
| Charts:- Daily , Weekly | |
| Add SATL to Watchlist: View: Get Complete SATL Trend Analysis ➞ | |
 | PL Planet Labs PBC |
| Sector: Industrials | |
| SubSector: Aerospace & Defense | |
| MarketCap: 874 Millions | |
| Recent Price: 1.76 Smart Investing & Trading Score: 37 | |
| Day Percent Change: -1.40% Day Change: -0.02 | |
| Week Change: 0.57% Year-to-date Change: -29.0% | |
| PL Links: Profile News Message Board | |
| Charts:- Daily , Weekly | |
| Add PL to Watchlist: View: Get Complete PL Trend Analysis ➞ | |
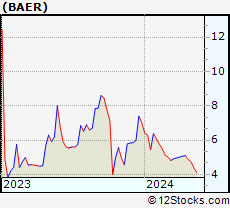 | BAER Bridger Aerospace Group Holdings, Inc. |
| Sector: Industrials | |
| SubSector: Security & Protection Services | |
| MarketCap: 239 Millions | |
| Recent Price: 4.86 Smart Investing & Trading Score: 35 | |
| Day Percent Change: -1.82% Day Change: -0.09 | |
| Week Change: -0.21% Year-to-date Change: -30.8% | |
| BAER Links: Profile News Message Board | |
| Charts:- Daily , Weekly | |
| Add BAER to Watchlist: View: Get Complete BAER Trend Analysis ➞ | |
 | EVEX Eve Holding, Inc. |
| Sector: Industrials | |
| SubSector: Aerospace & Defense | |
| MarketCap: 2830 Millions | |
| Recent Price: 5.01 Smart Investing & Trading Score: 37 | |
| Day Percent Change: 1.31% Day Change: 0.06 | |
| Week Change: -5.47% Year-to-date Change: -31.9% | |
| EVEX Links: Profile News Message Board | |
| Charts:- Daily , Weekly | |
| Add EVEX to Watchlist: View: Get Complete EVEX Trend Analysis ➞ | |
 | BLDP Ballard Power Systems Inc. |
| Sector: Industrials | |
| SubSector: Industrial Electrical Equipment | |
| MarketCap: 2124.79 Millions | |
| Recent Price: 2.47 Smart Investing & Trading Score: 10 | |
| Day Percent Change: -2.76% Day Change: -0.07 | |
| Week Change: -6.08% Year-to-date Change: -33.2% | |
| BLDP Links: Profile News Message Board | |
| Charts:- Daily , Weekly | |
| Add BLDP to Watchlist: View: Get Complete BLDP Trend Analysis ➞ | |
 | RKLB Rocket Lab USA, Inc. |
| Sector: Industrials | |
| SubSector: Aerospace & Defense | |
| MarketCap: 2820 Millions | |
| Recent Price: 3.65 Smart Investing & Trading Score: 20 | |
| Day Percent Change: 0.14% Day Change: 0.00 | |
| Week Change: 2.82% Year-to-date Change: -33.8% | |
| RKLB Links: Profile News Message Board | |
| Charts:- Daily , Weekly | |
| Add RKLB to Watchlist: View: Get Complete RKLB Trend Analysis ➞ | |
| For tabular summary view of above stock list: Summary View ➞ 0 - 25 , 25 - 50 , 50 - 75 , 75 - 100 , 100 - 125 , 125 - 150 , 150 - 175 , 175 - 200 , 200 - 225 , 225 - 250 , 250 - 275 , 275 - 300 | ||
| Click To Change The Sort Order: By Market Cap or Company Size Performance: Year-to-date, Week and Day | |
| Select Chart Type: | ||
|
Best Stocks Today 12Stocks.com |
© 2024 12Stocks.com Terms & Conditions Privacy Contact Us
All Information Provided Only For Education And Not To Be Used For Investing or Trading. See Terms & Conditions


One More Thing ... Get Best Stocks Delivered Daily!
Never Ever Miss A Move With Our Top Ten Stocks Lists
Find Best Stocks In Any Market - Bull or Bear Market
Take A Peek At Our Top Ten Stocks Lists: Daily, Weekly, Year-to-Date & Top Trends
Find Best Stocks In Any Market - Bull or Bear Market
Take A Peek At Our Top Ten Stocks Lists: Daily, Weekly, Year-to-Date & Top Trends
Industrial Stocks With Best Up Trends [0-bearish to 100-bullish]: Dover [100], Kanzhun [100], Northrop Grumman[100], Carpenter Technology[100], Crane Co[100], Mueller Industries[100], Carrier Global[95], TransDigm [95], Generac [93], HEICO [93], Ducommun [93]
Best Industrial Stocks Year-to-Date:
Intuitive Machines[123.46%], FTAI Infrastructure[90.49%], NuScale Power[82.64%], Caesarstone [67.65%], Powell Industries[65.51%], EMCOR [62.16%], IES [61.01%], Masonite [55.62%], ADS-TEC Energy[52.88%], Tutor Perini[52.64%], Comfort Systems[51.41%] Best Industrial Stocks This Week:
NuScale Power[21.44%], BiomX [16.55%], JELD-WEN Holding[14.65%], Joby Aviation[12.33%], Powell Industries[12.25%], ZIM Integrated[12%], Mueller Industries[11.73%], Crane Co[11.2%], FTAI Infrastructure[11.09%], IES [10.42%], Caesarstone [10.19%] Best Industrial Stocks Daily:
JELD-WEN Holding[11.54%], Brooge [9.13%], Shengfeng Development[7.69%], Carrier Global[7.19%], Meritage Homes[6.71%], Joby Aviation[6.14%], NuScale Power[6.13%], Darling Ingredients[4.94%], Dover [4.47%], EHang [4.12%], Kanzhun [3.29%]