
 Login Sign Up


| |||||
 |  | ||||

| 12Stocks.com Market Intelligence |
Best Industrial Stocks
| In a hurry? Industrial Stocks Lists: Performance Trends Table, Stock Charts
Sort Industrial stocks: Daily, Weekly, Year-to-Date, Market Cap & Trends. Filter Industrial stocks list by size:All Industrial Large Mid-Range Small |
| 12Stocks.com Industrial Stocks Performances & Trends Daily | |||||||||
|
|  The overall Smart Investing & Trading Score is 50 (0-bearish to 100-bullish) which puts Industrial sector in short term neutral trend. The Smart Investing & Trading Score from previous trading session is 40 and hence an improvement of trend.
| ||||||||
Here are the Smart Investing & Trading Scores of the most requested Industrial stocks at 12Stocks.com (click stock name for detailed review):
|


| 12Stocks.com: Investing in Industrial sector with Stocks | |
|
The following table helps investors and traders sort through current performance and trends (as measured by Smart Investing & Trading Score) of various
stocks in the Industrial sector. Quick View: Move mouse or cursor over stock symbol (ticker) to view short-term Technical chart and over stock name to view long term chart. Click on  to add stock symbol to your watchlist and to add stock symbol to your watchlist and  to view watchlist. Click on any ticker or stock name for detailed market intelligence report for that stock. to view watchlist. Click on any ticker or stock name for detailed market intelligence report for that stock. |
12Stocks.com Performance of Stocks in Industrial Sector
| Ticker | Stock Name | Watchlist | Category | Recent Price | Smart Investing & Trading Score | Change % | YTD Change% |
| ARCB | ArcBest Corp |   | Trucking | 73.23 | 40 | 2.61% | -19.96% |
| EXPO | Exponent | | Engineering & Construction | 69.67 | 10 | 0.29% | -20.16% |
| ACCO | Acco Brands | | Equipment & Supplies | 3.99 | 60 | -0.25% | -20.24% |
| TUSK | Mammoth Energy | | Conglomerates | 2.36 | 40 | -0.84% | -20.81% |
| ZIM | Zim Integrated | | Marine Shipping | 14.52 | 70 | -0.68% | -20.88% |
| HTLD | Heartland Express | | Trucking | 8.62 | 70 | 1.41% | -21.00% |
| PESI | Perma-Fix Environmental | | Waste Mgmt | 8.47 | 10 | -3.20% | -21.21% |
| LSTR | Landstar System | | Integrated Freight & Logistics | 131.21 | 50 | 1.68% | -21.64% |
| BXC | Bluelinx Hldgs | | Industrial Distribution | 78.19 | 30 | -0.52% | -21.70% |
| ACTG | Acacia Research | | Equipment & Supplies | 3.40 | 60 | 1.19% | -21.84% |
| GEO | Geo | | Security & Protection | 22.04 | 30 | 0.87% | -22.09% |
| JELD | JELD-WEN Holding | | Building Products & Equipment | 6.25 | 60 | -2.04% | -22.65% |
| MATX | Matson | | Marine Shipping | 105.43 | 60 | 0.30% | -22.79% |
| GBX | Greenbrier Cos | | Railroads | 46.27 | 40 | -0.52% | -22.91% |
| TNET | TriNet | | Staffing & Employment | 68.49 | 20 | -0.03% | -22.92% |
| ATKR | Atkore | | Electrical Equipment & Parts | 61.96 | 60 | 0.31% | -23.21% |
| MRTN | Marten Transport | | Trucking | 11.60 | 20 | -0.34% | -24.05% |
| ULCC | Frontier | | Airlines | 5.41 | 90 | 2.46% | -25.17% |
| SAIA | Saia | | Trucking | 328.60 | 100 | 2.85% | -26.21% |
| ENVX | Enovix | | Electrical Equipment & Parts | 8.90 | 40 | -2.63% | -26.51% |
| TFII | TFI | | Trucking | 95.54 | 80 | 0.98% | -26.69% |
| NNBR | NN | | Conglomerates | 2.31 | 30 | -1.70% | -26.90% |
| AAL | American Airlines | | Airlines | 12.41 | 30 | -0.96% | -27.00% |
| EVEX | Eve Holding | | Aerospace & Defense | 3.82 | 46 | -3.41% | -27.21% |
| HY | Hyster Yale | | Farm & Heavy Construction Machinery | 35.91 | 20 | -0.25% | -27.42% |
| For chart view version of above stock list: Chart View ➞ 0 - 25 , 25 - 50 , 50 - 75 , 75 - 100 , 100 - 125 , 125 - 150 , 150 - 175 , 175 - 200 , 200 - 225 , 225 - 250 , 250 - 275 , 275 - 300 , 300 - 325 , 325 - 350 , 350 - 375 , 375 - 400 , 400 - 425 , 425 - 450 , 450 - 475 , 475 - 500 , 500 - 525 | ||
 | Click To Change The Sort Order: By Market Cap or Company Size Performance: Year-to-date, Week and Day |  |
|
Get the most comprehensive stock market coverage daily at 12Stocks.com ➞ Best Stocks Today ➞ Best Stocks Weekly ➞ Best Stocks Year-to-Date ➞ Best Stocks Trends ➞  Best Stocks Today 12Stocks.com Best Nasdaq Stocks ➞ Best S&P 500 Stocks ➞ Best Tech Stocks ➞ Best Biotech Stocks ➞ |
| Detailed Overview of Industrial Stocks |
| Industrial Technical Overview, Leaders & Laggards, Top Industrial ETF Funds & Detailed Industrial Stocks List, Charts, Trends & More |
| Industrial Sector: Technical Analysis, Trends & YTD Performance | |
| Industrial sector is composed of stocks
from industrial machinery, aerospace, defense, farm/construction
and industrial services subsectors. Industrial sector, as represented by XLI, an exchange-traded fund [ETF] that holds basket of Industrial stocks (e.g, Caterpillar, Boeing) is up by 16.3439% and is currently outperforming the overall market by 3.0962% year-to-date. Below is a quick view of Technical charts and trends: |
|
 XLI Weekly Chart |
|
| Long Term Trend: Good | |
| Medium Term Trend: Not Good | |
 XLI Daily Chart |
|
| Short Term Trend: Deteriorating | |
| Overall Trend Score: 50 | |
| YTD Performance: 16.3439% | |
| **Trend Scores & Views Are Only For Educational Purposes And Not For Investing | |
| 12Stocks.com: Top Performing Industrial Sector Stocks | ||||||||||||||||||||||||||||||||||||||||||||||||
 The top performing Industrial sector stocks year to date are
Now, more recently, over last week, the top performing Industrial sector stocks on the move are


|
||||||||||||||||||||||||||||||||||||||||||||||||
| 12Stocks.com: Investing in Industrial Sector using Exchange Traded Funds | |
|
The following table shows list of key exchange traded funds (ETF) that
help investors track Industrial Index. For detailed view, check out our ETF Funds section of our website. Quick View: Move mouse or cursor over ETF symbol (ticker) to view short-term Technical chart and over ETF name to view long term chart. Click on ticker or stock name for detailed view. Click on to add stock symbol to your watchlist and to view watchlist. |
12Stocks.com List of ETFs that track Industrial Index
| Ticker | ETF Name | Watchlist | Recent Price | Smart Investing & Trading Score | Change % | Week % | Year-to-date % |
| CHII | China Industrials | | 9.80 | 20 | 0 | -0.0509944 | 0% |
| 12Stocks.com: Charts, Trends, Fundamental Data and Performances of Industrial Stocks | |
|
We now take in-depth look at all Industrial stocks including charts, multi-period performances and overall trends (as measured by Smart Investing & Trading Score). One can sort Industrial stocks (click link to choose) by Daily, Weekly and by Year-to-Date performances. Also, one can sort by size of the company or by market capitalization. |
| Select Your Default Chart Type: | |||||
| |||||
| Click on stock symbol or name for detailed view. Click on to add stock symbol to your watchlist and to view watchlist. Quick View: Move mouse or cursor over "Daily" to quickly view daily Technical stock chart and over "Weekly" to view weekly Technical stock chart. | |||||

 | ARCB ArcBest Corp |
| Sector: Industrials | |
| SubSector: Trucking | |
| MarketCap: 1720.42 Millions | |
| Recent Price: 73.23 Smart Investing & Trading Score: 40 | |
| Day Percent Change: 2.60614% Day Change: 1.26 | |
| Week Change: -2.80064% Year-to-date Change: -20.0% | |
| ARCB Links: Profile News Message Board | |
| Charts:- Daily , Weekly | |
| Add ARCB to Watchlist: View: Get Complete ARCB Trend Analysis ➞ | |
 | EXPO Exponent Inc |
| Sector: Industrials | |
| SubSector: Engineering & Construction | |
| MarketCap: 3606.79 Millions | |
| Recent Price: 69.67 Smart Investing & Trading Score: 10 | |
| Day Percent Change: 0.287894% Day Change: 0.45 | |
| Week Change: -1.87324% Year-to-date Change: -20.2% | |
| EXPO Links: Profile News Message Board | |
| Charts:- Daily , Weekly | |
| Add EXPO to Watchlist: View: Get Complete EXPO Trend Analysis ➞ | |
 | ACCO Acco Brands Corporation |
| Sector: Industrials | |
| SubSector: Business Equipment & Supplies | |
| MarketCap: 364.14 Millions | |
| Recent Price: 3.99 Smart Investing & Trading Score: 60 | |
| Day Percent Change: -0.25% Day Change: 0.04 | |
| Week Change: -1.23762% Year-to-date Change: -20.2% | |
| ACCO Links: Profile News Message Board | |
| Charts:- Daily , Weekly | |
| Add ACCO to Watchlist: View: Get Complete ACCO Trend Analysis ➞ | |
 | TUSK Mammoth Energy Services Inc |
| Sector: Industrials | |
| SubSector: Conglomerates | |
| MarketCap: 110.36 Millions | |
| Recent Price: 2.36 Smart Investing & Trading Score: 40 | |
| Day Percent Change: -0.840336% Day Change: 0 | |
| Week Change: 0.425532% Year-to-date Change: -20.8% | |
| TUSK Links: Profile News Message Board | |
| Charts:- Daily , Weekly | |
| Add TUSK to Watchlist: View: Get Complete TUSK Trend Analysis ➞ | |
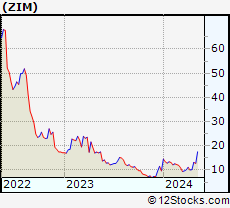 | ZIM Zim Integrated Shipping Services Ltd |
| Sector: Industrials | |
| SubSector: Marine Shipping | |
| MarketCap: 1624.97 Millions | |
| Recent Price: 14.52 Smart Investing & Trading Score: 70 | |
| Day Percent Change: -0.683995% Day Change: -0.63 | |
| Week Change: 8.52018% Year-to-date Change: -20.9% | |
| ZIM Links: Profile News Message Board | |
| Charts:- Daily , Weekly | |
| Add ZIM to Watchlist: View: Get Complete ZIM Trend Analysis ➞ | |
 | HTLD Heartland Express, Inc |
| Sector: Industrials | |
| SubSector: Trucking | |
| MarketCap: 666.48 Millions | |
| Recent Price: 8.62 Smart Investing & Trading Score: 70 | |
| Day Percent Change: 1.41176% Day Change: 0.1 | |
| Week Change: -0.115875% Year-to-date Change: -21.0% | |
| HTLD Links: Profile News Message Board | |
| Charts:- Daily , Weekly | |
| Add HTLD to Watchlist: View: Get Complete HTLD Trend Analysis ➞ | |
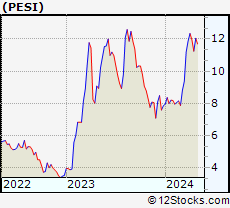 | PESI Perma-Fix Environmental Services, Inc |
| Sector: Industrials | |
| SubSector: Waste Management | |
| MarketCap: 222.57 Millions | |
| Recent Price: 8.47 Smart Investing & Trading Score: 10 | |
| Day Percent Change: -3.2% Day Change: 0.21 | |
| Week Change: -30.3454% Year-to-date Change: -21.2% | |
| PESI Links: Profile News Message Board | |
| Charts:- Daily , Weekly | |
| Add PESI to Watchlist: View: Get Complete PESI Trend Analysis ➞ | |
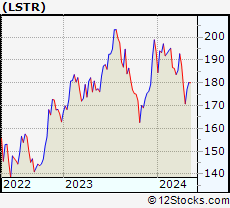 | LSTR Landstar System, Inc |
| Sector: Industrials | |
| SubSector: Integrated Freight & Logistics | |
| MarketCap: 4577.04 Millions | |
| Recent Price: 131.21 Smart Investing & Trading Score: 50 | |
| Day Percent Change: 1.68165% Day Change: 1.58 | |
| Week Change: -0.341789% Year-to-date Change: -21.6% | |
| LSTR Links: Profile News Message Board | |
| Charts:- Daily , Weekly | |
| Add LSTR to Watchlist: View: Get Complete LSTR Trend Analysis ➞ | |
 | BXC Bluelinx Hldgs Inc |
| Sector: Industrials | |
| SubSector: Industrial Distribution | |
| MarketCap: 680.01 Millions | |
| Recent Price: 78.19 Smart Investing & Trading Score: 30 | |
| Day Percent Change: -0.521628% Day Change: 0.92 | |
| Week Change: -8.69921% Year-to-date Change: -21.7% | |
| BXC Links: Profile News Message Board | |
| Charts:- Daily , Weekly | |
| Add BXC to Watchlist: View: Get Complete BXC Trend Analysis ➞ | |
 | ACTG Acacia Research Corp |
| Sector: Industrials | |
| SubSector: Business Equipment & Supplies | |
| MarketCap: 318.27 Millions | |
| Recent Price: 3.40 Smart Investing & Trading Score: 60 | |
| Day Percent Change: 1.19048% Day Change: 0.02 | |
| Week Change: 0.591716% Year-to-date Change: -21.8% | |
| ACTG Links: Profile News Message Board | |
| Charts:- Daily , Weekly | |
| Add ACTG to Watchlist: View: Get Complete ACTG Trend Analysis ➞ | |
 | GEO Geo Group, Inc |
| Sector: Industrials | |
| SubSector: Security & Protection Services | |
| MarketCap: 2919.86 Millions | |
| Recent Price: 22.04 Smart Investing & Trading Score: 30 | |
| Day Percent Change: 0.869565% Day Change: -0.7 | |
| Week Change: 6.47343% Year-to-date Change: -22.1% | |
| GEO Links: Profile News Message Board | |
| Charts:- Daily , Weekly | |
| Add GEO to Watchlist: View: Get Complete GEO Trend Analysis ➞ | |
 | JELD JELD-WEN Holding Inc |
| Sector: Industrials | |
| SubSector: Building Products & Equipment | |
| MarketCap: 577.33 Millions | |
| Recent Price: 6.25 Smart Investing & Trading Score: 60 | |
| Day Percent Change: -2.03762% Day Change: -0.05 | |
| Week Change: -3.54938% Year-to-date Change: -22.6% | |
| JELD Links: Profile News Message Board | |
| Charts:- Daily , Weekly | |
| Add JELD to Watchlist: View: Get Complete JELD Trend Analysis ➞ | |
 | MATX Matson Inc |
| Sector: Industrials | |
| SubSector: Marine Shipping | |
| MarketCap: 3355.65 Millions | |
| Recent Price: 105.43 Smart Investing & Trading Score: 60 | |
| Day Percent Change: 0.304443% Day Change: 1.26 | |
| Week Change: 0.735716% Year-to-date Change: -22.8% | |
| MATX Links: Profile News Message Board | |
| Charts:- Daily , Weekly | |
| Add MATX to Watchlist: View: Get Complete MATX Trend Analysis ➞ | |
 | GBX Greenbrier Cos., Inc |
| Sector: Industrials | |
| SubSector: Railroads | |
| MarketCap: 1456.47 Millions | |
| Recent Price: 46.27 Smart Investing & Trading Score: 40 | |
| Day Percent Change: -0.516018% Day Change: -0.52 | |
| Week Change: -0.408954% Year-to-date Change: -22.9% | |
| GBX Links: Profile News Message Board | |
| Charts:- Daily , Weekly | |
| Add GBX to Watchlist: View: Get Complete GBX Trend Analysis ➞ | |
 | TNET TriNet Group Inc |
| Sector: Industrials | |
| SubSector: Staffing & Employment Services | |
| MarketCap: 3433.37 Millions | |
| Recent Price: 68.49 Smart Investing & Trading Score: 20 | |
| Day Percent Change: -0.0291928% Day Change: -0.75 | |
| Week Change: -1.50992% Year-to-date Change: -22.9% | |
| TNET Links: Profile News Message Board | |
| Charts:- Daily , Weekly | |
| Add TNET to Watchlist: View: Get Complete TNET Trend Analysis ➞ | |
 | ATKR Atkore Inc |
| Sector: Industrials | |
| SubSector: Electrical Equipment & Parts | |
| MarketCap: 1994.78 Millions | |
| Recent Price: 61.96 Smart Investing & Trading Score: 60 | |
| Day Percent Change: 0.307593% Day Change: -0.14 | |
| Week Change: 5.87833% Year-to-date Change: -23.2% | |
| ATKR Links: Profile News Message Board | |
| Charts:- Daily , Weekly | |
| Add ATKR to Watchlist: View: Get Complete ATKR Trend Analysis ➞ | |
 | MRTN Marten Transport, Ltd |
| Sector: Industrials | |
| SubSector: Trucking | |
| MarketCap: 957.05 Millions | |
| Recent Price: 11.60 Smart Investing & Trading Score: 20 | |
| Day Percent Change: -0.343643% Day Change: -0.03 | |
| Week Change: 0% Year-to-date Change: -24.0% | |
| MRTN Links: Profile News Message Board | |
| Charts:- Daily , Weekly | |
| Add MRTN to Watchlist: View: Get Complete MRTN Trend Analysis ➞ | |
 | ULCC Frontier Group Holdings Inc |
| Sector: Industrials | |
| SubSector: Airlines | |
| MarketCap: 1181.85 Millions | |
| Recent Price: 5.41 Smart Investing & Trading Score: 90 | |
| Day Percent Change: 2.46212% Day Change: -0.11 | |
| Week Change: 0.557621% Year-to-date Change: -25.2% | |
| ULCC Links: Profile News Message Board | |
| Charts:- Daily , Weekly | |
| Add ULCC to Watchlist: View: Get Complete ULCC Trend Analysis ➞ | |
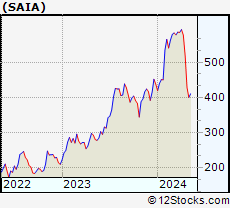 | SAIA Saia Inc |
| Sector: Industrials | |
| SubSector: Trucking | |
| MarketCap: 8341.08 Millions | |
| Recent Price: 328.60 Smart Investing & Trading Score: 100 | |
| Day Percent Change: 2.8482% Day Change: 7.89 | |
| Week Change: 5.30026% Year-to-date Change: -26.2% | |
| SAIA Links: Profile News Message Board | |
| Charts:- Daily , Weekly | |
| Add SAIA to Watchlist: View: Get Complete SAIA Trend Analysis ➞ | |
 | ENVX Enovix Corporation |
| Sector: Industrials | |
| SubSector: Electrical Equipment & Parts | |
| MarketCap: 1806.75 Millions | |
| Recent Price: 8.90 Smart Investing & Trading Score: 40 | |
| Day Percent Change: -2.62582% Day Change: 0.18 | |
| Week Change: -5.21832% Year-to-date Change: -26.5% | |
| ENVX Links: Profile News Message Board | |
| Charts:- Daily , Weekly | |
| Add ENVX to Watchlist: View: Get Complete ENVX Trend Analysis ➞ | |
 | TFII TFI International Inc |
| Sector: Industrials | |
| SubSector: Trucking | |
| MarketCap: 8008.11 Millions | |
| Recent Price: 95.54 Smart Investing & Trading Score: 80 | |
| Day Percent Change: 0.982983% Day Change: 0.79 | |
| Week Change: 0.399327% Year-to-date Change: -26.7% | |
| TFII Links: Profile News Message Board | |
| Charts:- Daily , Weekly | |
| Add TFII to Watchlist: View: Get Complete TFII Trend Analysis ➞ | |
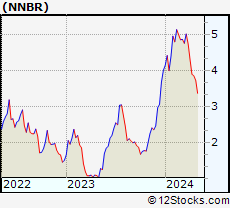 | NNBR NN Inc |
| Sector: Industrials | |
| SubSector: Conglomerates | |
| MarketCap: 125.24 Millions | |
| Recent Price: 2.31 Smart Investing & Trading Score: 30 | |
| Day Percent Change: -1.70213% Day Change: 0.04 | |
| Week Change: -7.96813% Year-to-date Change: -26.9% | |
| NNBR Links: Profile News Message Board | |
| Charts:- Daily , Weekly | |
| Add NNBR to Watchlist: View: Get Complete NNBR Trend Analysis ➞ | |
 | AAL American Airlines Group Inc |
| Sector: Industrials | |
| SubSector: Airlines | |
| MarketCap: 8630.56 Millions | |
| Recent Price: 12.41 Smart Investing & Trading Score: 30 | |
| Day Percent Change: -0.957702% Day Change: -0.12 | |
| Week Change: -4.16988% Year-to-date Change: -27.0% | |
| AAL Links: Profile News Message Board | |
| Charts:- Daily , Weekly | |
| Add AAL to Watchlist: View: Get Complete AAL Trend Analysis ➞ | |
 | EVEX Eve Holding Inc |
| Sector: Industrials | |
| SubSector: Aerospace & Defense | |
| MarketCap: 1179.46 Millions | |
| Recent Price: 3.82 Smart Investing & Trading Score: 46 | |
| Day Percent Change: -3.41% Day Change: -0.14 | |
| Week Change: -10.41% Year-to-date Change: -27.2% | |
| EVEX Links: Profile News Message Board | |
| Charts:- Daily , Weekly | |
| Add EVEX to Watchlist: View: Get Complete EVEX Trend Analysis ➞ | |
 | HY Hyster Yale Inc |
| Sector: Industrials | |
| SubSector: Farm & Heavy Construction Machinery | |
| MarketCap: 668.11 Millions | |
| Recent Price: 35.91 Smart Investing & Trading Score: 20 | |
| Day Percent Change: -0.25% Day Change: 0.3 | |
| Week Change: -4.36751% Year-to-date Change: -27.4% | |
| HY Links: Profile News Message Board | |
| Charts:- Daily , Weekly | |
| Add HY to Watchlist: View: Get Complete HY Trend Analysis ➞ | |
| For tabular summary view of above stock list: Summary View ➞ 0 - 25 , 25 - 50 , 50 - 75 , 75 - 100 , 100 - 125 , 125 - 150 , 150 - 175 , 175 - 200 , 200 - 225 , 225 - 250 , 250 - 275 , 275 - 300 , 300 - 325 , 325 - 350 , 350 - 375 , 375 - 400 , 400 - 425 , 425 - 450 , 450 - 475 , 475 - 500 , 500 - 525 | ||
| Click To Change The Sort Order: By Market Cap or Company Size Performance: Year-to-date, Week and Day | |
| Select Chart Type: | ||
|
Best Stocks Today 12Stocks.com |
© 2025 12Stocks.com Terms & Conditions Privacy Contact Us
All Information Provided Only For Education And Not To Be Used For Investing or Trading. See Terms & Conditions


One More Thing ... Get Best Stocks Delivered Daily!
Never Ever Miss A Move With Our Top Ten Stocks Lists
Find Best Stocks In Any Market - Bull or Bear Market
Take A Peek At Our Top Ten Stocks Lists: Daily, Weekly, Year-to-Date & Top Trends
Find Best Stocks In Any Market - Bull or Bear Market
Take A Peek At Our Top Ten Stocks Lists: Daily, Weekly, Year-to-Date & Top Trends
Industrial Stocks With Best Up Trends [0-bearish to 100-bullish]: Brooge [100], Bloom Energy[100], Babcock & Wilcox Enterprises[100], Kratos Defense[100], VSE Corp[100], Sturm Ruger[100], PICO [100], Saia [100], Mercury Systems[100], Herc [100], Quad/Graphics [100]
Best Industrial Stocks Year-to-Date:
Triumph [1324.01%], GrafTech [525.581%], Tecogen [486.452%], Power [236.709%], Bloom Energy[213.607%], Lightbridge Corp[197.255%], Kratos Defense[189.424%], ESGL [170.593%], Willdan [166.932%], Tutor Perini[164.404%], Astronics Corp[154.275%] Best Industrial Stocks This Week:
TRC [10149.1%], Advanced Emissions[3571.78%], L3 Technologies[1915.25%], Forterra [1845.47%], KLX [437.488%], Allegro Merger[402.182%], LMI Aerospace[291.621%], Chicago Bridge[205.472%], Covanta Holding[148.617%], MOOG [148.377%], Altra [103.372%] Best Industrial Stocks Daily:
Brooge [29.5547%], Tecogen [10.989%], Bloom Energy[9.35542%], B/E Aerospace[8.86381%], Cimpress [8.78625%], Babcock & Wilcox Enterprises[8.47458%], Kratos Defense[7.93045%], Plug Power[7.00637%], Orion [6.23342%], AeroVironment [5.90742%], William Lyon[4.78516%]