
 Login Sign Up


| |||||
 |  | ||||

| 12Stocks.com Market Intelligence |
Best Industrial Stocks
| In a hurry? Industrial Stocks Lists: Performance Trends Table, Stock Charts
Sort Industrial stocks: Daily, Weekly, Year-to-Date, Market Cap & Trends. Filter Industrial stocks list by size:All Industrial Large Mid-Range Small |
| 12Stocks.com Industrial Stocks Performances & Trends Daily | |||||||||
|
|  The overall Smart Investing & Trading Score is 50 (0-bearish to 100-bullish) which puts Industrial sector in short term neutral trend. The Smart Investing & Trading Score from previous trading session is 40 and hence an improvement of trend.
| ||||||||
Here are the Smart Investing & Trading Scores of the most requested Industrial stocks at 12Stocks.com (click stock name for detailed review):
|


| 12Stocks.com: Investing in Industrial sector with Stocks | |
|
The following table helps investors and traders sort through current performance and trends (as measured by Smart Investing & Trading Score) of various
stocks in the Industrial sector. Quick View: Move mouse or cursor over stock symbol (ticker) to view short-term Technical chart and over stock name to view long term chart. Click on  to add stock symbol to your watchlist and to add stock symbol to your watchlist and  to view watchlist. Click on any ticker or stock name for detailed market intelligence report for that stock. to view watchlist. Click on any ticker or stock name for detailed market intelligence report for that stock. |
12Stocks.com Performance of Stocks in Industrial Sector
| Ticker | Stock Name | Watchlist | Category | Recent Price | Smart Investing & Trading Score | Change % | YTD Change% |
| ICFI | ICF |   | Consulting | 100.58 | 90 | 0.88% | -14.42% |
| OFLX | Omega Flex | | Specialty Industrial Machinery | 34.34 | 40 | 0.09% | -14.50% |
| TREX | TREX Co | | Building Products & Equipment | 58.29 | 20 | -2.66% | -14.59% |
| CWST | Casella Waste | | Waste Mgmt | 88.80 | 0 | -1.62% | -14.78% |
| FA | First Advantage | | Specialty | 15.60 | 0 | -0.19% | -15.36% |
| AMBI | Ambipar Emergency | | Waste Mgmt | 4.50 | 0 | -2.17% | -15.89% |
| FDX | Fedex Corp | | Integrated Freight & Logistics | 227.70 | 40 | 0.89% | -15.99% |
| ODFL | Old Dominion | | Trucking | 147.02 | 40 | 1.22% | -16.06% |
| KBR | KBR | | Engineering & Construction | 48.22 | 30 | -1.15% | -16.16% |
| SNDR | Schneider National | | Trucking | 24.08 | 20 | 0.67% | -16.68% |
| HI | Hillenbrand | | Specialty Industrial Machinery | 24.74 | 40 | 0.04% | -17.09% |
| FLR | Fluor | | Engineering & Construction | 40.79 | 30 | -1.66% | -17.21% |
| CPRT | Copart | | Specialty | 46.57 | 10 | -2.16% | -17.31% |
| UHAL | U-Haul Holding | | Rental & Leasing | 56.70 | 0 | 0.66% | -17.84% |
| SERV | Serve Robotics | | Specialty Industrial Machinery | 12.11 | 100 | -0.82% | -17.95% |
| TRN | Trinity Industries | | Railroads | 27.85 | 30 | -1.73% | -18.13% |
| NL | NL Industries | | Security & Protection | 6.08 | 10 | -2.25% | -18.55% |
| KNX | Knight-Swift Transportation | | Trucking | 42.56 | 40 | 2.31% | -18.66% |
| SFL | SFL | | Marine Shipping | 7.96 | 10 | -0.62% | -18.72% |
| JBHT | J.B. Hunt | | Integrated Freight & Logistics | 137.80 | 20 | 1.06% | -18.79% |
| WERN | Werner Enterprises | | Trucking | 28.55 | 50 | 0.81% | -18.86% |
| TBI | TrueBlue | | Staffing & Employment | 6.33 | 80 | 2.59% | -19.26% |
| KEX | Kirby Corp | | Marine Shipping | 84.58 | 10 | 0.14% | -19.42% |
| IEX | Idex | | Specialty Industrial Machinery | 163.84 | 50 | 1.66% | -19.63% |
| BAH | Booz Allen | | Consulting | 101.83 | 20 | 0.21% | -19.71% |
| For chart view version of above stock list: Chart View ➞ 0 - 25 , 25 - 50 , 50 - 75 , 75 - 100 , 100 - 125 , 125 - 150 , 150 - 175 , 175 - 200 , 200 - 225 , 225 - 250 , 250 - 275 , 275 - 300 , 300 - 325 , 325 - 350 , 350 - 375 , 375 - 400 , 400 - 425 , 425 - 450 , 450 - 475 , 475 - 500 , 500 - 525 | ||
 | Click To Change The Sort Order: By Market Cap or Company Size Performance: Year-to-date, Week and Day |  |
|
Get the most comprehensive stock market coverage daily at 12Stocks.com ➞ Best Stocks Today ➞ Best Stocks Weekly ➞ Best Stocks Year-to-Date ➞ Best Stocks Trends ➞  Best Stocks Today 12Stocks.com Best Nasdaq Stocks ➞ Best S&P 500 Stocks ➞ Best Tech Stocks ➞ Best Biotech Stocks ➞ |
| Detailed Overview of Industrial Stocks |
| Industrial Technical Overview, Leaders & Laggards, Top Industrial ETF Funds & Detailed Industrial Stocks List, Charts, Trends & More |
| Industrial Sector: Technical Analysis, Trends & YTD Performance | |
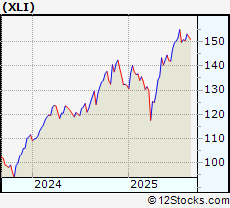
| Industrial sector is composed of stocks
from industrial machinery, aerospace, defense, farm/construction
and industrial services subsectors. Industrial sector, as represented by XLI, an exchange-traded fund [ETF] that holds basket of Industrial stocks (e.g, Caterpillar, Boeing) is up by 16.3439% and is currently outperforming the overall market by 3.0962% year-to-date. Below is a quick view of Technical charts and trends: |
|
 XLI Weekly Chart |
|
| Long Term Trend: Good | |
| Medium Term Trend: Not Good | |
 XLI Daily Chart |
|
| Short Term Trend: Deteriorating | |
| Overall Trend Score: 50 | |
| YTD Performance: 16.3439% | |
| **Trend Scores & Views Are Only For Educational Purposes And Not For Investing | |
| 12Stocks.com: Top Performing Industrial Sector Stocks | ||||||||||||||||||||||||||||||||||||||||||||||||
 The top performing Industrial sector stocks year to date are
Now, more recently, over last week, the top performing Industrial sector stocks on the move are


|
||||||||||||||||||||||||||||||||||||||||||||||||
| 12Stocks.com: Investing in Industrial Sector using Exchange Traded Funds | |
|
The following table shows list of key exchange traded funds (ETF) that
help investors track Industrial Index. For detailed view, check out our ETF Funds section of our website. Quick View: Move mouse or cursor over ETF symbol (ticker) to view short-term Technical chart and over ETF name to view long term chart. Click on ticker or stock name for detailed view. Click on to add stock symbol to your watchlist and to view watchlist. |
12Stocks.com List of ETFs that track Industrial Index
| Ticker | ETF Name | Watchlist | Recent Price | Smart Investing & Trading Score | Change % | Week % | Year-to-date % |
| CHII | China Industrials | | 9.80 | 20 | 0 | -0.0509944 | 0% |
| 12Stocks.com: Charts, Trends, Fundamental Data and Performances of Industrial Stocks | |
|
We now take in-depth look at all Industrial stocks including charts, multi-period performances and overall trends (as measured by Smart Investing & Trading Score). One can sort Industrial stocks (click link to choose) by Daily, Weekly and by Year-to-Date performances. Also, one can sort by size of the company or by market capitalization. |
| Select Your Default Chart Type: | |||||
| |||||
| Click on stock symbol or name for detailed view. Click on to add stock symbol to your watchlist and to view watchlist. Quick View: Move mouse or cursor over "Daily" to quickly view daily Technical stock chart and over "Weekly" to view weekly Technical stock chart. | |||||

 | ICFI ICF International, Inc |
| Sector: Industrials | |
| SubSector: Consulting Services | |
| MarketCap: 1754.58 Millions | |
| Recent Price: 100.58 Smart Investing & Trading Score: 90 | |
| Day Percent Change: 0.882648% Day Change: 0.33 | |
| Week Change: 5.31937% Year-to-date Change: -14.4% | |
| ICFI Links: Profile News Message Board | |
| Charts:- Daily , Weekly | |
| Add ICFI to Watchlist: View: Get Complete ICFI Trend Analysis ➞ | |
 | OFLX Omega Flex Inc |
| Sector: Industrials | |
| SubSector: Specialty Industrial Machinery | |
| MarketCap: 353.4 Millions | |
| Recent Price: 34.34 Smart Investing & Trading Score: 40 | |
| Day Percent Change: 0.0874381% Day Change: -0.16 | |
| Week Change: -1.20829% Year-to-date Change: -14.5% | |
| OFLX Links: Profile News Message Board | |
| Charts:- Daily , Weekly | |
| Add OFLX to Watchlist: View: Get Complete OFLX Trend Analysis ➞ | |
 | TREX TREX Co., Inc |
| Sector: Industrials | |
| SubSector: Building Products & Equipment | |
| MarketCap: 6927.34 Millions | |
| Recent Price: 58.29 Smart Investing & Trading Score: 20 | |
| Day Percent Change: -2.65531% Day Change: -1.74 | |
| Week Change: -7.68134% Year-to-date Change: -14.6% | |
| TREX Links: Profile News Message Board | |
| Charts:- Daily , Weekly | |
| Add TREX to Watchlist: View: Get Complete TREX Trend Analysis ➞ | |
 | CWST Casella Waste Systems, Inc |
| Sector: Industrials | |
| SubSector: Waste Management | |
| MarketCap: 6011.89 Millions | |
| Recent Price: 88.80 Smart Investing & Trading Score: 0 | |
| Day Percent Change: -1.61755% Day Change: 0.52 | |
| Week Change: -4.7619% Year-to-date Change: -14.8% | |
| CWST Links: Profile News Message Board | |
| Charts:- Daily , Weekly | |
| Add CWST to Watchlist: View: Get Complete CWST Trend Analysis ➞ | |
 | FA First Advantage Corp |
| Sector: Industrials | |
| SubSector: Specialty Business Services | |
| MarketCap: 2794.29 Millions | |
| Recent Price: 15.60 Smart Investing & Trading Score: 0 | |
| Day Percent Change: -0.191939% Day Change: -0.19 | |
| Week Change: -3.52505% Year-to-date Change: -15.4% | |
| FA Links: Profile News Message Board | |
| Charts:- Daily , Weekly | |
| Add FA to Watchlist: View: Get Complete FA Trend Analysis ➞ | |
 | AMBI Ambipar Emergency Response |
| Sector: Industrials | |
| SubSector: Waste Management | |
| MarketCap: 251.65 Millions | |
| Recent Price: 4.50 Smart Investing & Trading Score: 0 | |
| Day Percent Change: -2.17391% Day Change: -0.07 | |
| Week Change: 0% Year-to-date Change: -15.9% | |
| AMBI Links: Profile News Message Board | |
| Charts:- Daily , Weekly | |
| Add AMBI to Watchlist: View: Get Complete AMBI Trend Analysis ➞ | |
 | FDX Fedex Corp |
| Sector: Industrials | |
| SubSector: Integrated Freight & Logistics | |
| MarketCap: 53718.9 Millions | |
| Recent Price: 227.70 Smart Investing & Trading Score: 40 | |
| Day Percent Change: 0.890602% Day Change: 1.88 | |
| Week Change: 1.2% Year-to-date Change: -16.0% | |
| FDX Links: Profile News Message Board | |
| Charts:- Daily , Weekly | |
| Add FDX to Watchlist: View: Get Complete FDX Trend Analysis ➞ | |
 | ODFL Old Dominion Freight Line, Inc |
| Sector: Industrials | |
| SubSector: Trucking | |
| MarketCap: 31674.4 Millions | |
| Recent Price: 147.02 Smart Investing & Trading Score: 40 | |
| Day Percent Change: 1.21859% Day Change: 1.69 | |
| Week Change: -2.70664% Year-to-date Change: -16.1% | |
| ODFL Links: Profile News Message Board | |
| Charts:- Daily , Weekly | |
| Add ODFL to Watchlist: View: Get Complete ODFL Trend Analysis ➞ | |
 | KBR KBR Inc |
| Sector: Industrials | |
| SubSector: Engineering & Construction | |
| MarketCap: 6398.28 Millions | |
| Recent Price: 48.22 Smart Investing & Trading Score: 30 | |
| Day Percent Change: -1.14801% Day Change: -0.43 | |
| Week Change: -2.13111% Year-to-date Change: -16.2% | |
| KBR Links: Profile News Message Board | |
| Charts:- Daily , Weekly | |
| Add KBR to Watchlist: View: Get Complete KBR Trend Analysis ➞ | |
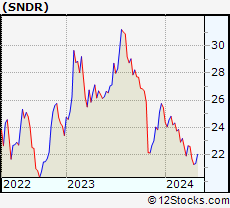 | SNDR Schneider National Inc |
| Sector: Industrials | |
| SubSector: Trucking | |
| MarketCap: 4302.71 Millions | |
| Recent Price: 24.08 Smart Investing & Trading Score: 20 | |
| Day Percent Change: 0.668896% Day Change: 0.16 | |
| Week Change: -1.51329% Year-to-date Change: -16.7% | |
| SNDR Links: Profile News Message Board | |
| Charts:- Daily , Weekly | |
| Add SNDR to Watchlist: View: Get Complete SNDR Trend Analysis ➞ | |
 | HI Hillenbrand Inc |
| Sector: Industrials | |
| SubSector: Specialty Industrial Machinery | |
| MarketCap: 1848.74 Millions | |
| Recent Price: 24.74 Smart Investing & Trading Score: 40 | |
| Day Percent Change: 0.0404367% Day Change: -0.01 | |
| Week Change: -3.47249% Year-to-date Change: -17.1% | |
| HI Links: Profile News Message Board | |
| Charts:- Daily , Weekly | |
| Add HI to Watchlist: View: Get Complete HI Trend Analysis ➞ | |
 | FLR Fluor Corporation |
| Sector: Industrials | |
| SubSector: Engineering & Construction | |
| MarketCap: 6720.39 Millions | |
| Recent Price: 40.79 Smart Investing & Trading Score: 30 | |
| Day Percent Change: -1.66345% Day Change: 0.16 | |
| Week Change: -0.0490076% Year-to-date Change: -17.2% | |
| FLR Links: Profile News Message Board | |
| Charts:- Daily , Weekly | |
| Add FLR to Watchlist: View: Get Complete FLR Trend Analysis ➞ | |
 | CPRT Copart, Inc |
| Sector: Industrials | |
| SubSector: Specialty Business Services | |
| MarketCap: 46964.1 Millions | |
| Recent Price: 46.57 Smart Investing & Trading Score: 10 | |
| Day Percent Change: -2.16387% Day Change: -1.2 | |
| Week Change: -4.4718% Year-to-date Change: -17.3% | |
| CPRT Links: Profile News Message Board | |
| Charts:- Daily , Weekly | |
| Add CPRT to Watchlist: View: Get Complete CPRT Trend Analysis ➞ | |
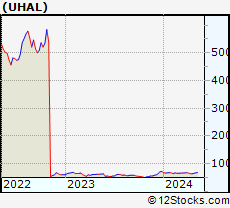 | UHAL U-Haul Holding Company |
| Sector: Industrials | |
| SubSector: Rental & Leasing Services | |
| MarketCap: 10620.6 Millions | |
| Recent Price: 56.70 Smart Investing & Trading Score: 0 | |
| Day Percent Change: 0.656844% Day Change: 0.48 | |
| Week Change: -2.0387% Year-to-date Change: -17.8% | |
| UHAL Links: Profile News Message Board | |
| Charts:- Daily , Weekly | |
| Add UHAL to Watchlist: View: Get Complete UHAL Trend Analysis ➞ | |
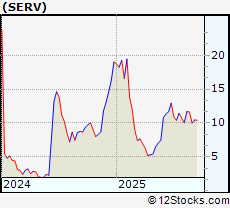 | SERV Serve Robotics Inc |
| Sector: Industrials | |
| SubSector: Specialty Industrial Machinery | |
| MarketCap: 598.82 Millions | |
| Recent Price: 12.11 Smart Investing & Trading Score: 100 | |
| Day Percent Change: -0.819001% Day Change: -0.01 | |
| Week Change: 15.3333% Year-to-date Change: -18.0% | |
| SERV Links: Profile News Message Board | |
| Charts:- Daily , Weekly | |
| Add SERV to Watchlist: View: Get Complete SERV Trend Analysis ➞ | |
 | TRN Trinity Industries, Inc |
| Sector: Industrials | |
| SubSector: Railroads | |
| MarketCap: 2309.52 Millions | |
| Recent Price: 27.85 Smart Investing & Trading Score: 30 | |
| Day Percent Change: -1.729% Day Change: -0.01 | |
| Week Change: -1.69432% Year-to-date Change: -18.1% | |
| TRN Links: Profile News Message Board | |
| Charts:- Daily , Weekly | |
| Add TRN to Watchlist: View: Get Complete TRN Trend Analysis ➞ | |
 | NL NL Industries, Inc |
| Sector: Industrials | |
| SubSector: Security & Protection Services | |
| MarketCap: 311.26 Millions | |
| Recent Price: 6.08 Smart Investing & Trading Score: 10 | |
| Day Percent Change: -2.2508% Day Change: 0.09 | |
| Week Change: -0.653595% Year-to-date Change: -18.5% | |
| NL Links: Profile News Message Board | |
| Charts:- Daily , Weekly | |
| Add NL to Watchlist: View: Get Complete NL Trend Analysis ➞ | |
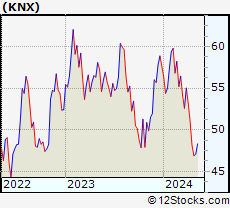 | KNX Knight-Swift Transportation Holdings Inc |
| Sector: Industrials | |
| SubSector: Trucking | |
| MarketCap: 6996.84 Millions | |
| Recent Price: 42.56 Smart Investing & Trading Score: 40 | |
| Day Percent Change: 2.30769% Day Change: 0.81 | |
| Week Change: -0.467727% Year-to-date Change: -18.7% | |
| KNX Links: Profile News Message Board | |
| Charts:- Daily , Weekly | |
| Add KNX to Watchlist: View: Get Complete KNX Trend Analysis ➞ | |
 | SFL SFL Corporation Ltd |
| Sector: Industrials | |
| SubSector: Marine Shipping | |
| MarketCap: 1092.43 Millions | |
| Recent Price: 7.96 Smart Investing & Trading Score: 10 | |
| Day Percent Change: -0.62422% Day Change: 0.15 | |
| Week Change: -3.63196% Year-to-date Change: -18.7% | |
| SFL Links: Profile News Message Board | |
| Charts:- Daily , Weekly | |
| Add SFL to Watchlist: View: Get Complete SFL Trend Analysis ➞ | |
 | JBHT J.B. Hunt Transport Services, Inc |
| Sector: Industrials | |
| SubSector: Integrated Freight & Logistics | |
| MarketCap: 13913 Millions | |
| Recent Price: 137.80 Smart Investing & Trading Score: 20 | |
| Day Percent Change: 1.06344% Day Change: 1 | |
| Week Change: -3.62962% Year-to-date Change: -18.8% | |
| JBHT Links: Profile News Message Board | |
| Charts:- Daily , Weekly | |
| Add JBHT to Watchlist: View: Get Complete JBHT Trend Analysis ➞ | |
 | WERN Werner Enterprises, Inc |
| Sector: Industrials | |
| SubSector: Trucking | |
| MarketCap: 1711.75 Millions | |
| Recent Price: 28.55 Smart Investing & Trading Score: 50 | |
| Day Percent Change: 0.812147% Day Change: 0.45 | |
| Week Change: -0.209717% Year-to-date Change: -18.9% | |
| WERN Links: Profile News Message Board | |
| Charts:- Daily , Weekly | |
| Add WERN to Watchlist: View: Get Complete WERN Trend Analysis ➞ | |
 | TBI TrueBlue Inc |
| Sector: Industrials | |
| SubSector: Staffing & Employment Services | |
| MarketCap: 175.22 Millions | |
| Recent Price: 6.33 Smart Investing & Trading Score: 80 | |
| Day Percent Change: 2.59319% Day Change: -0.12 | |
| Week Change: 8.76289% Year-to-date Change: -19.3% | |
| TBI Links: Profile News Message Board | |
| Charts:- Daily , Weekly | |
| Add TBI to Watchlist: View: Get Complete TBI Trend Analysis ➞ | |
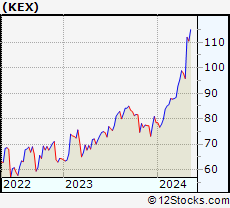 | KEX Kirby Corp |
| Sector: Industrials | |
| SubSector: Marine Shipping | |
| MarketCap: 4970.66 Millions | |
| Recent Price: 84.58 Smart Investing & Trading Score: 10 | |
| Day Percent Change: 0.142079% Day Change: 0.37 | |
| Week Change: -5.28555% Year-to-date Change: -19.4% | |
| KEX Links: Profile News Message Board | |
| Charts:- Daily , Weekly | |
| Add KEX to Watchlist: View: Get Complete KEX Trend Analysis ➞ | |
 | IEX Idex Corporation |
| Sector: Industrials | |
| SubSector: Specialty Industrial Machinery | |
| MarketCap: 12417.1 Millions | |
| Recent Price: 163.84 Smart Investing & Trading Score: 50 | |
| Day Percent Change: 1.66294% Day Change: 1.85 | |
| Week Change: -0.182771% Year-to-date Change: -19.6% | |
| IEX Links: Profile News Message Board | |
| Charts:- Daily , Weekly | |
| Add IEX to Watchlist: View: Get Complete IEX Trend Analysis ➞ | |
 | BAH Booz Allen Hamilton Holding Corp |
| Sector: Industrials | |
| SubSector: Consulting Services | |
| MarketCap: 12626.8 Millions | |
| Recent Price: 101.83 Smart Investing & Trading Score: 20 | |
| Day Percent Change: 0.206652% Day Change: 0.28 | |
| Week Change: 0.137673% Year-to-date Change: -19.7% | |
| BAH Links: Profile News Message Board | |
| Charts:- Daily , Weekly | |
| Add BAH to Watchlist: View: Get Complete BAH Trend Analysis ➞ | |
| For tabular summary view of above stock list: Summary View ➞ 0 - 25 , 25 - 50 , 50 - 75 , 75 - 100 , 100 - 125 , 125 - 150 , 150 - 175 , 175 - 200 , 200 - 225 , 225 - 250 , 250 - 275 , 275 - 300 , 300 - 325 , 325 - 350 , 350 - 375 , 375 - 400 , 400 - 425 , 425 - 450 , 450 - 475 , 475 - 500 , 500 - 525 | ||
| Click To Change The Sort Order: By Market Cap or Company Size Performance: Year-to-date, Week and Day | |
| Select Chart Type: | ||
|
Best Stocks Today 12Stocks.com |
© 2025 12Stocks.com Terms & Conditions Privacy Contact Us
All Information Provided Only For Education And Not To Be Used For Investing or Trading. See Terms & Conditions


One More Thing ... Get Best Stocks Delivered Daily!
Never Ever Miss A Move With Our Top Ten Stocks Lists
Find Best Stocks In Any Market - Bull or Bear Market
Take A Peek At Our Top Ten Stocks Lists: Daily, Weekly, Year-to-Date & Top Trends
Find Best Stocks In Any Market - Bull or Bear Market
Take A Peek At Our Top Ten Stocks Lists: Daily, Weekly, Year-to-Date & Top Trends
Industrial Stocks With Best Up Trends [0-bearish to 100-bullish]: Brooge [100], Bloom Energy[100], Babcock & Wilcox Enterprises[100], Kratos Defense[100], VSE Corp[100], Sturm Ruger[100], PICO [100], Saia [100], Mercury Systems[100], Herc [100], Quad/Graphics [100]
Best Industrial Stocks Year-to-Date:
Triumph [1324.01%], GrafTech [525.581%], Tecogen [486.452%], Power [236.709%], Bloom Energy[213.607%], Lightbridge Corp[197.255%], Kratos Defense[189.424%], ESGL [170.593%], Willdan [166.932%], Tutor Perini[164.404%], Astronics Corp[154.275%] Best Industrial Stocks This Week:
TRC [10149.1%], Advanced Emissions[3571.78%], L3 Technologies[1915.25%], Forterra [1845.47%], KLX [437.488%], Allegro Merger[402.182%], LMI Aerospace[291.621%], Chicago Bridge[205.472%], Covanta Holding[148.617%], MOOG [148.377%], Altra [103.372%] Best Industrial Stocks Daily:
Brooge [29.5547%], Tecogen [10.989%], Bloom Energy[9.35542%], B/E Aerospace[8.86381%], Cimpress [8.78625%], Babcock & Wilcox Enterprises[8.47458%], Kratos Defense[7.93045%], Plug Power[7.00637%], Orion [6.23342%], AeroVironment [5.90742%], William Lyon[4.78516%]