
 Login Sign Up


| |||||
 |  | ||||

| 12Stocks.com Market Intelligence |
Best Industrial Stocks
| In a hurry? Industrial Stocks Lists: Performance Trends Table, Stock Charts
Sort Industrial stocks: Daily, Weekly, Year-to-Date, Market Cap & Trends. Filter Industrial stocks list by size:All Industrial Large Mid-Range Small |
| 12Stocks.com Industrial Stocks Performances & Trends Daily | |||||||||
|
|  The overall Smart Investing & Trading Score is 50 (0-bearish to 100-bullish) which puts Industrial sector in short term neutral trend. The Smart Investing & Trading Score from previous trading session is 50 and an improvement of trend continues.
| ||||||||
Here are the Smart Investing & Trading Scores of the most requested Industrial stocks at 12Stocks.com (click stock name for detailed review):
|

| 12Stocks.com: Investing in Industrial sector with Stocks | |
|
The following table helps investors and traders sort through current performance and trends (as measured by Smart Investing & Trading Score) of various
stocks in the Industrial sector. Quick View: Move mouse or cursor over stock symbol (ticker) to view short-term Technical chart and over stock name to view long term chart. Click on  to add stock symbol to your watchlist and to add stock symbol to your watchlist and  to view watchlist. Click on any ticker or stock name for detailed market intelligence report for that stock. to view watchlist. Click on any ticker or stock name for detailed market intelligence report for that stock. |
12Stocks.com Performance of Stocks in Industrial Sector
| Ticker | Stock Name | Watchlist | Category | Recent Price | Smart Investing & Trading Score | Change % | YTD Change% |
| LTBR | Lightbridge Corp |   | Electrical Equipment & Parts | 14.23 | 20 | 0.78% | 179.02% |
| LXFR | Luxfer | | Specialty Industrial Machinery | 13.70 | 100 | 1.48% | 8.55% |
| ACCO | Acco Brands | | Equipment & Supplies | 4.04 | 90 | 0.25% | -19.24% |
| EVI | EVI Industries | | Industrial Distribution | 28.40 | 90 | 1.68% | 67.75% |
| HOVNP | Hovnanian Enterprises | | Residential | 19.89 | 40 | -0.03% | 20.48% |
| MTW | Manitowoc Co | | Farm & Heavy Construction Machinery | 10.13 | 50 | 0.70% | 13.82% |
| TGI | Triumph | | Aerospace/Defense | 283.30 | 50 | 0.57% | NA |
| OFLX | Omega Flex | | Specialty Industrial Machinery | 35.01 | 50 | -0.79% | -12.83% |
| PANL | Pangaea Logistics | | Marine Shipping | 5.35 | 90 | 1.90% | -2.19% |
| TRR | TRC | | Waste Mgmt | 58.42 | 70 | 0.22% | 0.00% |
| QUAD | Quad/Graphics | | Specialty | 6.61 | 90 | -0.60% | 2.03% |
| FRTA | Forterra | | Building Materials | 448.82 | 60 | 1.20% | 0.00% |
| CTT | CatchMark Timber | | Lumber, Wood | 9.95 | 30 | 1.84% | 0.00% |
| HNH | Handy & Harman | | Equipment | 51.37 | 10 | 0.16% | 0.00% |
| ACTG | Acacia Research | | Equipment & Supplies | 3.30 | 20 | -1.20% | -24.14% |
| VTIQ | VectoIQ Acquisition | | Conglomerates | 10.06 | 30 | 0.00% | 0.00% |
| NL | NL Industries | | Security & Protection | 6.37 | 10 | -4.07% | -14.66% |
| MG | Mistras | | Security & Protection | 9.73 | 90 | -0.61% | 9.57% |
| GFA | Gafisa S.A | | Residential | 11.29 | 10 | 2.26% | 0.00% |
| RLGT | Radiant Logistics | | Integrated Freight & Logistics | 6.46 | 80 | -0.15% | -2.12% |
| PKOH | Park-Ohio | | Specialty Industrial Machinery | 21.05 | 100 | 2.98% | -14.78% |
| MEC | Mayville Engineering | | Fabrication | 14.87 | 70 | 4.06% | -4.31% |
| ORN | Orion | | Engineering & Construction | 7.58 | 60 | -0.79% | 2.29% |
| LCA | Landcadia | | Conglomerates | 10.54 | 20 | 0.00% | 0.00% |
| INS | Intelligent Systems | | Machinery | 1.51 | 20 | 0.67% | 0.00% |
| For chart view version of above stock list: Chart View ➞ 0 - 25 , 25 - 50 , 50 - 75 , 75 - 100 , 100 - 125 , 125 - 150 , 150 - 175 , 175 - 200 , 200 - 225 , 225 - 250 , 250 - 275 , 275 - 300 , 300 - 325 , 325 - 350 , 350 - 375 , 375 - 400 , 400 - 425 , 425 - 450 , 450 - 475 , 475 - 500 , 500 - 525 | ||
 | Click To Change The Sort Order: By Market Cap or Company Size Performance: Year-to-date, Week and Day |  |
|
Get the most comprehensive stock market coverage daily at 12Stocks.com ➞ Best Stocks Today ➞ Best Stocks Weekly ➞ Best Stocks Year-to-Date ➞ Best Stocks Trends ➞  Best Stocks Today 12Stocks.com Best Nasdaq Stocks ➞ Best S&P 500 Stocks ➞ Best Tech Stocks ➞ Best Biotech Stocks ➞ |
| Detailed Overview of Industrial Stocks |
| Industrial Technical Overview, Leaders & Laggards, Top Industrial ETF Funds & Detailed Industrial Stocks List, Charts, Trends & More |
| Industrial Sector: Technical Analysis, Trends & YTD Performance | |
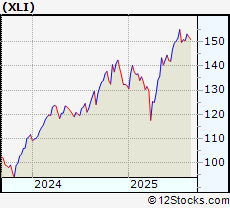
| Industrial sector is composed of stocks
from industrial machinery, aerospace, defense, farm/construction
and industrial services subsectors. Industrial sector, as represented by XLI, an exchange-traded fund [ETF] that holds basket of Industrial stocks (e.g, Caterpillar, Boeing) is up by 15.6543% and is currently outperforming the overall market by 4.4597% year-to-date. Below is a quick view of Technical charts and trends: |
|
 XLI Weekly Chart |
|
| Long Term Trend: Good | |
| Medium Term Trend: Good | |
 XLI Daily Chart |
|
| Short Term Trend: Good | |
| Overall Trend Score: 50 | |
| YTD Performance: 15.6543% | |
| **Trend Scores & Views Are Only For Educational Purposes And Not For Investing | |
| 12Stocks.com: Top Performing Industrial Sector Stocks | ||||||||||||||||||||||||||||||||||||||||||||||||
 The top performing Industrial sector stocks year to date are
Now, more recently, over last week, the top performing Industrial sector stocks on the move are


|
||||||||||||||||||||||||||||||||||||||||||||||||
| 12Stocks.com: Investing in Industrial Sector using Exchange Traded Funds | |
|
The following table shows list of key exchange traded funds (ETF) that
help investors track Industrial Index. For detailed view, check out our ETF Funds section of our website. Quick View: Move mouse or cursor over ETF symbol (ticker) to view short-term Technical chart and over ETF name to view long term chart. Click on ticker or stock name for detailed view. Click on to add stock symbol to your watchlist and to view watchlist. |
12Stocks.com List of ETFs that track Industrial Index
| Ticker | ETF Name | Watchlist | Recent Price | Smart Investing & Trading Score | Change % | Week % | Year-to-date % |
| CHII | China Industrials | | 9.80 | 20 | 0 | -0.0509944 | 0% |
| 12Stocks.com: Charts, Trends, Fundamental Data and Performances of Industrial Stocks | |
|
We now take in-depth look at all Industrial stocks including charts, multi-period performances and overall trends (as measured by Smart Investing & Trading Score). One can sort Industrial stocks (click link to choose) by Daily, Weekly and by Year-to-Date performances. Also, one can sort by size of the company or by market capitalization. |
| Select Your Default Chart Type: | |||||
| |||||
| Click on stock symbol or name for detailed view. Click on to add stock symbol to your watchlist and to view watchlist. Quick View: Move mouse or cursor over "Daily" to quickly view daily Technical stock chart and over "Weekly" to view weekly Technical stock chart. | |||||

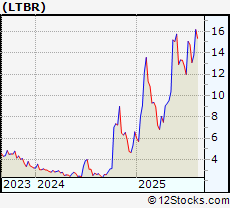 | LTBR Lightbridge Corp |
| Sector: Industrials | |
| SubSector: Electrical Equipment & Parts | |
| MarketCap: 368.76 Millions | |
| Recent Price: 14.23 Smart Investing & Trading Score: 20 | |
| Day Percent Change: 0.779037% Day Change: 0.54 | |
| Week Change: -8.54756% Year-to-date Change: 179.0% | |
| LTBR Links: Profile News Message Board | |
| Charts:- Daily , Weekly | |
| Add LTBR to Watchlist: View: Get Complete LTBR Trend Analysis ➞ | |
 | LXFR Luxfer Holdings PLC |
| Sector: Industrials | |
| SubSector: Specialty Industrial Machinery | |
| MarketCap: 366.61 Millions | |
| Recent Price: 13.70 Smart Investing & Trading Score: 100 | |
| Day Percent Change: 1.48148% Day Change: 0.07 | |
| Week Change: 1.40637% Year-to-date Change: 8.5% | |
| LXFR Links: Profile News Message Board | |
| Charts:- Daily , Weekly | |
| Add LXFR to Watchlist: View: Get Complete LXFR Trend Analysis ➞ | |
 | ACCO Acco Brands Corporation |
| Sector: Industrials | |
| SubSector: Business Equipment & Supplies | |
| MarketCap: 364.14 Millions | |
| Recent Price: 4.04 Smart Investing & Trading Score: 90 | |
| Day Percent Change: 0.248139% Day Change: 0.04 | |
| Week Change: 1.76322% Year-to-date Change: -19.2% | |
| ACCO Links: Profile News Message Board | |
| Charts:- Daily , Weekly | |
| Add ACCO to Watchlist: View: Get Complete ACCO Trend Analysis ➞ | |
 | EVI EVI Industries Inc |
| Sector: Industrials | |
| SubSector: Industrial Distribution | |
| MarketCap: 362.35 Millions | |
| Recent Price: 28.40 Smart Investing & Trading Score: 90 | |
| Day Percent Change: 1.68278% Day Change: -1.1 | |
| Week Change: 3.23519% Year-to-date Change: 67.7% | |
| EVI Links: Profile News Message Board | |
| Charts:- Daily , Weekly | |
| Add EVI to Watchlist: View: Get Complete EVI Trend Analysis ➞ | |
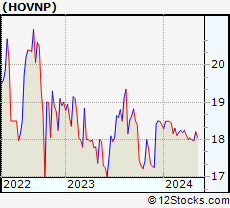 | HOVNP Hovnanian Enterprises, Inc. PFD DEP1/1000A |
| Sector: Industrials | |
| SubSector: Residential Construction | |
| MarketCap: 361.006 Millions | |
| Recent Price: 19.89 Smart Investing & Trading Score: 40 | |
| Day Percent Change: -0.0346734% Day Change: 0.01 | |
| Week Change: 0.470202% Year-to-date Change: 20.5% | |
| HOVNP Links: Profile News Message Board | |
| Charts:- Daily , Weekly | |
| Add HOVNP to Watchlist: View: Get Complete HOVNP Trend Analysis ➞ | |
 | MTW Manitowoc Co., Inc |
| Sector: Industrials | |
| SubSector: Farm & Heavy Construction Machinery | |
| MarketCap: 359.2 Millions | |
| Recent Price: 10.13 Smart Investing & Trading Score: 50 | |
| Day Percent Change: 0.695825% Day Change: 0 | |
| Week Change: 0.197824% Year-to-date Change: 13.8% | |
| MTW Links: Profile News Message Board | |
| Charts:- Daily , Weekly | |
| Add MTW to Watchlist: View: Get Complete MTW Trend Analysis ➞ | |
 | TGI Triumph Group, Inc. |
| Sector: Industrials | |
| SubSector: Aerospace/Defense Products & Services | |
| MarketCap: 358.901 Millions | |
| Recent Price: 283.30 Smart Investing & Trading Score: 50 | |
| Day Percent Change: 0.56798% Day Change: -294.7 | |
| Week Change: -3.86834% Year-to-date Change: 1,432.2% | |
| TGI Links: Profile News Message Board | |
| Charts:- Daily , Weekly | |
| Add TGI to Watchlist: View: Get Complete TGI Trend Analysis ➞ | |
 | OFLX Omega Flex Inc |
| Sector: Industrials | |
| SubSector: Specialty Industrial Machinery | |
| MarketCap: 353.4 Millions | |
| Recent Price: 35.01 Smart Investing & Trading Score: 50 | |
| Day Percent Change: -0.793426% Day Change: -0.16 | |
| Week Change: -0.596252% Year-to-date Change: -12.8% | |
| OFLX Links: Profile News Message Board | |
| Charts:- Daily , Weekly | |
| Add OFLX to Watchlist: View: Get Complete OFLX Trend Analysis ➞ | |
 | PANL Pangaea Logistics Solutions Ltd |
| Sector: Industrials | |
| SubSector: Marine Shipping | |
| MarketCap: 349.04 Millions | |
| Recent Price: 5.35 Smart Investing & Trading Score: 90 | |
| Day Percent Change: 1.90476% Day Change: 0.03 | |
| Week Change: -1.4733% Year-to-date Change: -2.2% | |
| PANL Links: Profile News Message Board | |
| Charts:- Daily , Weekly | |
| Add PANL to Watchlist: View: Get Complete PANL Trend Analysis ➞ | |
 | TRR TRC Companies, Inc. |
| Sector: Industrials | |
| SubSector: Waste Management | |
| MarketCap: 345.91 Millions | |
| Recent Price: 58.42 Smart Investing & Trading Score: 70 | |
| Day Percent Change: 0.223023% Day Change: -9999 | |
| Week Change: 10149.1% Year-to-date Change: 0.0% | |
| TRR Links: Profile News Message Board | |
| Charts:- Daily , Weekly | |
| Add TRR to Watchlist: View: Get Complete TRR Trend Analysis ➞ | |
 | QUAD Quad/Graphics Inc |
| Sector: Industrials | |
| SubSector: Specialty Business Services | |
| MarketCap: 333.63 Millions | |
| Recent Price: 6.61 Smart Investing & Trading Score: 90 | |
| Day Percent Change: -0.601504% Day Change: 0.12 | |
| Week Change: 3.12012% Year-to-date Change: 2.0% | |
| QUAD Links: Profile News Message Board | |
| Charts:- Daily , Weekly | |
| Add QUAD to Watchlist: View: Get Complete QUAD Trend Analysis ➞ | |
 | FRTA Forterra, Inc. |
| Sector: Industrials | |
| SubSector: General Building Materials | |
| MarketCap: 327.553 Millions | |
| Recent Price: 448.82 Smart Investing & Trading Score: 60 | |
| Day Percent Change: 1.20183% Day Change: -9999 | |
| Week Change: 1845.47% Year-to-date Change: 0.0% | |
| FRTA Links: Profile News Message Board | |
| Charts:- Daily , Weekly | |
| Add FRTA to Watchlist: View: Get Complete FRTA Trend Analysis ➞ | |
 | CTT CatchMark Timber Trust, Inc. |
| Sector: Industrials | |
| SubSector: Lumber, Wood Production | |
| MarketCap: 325.638 Millions | |
| Recent Price: 9.95 Smart Investing & Trading Score: 30 | |
| Day Percent Change: 1.84237% Day Change: -9999 | |
| Week Change: -4.05014% Year-to-date Change: 0.0% | |
| CTT Links: Profile News Message Board | |
| Charts:- Daily , Weekly | |
| Add CTT to Watchlist: View: Get Complete CTT Trend Analysis ➞ | |
 | HNH Handy & Harman Ltd. |
| Sector: Industrials | |
| SubSector: Industrial Equipment & Components | |
| MarketCap: 318.93 Millions | |
| Recent Price: 51.37 Smart Investing & Trading Score: 10 | |
| Day Percent Change: 0.155976% Day Change: -9999 | |
| Week Change: -5.72582% Year-to-date Change: 0.0% | |
| HNH Links: Profile News Message Board | |
| Charts:- Daily , Weekly | |
| Add HNH to Watchlist: View: Get Complete HNH Trend Analysis ➞ | |
 | ACTG Acacia Research Corp |
| Sector: Industrials | |
| SubSector: Business Equipment & Supplies | |
| MarketCap: 318.27 Millions | |
| Recent Price: 3.30 Smart Investing & Trading Score: 20 | |
| Day Percent Change: -1.1976% Day Change: 0.02 | |
| Week Change: 0.303951% Year-to-date Change: -24.1% | |
| ACTG Links: Profile News Message Board | |
| Charts:- Daily , Weekly | |
| Add ACTG to Watchlist: View: Get Complete ACTG Trend Analysis ➞ | |
 | VTIQ VectoIQ Acquisition Corp. |
| Sector: Industrials | |
| SubSector: Conglomerates | |
| MarketCap: 315.648 Millions | |
| Recent Price: 10.06 Smart Investing & Trading Score: 30 | |
| Day Percent Change: 0% Day Change: -9999 | |
| Week Change: 0% Year-to-date Change: 0.0% | |
| VTIQ Links: Profile News Message Board | |
| Charts:- Daily , Weekly | |
| Add VTIQ to Watchlist: View: Get Complete VTIQ Trend Analysis ➞ | |
 | NL NL Industries, Inc |
| Sector: Industrials | |
| SubSector: Security & Protection Services | |
| MarketCap: 311.26 Millions | |
| Recent Price: 6.37 Smart Investing & Trading Score: 10 | |
| Day Percent Change: -4.06627% Day Change: 0.09 | |
| Week Change: -5.20833% Year-to-date Change: -14.7% | |
| NL Links: Profile News Message Board | |
| Charts:- Daily , Weekly | |
| Add NL to Watchlist: View: Get Complete NL Trend Analysis ➞ | |
 | MG Mistras Group Inc |
| Sector: Industrials | |
| SubSector: Security & Protection Services | |
| MarketCap: 306.87 Millions | |
| Recent Price: 9.73 Smart Investing & Trading Score: 90 | |
| Day Percent Change: -0.61287% Day Change: 0.05 | |
| Week Change: 0.93361% Year-to-date Change: 9.6% | |
| MG Links: Profile News Message Board | |
| Charts:- Daily , Weekly | |
| Add MG to Watchlist: View: Get Complete MG Trend Analysis ➞ | |
 | GFA Gafisa S.A. |
| Sector: Industrials | |
| SubSector: Residential Construction | |
| MarketCap: 304.96 Millions | |
| Recent Price: 11.29 Smart Investing & Trading Score: 10 | |
| Day Percent Change: 2.26449% Day Change: -9999 | |
| Week Change: -43.8588% Year-to-date Change: 0.0% | |
| GFA Links: Profile News Message Board | |
| Charts:- Daily , Weekly | |
| Add GFA to Watchlist: View: Get Complete GFA Trend Analysis ➞ | |
 | RLGT Radiant Logistics, Inc |
| Sector: Industrials | |
| SubSector: Integrated Freight & Logistics | |
| MarketCap: 304.54 Millions | |
| Recent Price: 6.46 Smart Investing & Trading Score: 80 | |
| Day Percent Change: -0.15456% Day Change: 0.03 | |
| Week Change: 0% Year-to-date Change: -2.1% | |
| RLGT Links: Profile News Message Board | |
| Charts:- Daily , Weekly | |
| Add RLGT to Watchlist: View: Get Complete RLGT Trend Analysis ➞ | |
 | PKOH Park-Ohio Holdings Corp |
| Sector: Industrials | |
| SubSector: Specialty Industrial Machinery | |
| MarketCap: 303.02 Millions | |
| Recent Price: 21.05 Smart Investing & Trading Score: 100 | |
| Day Percent Change: 2.98434% Day Change: -0.23 | |
| Week Change: 7.23383% Year-to-date Change: -14.8% | |
| PKOH Links: Profile News Message Board | |
| Charts:- Daily , Weekly | |
| Add PKOH to Watchlist: View: Get Complete PKOH Trend Analysis ➞ | |
 | MEC Mayville Engineering Company Inc |
| Sector: Industrials | |
| SubSector: Metal Fabrication | |
| MarketCap: 302.13 Millions | |
| Recent Price: 14.87 Smart Investing & Trading Score: 70 | |
| Day Percent Change: 4.05878% Day Change: -0.17 | |
| Week Change: 1.98903% Year-to-date Change: -4.3% | |
| MEC Links: Profile News Message Board | |
| Charts:- Daily , Weekly | |
| Add MEC to Watchlist: View: Get Complete MEC Trend Analysis ➞ | |
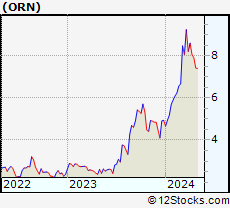 | ORN Orion Group Holdings Inc |
| Sector: Industrials | |
| SubSector: Engineering & Construction | |
| MarketCap: 301.19 Millions | |
| Recent Price: 7.58 Smart Investing & Trading Score: 60 | |
| Day Percent Change: -0.78534% Day Change: -0.03 | |
| Week Change: 4.84094% Year-to-date Change: 2.3% | |
| ORN Links: Profile News Message Board | |
| Charts:- Daily , Weekly | |
| Add ORN to Watchlist: View: Get Complete ORN Trend Analysis ➞ | |
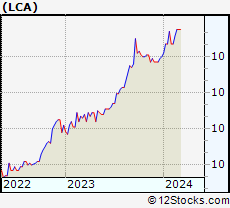 | LCA Landcadia Holdings II, Inc. |
| Sector: Industrials | |
| SubSector: Conglomerates | |
| MarketCap: 297.248 Millions | |
| Recent Price: 10.54 Smart Investing & Trading Score: 20 | |
| Day Percent Change: 0% Day Change: -9999 | |
| Week Change: 0% Year-to-date Change: 0.0% | |
| LCA Links: Profile News Message Board | |
| Charts:- Daily , Weekly | |
| Add LCA to Watchlist: View: Get Complete LCA Trend Analysis ➞ | |
 | INS Intelligent Systems Corporation |
| Sector: Industrials | |
| SubSector: Diversified Machinery | |
| MarketCap: 291.716 Millions | |
| Recent Price: 1.51 Smart Investing & Trading Score: 20 | |
| Day Percent Change: 0.666667% Day Change: -9999 | |
| Week Change: -96.2222% Year-to-date Change: 0.0% | |
| INS Links: Profile News Message Board | |
| Charts:- Daily , Weekly | |
| Add INS to Watchlist: View: Get Complete INS Trend Analysis ➞ | |
| For tabular summary view of above stock list: Summary View ➞ 0 - 25 , 25 - 50 , 50 - 75 , 75 - 100 , 100 - 125 , 125 - 150 , 150 - 175 , 175 - 200 , 200 - 225 , 225 - 250 , 250 - 275 , 275 - 300 , 300 - 325 , 325 - 350 , 350 - 375 , 375 - 400 , 400 - 425 , 425 - 450 , 450 - 475 , 475 - 500 , 500 - 525 | ||
| Click To Change The Sort Order: By Market Cap or Company Size Performance: Year-to-date, Week and Day | |
| Select Chart Type: | ||
|
Best Stocks Today 12Stocks.com |
© 2025 12Stocks.com Terms & Conditions Privacy Contact Us
All Information Provided Only For Education And Not To Be Used For Investing or Trading. See Terms & Conditions


One More Thing ... Get Best Stocks Delivered Daily!
Never Ever Miss A Move With Our Top Ten Stocks Lists
Find Best Stocks In Any Market - Bull or Bear Market
Take A Peek At Our Top Ten Stocks Lists: Daily, Weekly, Year-to-Date & Top Trends
Find Best Stocks In Any Market - Bull or Bear Market
Take A Peek At Our Top Ten Stocks Lists: Daily, Weekly, Year-to-Date & Top Trends
Industrial Stocks With Best Up Trends [0-bearish to 100-bullish]: Brooge [100], CryoPort [100], Concrete Pumping[100], Mirion Technologies[100], Herc [100], Stanley Black[100], JELD-WEN Holding[100], Builders Firstsource[100], Bloom Energy[100], SiteOne Landscape[100], Embraer S.A.[100]
Best Industrial Stocks Year-to-Date:
Triumph [1432.18%], Tecogen [486.452%], GrafTech [476.744%], Power [197.092%], Lightbridge Corp[179.02%], Willdan [162.367%], Tutor Perini[159.23%], Kratos Defense[145.679%], Astronics Corp[144.965%], Bloom Energy[144.202%], Amprius Technologies[142.5%] Best Industrial Stocks This Week:
TRC [10149.1%], Advanced Emissions[3571.78%], L3 Technologies[1915.25%], Forterra [1845.47%], GrafTech [896.885%], KLX [437.488%], Allegro Merger[402.182%], LMI Aerospace[291.621%], Chicago Bridge[205.472%], Covanta Holding[148.617%], MOOG [148.377%] Best Industrial Stocks Daily:
Brooge [29.5547%], CryoPort [16.9492%], Concrete Pumping[12.188%], Tecogen [10.989%], Mirion Technologies[9.09957%], B/E Aerospace[8.86381%], Ballard Power[7.56757%], Hurco [7.494%], GrafTech [7.35931%], Herc [7.34109%], Symbotic [6.70057%]