
 Login Sign Up


| |||||
 |  | ||||

| 12Stocks.com Market Intelligence |
Best Industrial Stocks
| In a hurry? Industrial Stocks Lists: Performance Trends Table, Stock Charts
Sort Industrial stocks: Daily, Weekly, Year-to-Date, Market Cap & Trends. Filter Industrial stocks list by size:All Industrial Large Mid-Range Small |
| 12Stocks.com Industrial Stocks Performances & Trends Daily | |||||||||
|
|  The overall Smart Investing & Trading Score is 50 (0-bearish to 100-bullish) which puts Industrial sector in short term neutral trend. The Smart Investing & Trading Score from previous trading session is 40 and hence an improvement of trend.
| ||||||||
Here are the Smart Investing & Trading Scores of the most requested Industrial stocks at 12Stocks.com (click stock name for detailed review):
|


| 12Stocks.com: Investing in Industrial sector with Stocks | |
|
The following table helps investors and traders sort through current performance and trends (as measured by Smart Investing & Trading Score) of various
stocks in the Industrial sector. Quick View: Move mouse or cursor over stock symbol (ticker) to view short-term Technical chart and over stock name to view long term chart. Click on  to add stock symbol to your watchlist and to add stock symbol to your watchlist and  to view watchlist. Click on any ticker or stock name for detailed market intelligence report for that stock. to view watchlist. Click on any ticker or stock name for detailed market intelligence report for that stock. |
12Stocks.com Performance of Stocks in Industrial Sector
| Ticker | Stock Name | Watchlist | Category | Recent Price | Smart Investing & Trading Score | Change % | YTD Change% |
| PGEM | Ply Gem |   | Building Materials | 128.45 | 80 | 0.61% | 0.00% |
| BRSS | Global Brass | | Fabrication | 42.97 | 30 | 2.02% | 0.00% |
| CNHI | CNH | | Machinery | 10.11 | 10 | 0.60% | 0.00% |
| DOOR | Masonite | | Building Materials | 58.13 | 20 | 1.40% | 0.00% |
| CBPX | Continental Building | | Building Materials | 77.44 | 80 | 1.56% | 0.00% |
| OA | Orbital ATK | | Aerospace/Defense | 96.73 | 80 | -0.23% | 0.00% |
| KLXI | KLX | | Aerospace/Defense | 57.78 | 100 | 1.46% | 0.00% |
| EVA | Enviva Partners | | Lumber, Wood | 0.42 | 60 | 2.22% | 0.00% |
| AJRD | Aerojet Rocketdyne | | Aerospace/Defense | 18.47 | 20 | 2.27% | 0.00% |
| CAA | CalAtlantic | | Residential | 124.67 | 70 | 0.20% | 0.00% |
| MCRN | Milacron | | Machinery | 199.54 | 0 | 0.95% | 0.00% |
| BMCH | BMC Stock | | Building Materials | 5.53 | 10 | -0.18% | 0.00% |
| BLVD | Boulevard Acquisition | | Conglomerates | 66.86 | 70 | 0.30% | 0.00% |
| ANDA | Andina Acquisition | | Conglomerates | 9.20 | 20 | 0.00% | 0.00% |
| ARNC | Arconic | | Fabrication | 9.10 | 30 | 1.11% | 0.00% |
| ADSW | Advanced Disposal | | Waste Mgmt | 40.09 | 60 | -0.50% | 0.00% |
| FRTA | Forterra | | Building Materials | 448.82 | 60 | 1.20% | 0.00% |
| HEBT | Hebron Technology | | Machinery | 10.75 | 20 | -2.98% | 0.00% |
| WBT | Welbilt | | Machinery | 24.01 | 20 | 0.00% | 0.00% |
| AAXN | Axon Enterprise | | Aerospace/Defense | 58.81 | 10 | -1.01% | 0.00% |
| AQUA | Evoqua Water | | Pollution & Treatment Controls | 49.88 | 20 | 0.00% | 0.00% |
| BOMN | Boston Omaha | | Conglomerates | 22.96 | 0 | -4.29% | 0.00% |
| GTYH | GTY Technology | | Conglomerates | 6.30 | 30 | 0.00% | 0.00% |
| ALGR | Allegro Merger | | Conglomerates | 69.05 | 80 | -0.88% | 0.00% |
| SAMA | Schultze Special | | Conglomerates | 10.58 | 20 | 0.00% | 0.00% |
| For chart view version of above stock list: Chart View ➞ 0 - 25 , 25 - 50 , 50 - 75 , 75 - 100 , 100 - 125 , 125 - 150 , 150 - 175 , 175 - 200 , 200 - 225 , 225 - 250 , 250 - 275 , 275 - 300 , 300 - 325 , 325 - 350 , 350 - 375 , 375 - 400 , 400 - 425 , 425 - 450 , 450 - 475 , 475 - 500 , 500 - 525 | ||
 | Click To Change The Sort Order: By Market Cap or Company Size Performance: Year-to-date, Week and Day |  |
|
Get the most comprehensive stock market coverage daily at 12Stocks.com ➞ Best Stocks Today ➞ Best Stocks Weekly ➞ Best Stocks Year-to-Date ➞ Best Stocks Trends ➞  Best Stocks Today 12Stocks.com Best Nasdaq Stocks ➞ Best S&P 500 Stocks ➞ Best Tech Stocks ➞ Best Biotech Stocks ➞ |
| Detailed Overview of Industrial Stocks |
| Industrial Technical Overview, Leaders & Laggards, Top Industrial ETF Funds & Detailed Industrial Stocks List, Charts, Trends & More |
| Industrial Sector: Technical Analysis, Trends & YTD Performance | |
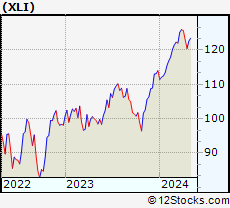
| Industrial sector is composed of stocks
from industrial machinery, aerospace, defense, farm/construction
and industrial services subsectors. Industrial sector, as represented by XLI, an exchange-traded fund [ETF] that holds basket of Industrial stocks (e.g, Caterpillar, Boeing) is up by 16.3439% and is currently outperforming the overall market by 3.0962% year-to-date. Below is a quick view of Technical charts and trends: |
|
 XLI Weekly Chart |
|
| Long Term Trend: Good | |
| Medium Term Trend: Not Good | |
 XLI Daily Chart |
|
| Short Term Trend: Deteriorating | |
| Overall Trend Score: 50 | |
| YTD Performance: 16.3439% | |
| **Trend Scores & Views Are Only For Educational Purposes And Not For Investing | |
| 12Stocks.com: Top Performing Industrial Sector Stocks | ||||||||||||||||||||||||||||||||||||||||||||||||
 The top performing Industrial sector stocks year to date are
Now, more recently, over last week, the top performing Industrial sector stocks on the move are


|
||||||||||||||||||||||||||||||||||||||||||||||||
| 12Stocks.com: Investing in Industrial Sector using Exchange Traded Funds | |
|
The following table shows list of key exchange traded funds (ETF) that
help investors track Industrial Index. For detailed view, check out our ETF Funds section of our website. Quick View: Move mouse or cursor over ETF symbol (ticker) to view short-term Technical chart and over ETF name to view long term chart. Click on ticker or stock name for detailed view. Click on to add stock symbol to your watchlist and to view watchlist. |
12Stocks.com List of ETFs that track Industrial Index
| Ticker | ETF Name | Watchlist | Recent Price | Smart Investing & Trading Score | Change % | Week % | Year-to-date % |
| CHII | China Industrials | | 9.80 | 20 | 0 | -0.0509944 | 0% |
| 12Stocks.com: Charts, Trends, Fundamental Data and Performances of Industrial Stocks | |
|
We now take in-depth look at all Industrial stocks including charts, multi-period performances and overall trends (as measured by Smart Investing & Trading Score). One can sort Industrial stocks (click link to choose) by Daily, Weekly and by Year-to-Date performances. Also, one can sort by size of the company or by market capitalization. |
| Select Your Default Chart Type: | |||||
| |||||
| Click on stock symbol or name for detailed view. Click on to add stock symbol to your watchlist and to view watchlist. Quick View: Move mouse or cursor over "Daily" to quickly view daily Technical stock chart and over "Weekly" to view weekly Technical stock chart. | |||||

 | PGEM Ply Gem Holdings, Inc |
| Sector: Industrials | |
| SubSector: General Building Materials | |
| MarketCap: 1251.83 Millions | |
| Recent Price: 128.45 Smart Investing & Trading Score: 80 | |
| Day Percent Change: 0.61095% Day Change: -9999 | |
| Week Change: 41.4648% Year-to-date Change: 0.0% | |
| PGEM Links: Profile News Message Board | |
| Charts:- Daily , Weekly | |
| Add PGEM to Watchlist: View: Get Complete PGEM Trend Analysis ➞ | |
 | BRSS Global Brass and Copper Holdings, Inc. |
| Sector: Industrials | |
| SubSector: Metal Fabrication | |
| MarketCap: 774.64 Millions | |
| Recent Price: 42.97 Smart Investing & Trading Score: 30 | |
| Day Percent Change: 2.01804% Day Change: -9999 | |
| Week Change: -30.2208% Year-to-date Change: 0.0% | |
| BRSS Links: Profile News Message Board | |
| Charts:- Daily , Weekly | |
| Add BRSS to Watchlist: View: Get Complete BRSS Trend Analysis ➞ | |
 | CNHI CNH Industrial N.V. |
| Sector: Industrials | |
| SubSector: Farm & Construction Machinery | |
| MarketCap: 9366.57 Millions | |
| Recent Price: 10.11 Smart Investing & Trading Score: 10 | |
| Day Percent Change: 0.597015% Day Change: -9999 | |
| Week Change: -2.78846% Year-to-date Change: 0.0% | |
| CNHI Links: Profile News Message Board | |
| Charts:- Daily , Weekly | |
| Add CNHI to Watchlist: View: Get Complete CNHI Trend Analysis ➞ | |
 | DOOR Masonite International Corporation |
| Sector: Industrials | |
| SubSector: General Building Materials | |
| MarketCap: 1220.53 Millions | |
| Recent Price: 58.13 Smart Investing & Trading Score: 20 | |
| Day Percent Change: 1.39543% Day Change: -9999 | |
| Week Change: -56.2406% Year-to-date Change: 0.0% | |
| DOOR Links: Profile News Message Board | |
| Charts:- Daily , Weekly | |
| Add DOOR to Watchlist: View: Get Complete DOOR Trend Analysis ➞ | |
 | CBPX Continental Building Products, Inc. |
| Sector: Industrials | |
| SubSector: General Building Materials | |
| MarketCap: 1037.76 Millions | |
| Recent Price: 77.44 Smart Investing & Trading Score: 80 | |
| Day Percent Change: 1.56066% Day Change: -9999 | |
| Week Change: 56.3181% Year-to-date Change: 0.0% | |
| CBPX Links: Profile News Message Board | |
| Charts:- Daily , Weekly | |
| Add CBPX to Watchlist: View: Get Complete CBPX Trend Analysis ➞ | |
 | OA Orbital ATK, Inc. |
| Sector: Industrials | |
| SubSector: Aerospace/Defense Products & Services | |
| MarketCap: 5933.38 Millions | |
| Recent Price: 96.73 Smart Investing & Trading Score: 80 | |
| Day Percent Change: -0.226921% Day Change: -9999 | |
| Week Change: 5.1756% Year-to-date Change: 0.0% | |
| OA Links: Profile News Message Board | |
| Charts:- Daily , Weekly | |
| Add OA to Watchlist: View: Get Complete OA Trend Analysis ➞ | |
 | KLXI KLX Inc. |
| Sector: Industrials | |
| SubSector: Aerospace/Defense Products & Services | |
| MarketCap: 2469.78 Millions | |
| Recent Price: 57.78 Smart Investing & Trading Score: 100 | |
| Day Percent Change: 1.45742% Day Change: -9999 | |
| Week Change: 437.488% Year-to-date Change: 0.0% | |
| KLXI Links: Profile News Message Board | |
| Charts:- Daily , Weekly | |
| Add KLXI to Watchlist: View: Get Complete KLXI Trend Analysis ➞ | |
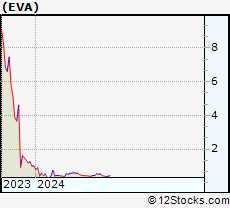 | EVA Enviva Partners, LP |
| Sector: Industrials | |
| SubSector: Lumber, Wood Production | |
| MarketCap: 957.238 Millions | |
| Recent Price: 0.42 Smart Investing & Trading Score: 60 | |
| Day Percent Change: 2.21573% Day Change: -9999 | |
| Week Change: 6.73786% Year-to-date Change: 0.0% | |
| EVA Links: Profile News Message Board | |
| Charts:- Daily , Weekly | |
| Add EVA to Watchlist: View: Get Complete EVA Trend Analysis ➞ | |
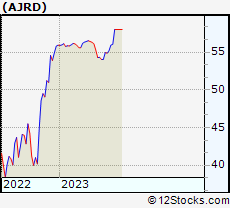 | AJRD Aerojet Rocketdyne Holdings, Inc. |
| Sector: Industrials | |
| SubSector: Aerospace/Defense - Major Diversified | |
| MarketCap: 3451.49 Millions | |
| Recent Price: 18.47 Smart Investing & Trading Score: 20 | |
| Day Percent Change: 2.27021% Day Change: -9999 | |
| Week Change: -68.1497% Year-to-date Change: 0.0% | |
| AJRD Links: Profile News Message Board | |
| Charts:- Daily , Weekly | |
| Add AJRD to Watchlist: View: Get Complete AJRD Trend Analysis ➞ | |
 | CAA CalAtlantic Group, Inc. |
| Sector: Industrials | |
| SubSector: Residential Construction | |
| MarketCap: 4267.92 Millions | |
| Recent Price: 124.67 Smart Investing & Trading Score: 70 | |
| Day Percent Change: 0.200932% Day Change: -9999 | |
| Week Change: 1.92119% Year-to-date Change: 0.0% | |
| CAA Links: Profile News Message Board | |
| Charts:- Daily , Weekly | |
| Add CAA to Watchlist: View: Get Complete CAA Trend Analysis ➞ | |
 | MCRN Milacron Holdings Corp. |
| Sector: Industrials | |
| SubSector: Diversified Machinery | |
| MarketCap: 1240.92 Millions | |
| Recent Price: 199.54 Smart Investing & Trading Score: 0 | |
| Day Percent Change: 0.946021% Day Change: -9999 | |
| Week Change: -6.56927% Year-to-date Change: 0.0% | |
| MCRN Links: Profile News Message Board | |
| Charts:- Daily , Weekly | |
| Add MCRN to Watchlist: View: Get Complete MCRN Trend Analysis ➞ | |
 | BMCH BMC Stock Holdings, Inc. |
| Sector: Industrials | |
| SubSector: General Building Materials | |
| MarketCap: 1216.93 Millions | |
| Recent Price: 5.53 Smart Investing & Trading Score: 10 | |
| Day Percent Change: -0.180505% Day Change: -9999 | |
| Week Change: -20.7736% Year-to-date Change: 0.0% | |
| BMCH Links: Profile News Message Board | |
| Charts:- Daily , Weekly | |
| Add BMCH to Watchlist: View: Get Complete BMCH Trend Analysis ➞ | |
 | BLVD Boulevard Acquisition Corp. II |
| Sector: Industrials | |
| SubSector: Conglomerates | |
| MarketCap: 823.58 Millions | |
| Recent Price: 66.86 Smart Investing & Trading Score: 70 | |
| Day Percent Change: 0.30003% Day Change: -9999 | |
| Week Change: 24.2058% Year-to-date Change: 0.0% | |
| BLVD Links: Profile News Message Board | |
| Charts:- Daily , Weekly | |
| Add BLVD to Watchlist: View: Get Complete BLVD Trend Analysis ➞ | |
 | ANDA Andina Acquisition Corp. III |
| Sector: Industrials | |
| SubSector: Conglomerates | |
| MarketCap: 137.248 Millions | |
| Recent Price: 9.20 Smart Investing & Trading Score: 20 | |
| Day Percent Change: 0% Day Change: -9999 | |
| Week Change: 0% Year-to-date Change: 0.0% | |
| ANDA Links: Profile News Message Board | |
| Charts:- Daily , Weekly | |
| Add ANDA to Watchlist: View: Get Complete ANDA Trend Analysis ➞ | |
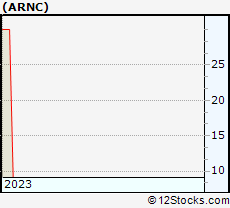 | ARNC Arconic Corporation |
| Sector: Industrials | |
| SubSector: Metal Fabrication | |
| MarketCap: 33627 Millions | |
| Recent Price: 9.10 Smart Investing & Trading Score: 30 | |
| Day Percent Change: 1.11111% Day Change: -9999 | |
| Week Change: -69.6566% Year-to-date Change: 0.0% | |
| ARNC Links: Profile News Message Board | |
| Charts:- Daily , Weekly | |
| Add ARNC to Watchlist: View: Get Complete ARNC Trend Analysis ➞ | |
 | ADSW Advanced Disposal Services, Inc. |
| Sector: Industrials | |
| SubSector: Waste Management | |
| MarketCap: 2863.68 Millions | |
| Recent Price: 40.09 Smart Investing & Trading Score: 60 | |
| Day Percent Change: -0.496401% Day Change: -9999 | |
| Week Change: 10.0467% Year-to-date Change: 0.0% | |
| ADSW Links: Profile News Message Board | |
| Charts:- Daily , Weekly | |
| Add ADSW to Watchlist: View: Get Complete ADSW Trend Analysis ➞ | |
 | FRTA Forterra, Inc. |
| Sector: Industrials | |
| SubSector: General Building Materials | |
| MarketCap: 327.553 Millions | |
| Recent Price: 448.82 Smart Investing & Trading Score: 60 | |
| Day Percent Change: 1.20183% Day Change: -9999 | |
| Week Change: 1845.47% Year-to-date Change: 0.0% | |
| FRTA Links: Profile News Message Board | |
| Charts:- Daily , Weekly | |
| Add FRTA to Watchlist: View: Get Complete FRTA Trend Analysis ➞ | |
 | HEBT Hebron Technology Co., Ltd. |
| Sector: Industrials | |
| SubSector: Diversified Machinery | |
| MarketCap: 101.016 Millions | |
| Recent Price: 10.75 Smart Investing & Trading Score: 20 | |
| Day Percent Change: -2.97834% Day Change: -9999 | |
| Week Change: -47.1225% Year-to-date Change: 0.0% | |
| HEBT Links: Profile News Message Board | |
| Charts:- Daily , Weekly | |
| Add HEBT to Watchlist: View: Get Complete HEBT Trend Analysis ➞ | |
 | WBT Welbilt, Inc. |
| Sector: Industrials | |
| SubSector: Diversified Machinery | |
| MarketCap: 799.116 Millions | |
| Recent Price: 24.01 Smart Investing & Trading Score: 20 | |
| Day Percent Change: 0% Day Change: -9999 | |
| Week Change: 0% Year-to-date Change: 0.0% | |
| WBT Links: Profile News Message Board | |
| Charts:- Daily , Weekly | |
| Add WBT to Watchlist: View: Get Complete WBT Trend Analysis ➞ | |
 | AAXN Axon Enterprise, Inc. |
| Sector: Industrials | |
| SubSector: Aerospace/Defense Products & Services | |
| MarketCap: 3857.41 Millions | |
| Recent Price: 58.81 Smart Investing & Trading Score: 10 | |
| Day Percent Change: -1.00993% Day Change: -9999 | |
| Week Change: -15.8535% Year-to-date Change: 0.0% | |
| AAXN Links: Profile News Message Board | |
| Charts:- Daily , Weekly | |
| Add AAXN to Watchlist: View: Get Complete AAXN Trend Analysis ➞ | |
 | AQUA Evoqua Water Technologies Corp. |
| Sector: Industrials | |
| SubSector: Pollution & Treatment Controls | |
| MarketCap: 1105.75 Millions | |
| Recent Price: 49.88 Smart Investing & Trading Score: 20 | |
| Day Percent Change: 0% Day Change: -9999 | |
| Week Change: 0% Year-to-date Change: 0.0% | |
| AQUA Links: Profile News Message Board | |
| Charts:- Daily , Weekly | |
| Add AQUA to Watchlist: View: Get Complete AQUA Trend Analysis ➞ | |
 | BOMN Boston Omaha Corporation |
| Sector: Industrials | |
| SubSector: Conglomerates | |
| MarketCap: 416.548 Millions | |
| Recent Price: 22.96 Smart Investing & Trading Score: 0 | |
| Day Percent Change: -4.29346% Day Change: -9999 | |
| Week Change: -8.85272% Year-to-date Change: 0.0% | |
| BOMN Links: Profile News Message Board | |
| Charts:- Daily , Weekly | |
| Add BOMN to Watchlist: View: Get Complete BOMN Trend Analysis ➞ | |
 | GTYH GTY Technology Holdings Inc. |
| Sector: Industrials | |
| SubSector: Conglomerates | |
| MarketCap: 260.448 Millions | |
| Recent Price: 6.30 Smart Investing & Trading Score: 30 | |
| Day Percent Change: 0% Day Change: -9999 | |
| Week Change: 0% Year-to-date Change: 0.0% | |
| GTYH Links: Profile News Message Board | |
| Charts:- Daily , Weekly | |
| Add GTYH to Watchlist: View: Get Complete GTYH Trend Analysis ➞ | |
 | ALGR Allegro Merger Corp. |
| Sector: Industrials | |
| SubSector: Conglomerates | |
| MarketCap: 158.848 Millions | |
| Recent Price: 69.05 Smart Investing & Trading Score: 80 | |
| Day Percent Change: -0.875682% Day Change: -9999 | |
| Week Change: 402.182% Year-to-date Change: 0.0% | |
| ALGR Links: Profile News Message Board | |
| Charts:- Daily , Weekly | |
| Add ALGR to Watchlist: View: Get Complete ALGR Trend Analysis ➞ | |
 | SAMA Schultze Special Purpose Acquisition Corp. |
| Sector: Industrials | |
| SubSector: Conglomerates | |
| MarketCap: 161.048 Millions | |
| Recent Price: 10.58 Smart Investing & Trading Score: 20 | |
| Day Percent Change: 0% Day Change: -9999 | |
| Week Change: 0% Year-to-date Change: 0.0% | |
| SAMA Links: Profile News Message Board | |
| Charts:- Daily , Weekly | |
| Add SAMA to Watchlist: View: Get Complete SAMA Trend Analysis ➞ | |
| For tabular summary view of above stock list: Summary View ➞ 0 - 25 , 25 - 50 , 50 - 75 , 75 - 100 , 100 - 125 , 125 - 150 , 150 - 175 , 175 - 200 , 200 - 225 , 225 - 250 , 250 - 275 , 275 - 300 , 300 - 325 , 325 - 350 , 350 - 375 , 375 - 400 , 400 - 425 , 425 - 450 , 450 - 475 , 475 - 500 , 500 - 525 | ||
| Click To Change The Sort Order: By Market Cap or Company Size Performance: Year-to-date, Week and Day | |
| Select Chart Type: | ||
|
Best Stocks Today 12Stocks.com |
© 2025 12Stocks.com Terms & Conditions Privacy Contact Us
All Information Provided Only For Education And Not To Be Used For Investing or Trading. See Terms & Conditions


One More Thing ... Get Best Stocks Delivered Daily!
Never Ever Miss A Move With Our Top Ten Stocks Lists
Find Best Stocks In Any Market - Bull or Bear Market
Take A Peek At Our Top Ten Stocks Lists: Daily, Weekly, Year-to-Date & Top Trends
Find Best Stocks In Any Market - Bull or Bear Market
Take A Peek At Our Top Ten Stocks Lists: Daily, Weekly, Year-to-Date & Top Trends
Industrial Stocks With Best Up Trends [0-bearish to 100-bullish]: Brooge [100], Bloom Energy[100], Babcock & Wilcox Enterprises[100], Kratos Defense[100], VSE Corp[100], Sturm Ruger[100], PICO [100], Saia [100], Mercury Systems[100], Herc [100], Quad/Graphics [100]
Best Industrial Stocks Year-to-Date:
Triumph [1324.01%], GrafTech [525.581%], Tecogen [486.452%], Power [236.709%], Bloom Energy[213.607%], Lightbridge Corp[197.255%], Kratos Defense[189.424%], ESGL [170.593%], Willdan [166.932%], Tutor Perini[164.404%], Astronics Corp[154.275%] Best Industrial Stocks This Week:
TRC [10149.1%], Advanced Emissions[3571.78%], L3 Technologies[1915.25%], Forterra [1845.47%], KLX [437.488%], Allegro Merger[402.182%], LMI Aerospace[291.621%], Chicago Bridge[205.472%], Covanta Holding[148.617%], MOOG [148.377%], Altra [103.372%] Best Industrial Stocks Daily:
Brooge [29.5547%], Tecogen [10.989%], Bloom Energy[9.35542%], B/E Aerospace[8.86381%], Cimpress [8.78625%], Babcock & Wilcox Enterprises[8.47458%], Kratos Defense[7.93045%], Plug Power[7.00637%], Orion [6.23342%], AeroVironment [5.90742%], William Lyon[4.78516%]