
 Login Sign Up


| |||||
 |  | ||||

| 12Stocks.com Market Intelligence |
Best Industrial Stocks
| In a hurry? Industrial Stocks Lists: Performance Trends Table, Stock Charts
Sort Industrial stocks: Daily, Weekly, Year-to-Date, Market Cap & Trends. Filter Industrial stocks list by size:All Industrial Large Mid-Range Small |
| 12Stocks.com Industrial Stocks Performances & Trends Daily | |||||||||
|
|  The overall Smart Investing & Trading Score is 49 (0-bearish to 100-bullish) which puts Industrial sector in short term neutral trend. The Smart Investing & Trading Score from previous trading session is 31 and hence an improvement of trend.
| ||||||||
Here are the Smart Investing & Trading Scores of the most requested Industrial stocks at 12Stocks.com (click stock name for detailed review):
|


| 12Stocks.com: Investing in Industrial sector with Stocks | |
|
The following table helps investors and traders sort through current performance and trends (as measured by Smart Investing & Trading Score) of various
stocks in the Industrial sector. Quick View: Move mouse or cursor over stock symbol (ticker) to view short-term Technical chart and over stock name to view long term chart. Click on  to add stock symbol to your watchlist and to add stock symbol to your watchlist and  to view watchlist. Click on any ticker or stock name for detailed market intelligence report for that stock. to view watchlist. Click on any ticker or stock name for detailed market intelligence report for that stock. |
12Stocks.com Performance of Stocks in Industrial Sector
| Ticker | Stock Name | Watchlist | Category | Recent Price | Smart Investing & Trading Score | Change % | YTD Change% |
| TS | Tenaris S.A |   | Fabrication | 37.98 | 46 | -0.30% | 9.28% |
| GFF | Griffon | | Building Materials | 66.56 | 26 | 1.99% | 9.20% |
| BZ | Kanzhun | | Staffing & Employment | 18.02 | 51 | -0.50% | 9.08% |
| PNR | Pentair | | Equipment | 79.28 | 41 | 0.13% | 9.04% |
| AME | AMETEK | | Machinery | 179.21 | 49 | 0.65% | 8.68% |
| FSS | Federal Signal | | Pollution & Treatment Controls | 83.12 | 38 | 0.64% | 8.31% |
| ATKR | Atkore | | Electrical Equipment | 173.13 | 41 | 1.77% | 8.21% |
| CWST | Casella Waste | | Waste Mgmt | 92.42 | 36 | -0.03% | 8.14% |
| TREX | Trex | | Building Materials | 89.47 | 26 | 1.94% | 8.07% |
| BDC | Belden | | Electrical Equipment | 83.14 | 26 | 0.99% | 7.63% |
| OTIS | Otis Worldwide | | Specialty Industrial Machinery | 96.13 | 49 | 1.23% | 7.44% |
| BECN | Beacon Roofing | | Building Materials | 93.27 | 36 | 0.10% | 7.18% |
| AMSC | American Superconductor | | Electrical Equipment | 11.93 | 26 | 0.42% | 7.09% |
| BCC | Boise Cascade | | Lumber, Wood | 138.53 | 26 | 0.53% | 7.09% |
| TEX | Terex | | Machinery | 61.51 | 18 | 1.31% | 7.04% |
| GVA | Granite Construction | | Heavy Construction | 54.42 | 31 | 1.11% | 7.00% |
| SXI | Standex | | Equipment | 169.19 | 26 | 1.32% | 6.83% |
| SPR | Spirit AeroSystems | | Aerospace/Defense | 33.91 | 61 | 1.62% | 6.70% |
| AOS | A. O. | | Electrical Equipment | 87.68 | 70 | 1.41% | 6.36% |
| TKR | Timken | | Machine Tools | 85.22 | 48 | 1.66% | 6.33% |
| HRT | HireRight | | Staffing & Employment | 14.29 | 54 | 0.35% | 6.25% |
| CX | CEMEX S.A.B. | | Cement | 8.22 | 23 | 0.55% | 6.13% |
| ITT | ITT | | Machinery | 126.51 | 36 | 1.11% | 6.03% |
| BLD | TopBuild | | Building Materials | 396.65 | 26 | 2.03% | 5.98% |
| HAYN | Haynes | | Fabrication | 60.42 | 58 | -0.02% | 5.91% |
| For chart view version of above stock list: Chart View ➞ 0 - 25 , 25 - 50 , 50 - 75 , 75 - 100 , 100 - 125 , 125 - 150 , 150 - 175 , 175 - 200 , 200 - 225 , 225 - 250 , 250 - 275 , 275 - 300 | ||
 | Click To Change The Sort Order: By Market Cap or Company Size Performance: Year-to-date, Week and Day |  |
|
Get the most comprehensive stock market coverage daily at 12Stocks.com ➞ Best Stocks Today ➞ Best Stocks Weekly ➞ Best Stocks Year-to-Date ➞ Best Stocks Trends ➞  Best Stocks Today 12Stocks.com Best Nasdaq Stocks ➞ Best S&P 500 Stocks ➞ Best Tech Stocks ➞ Best Biotech Stocks ➞ |
| Detailed Overview of Industrial Stocks |
| Industrial Technical Overview, Leaders & Laggards, Top Industrial ETF Funds & Detailed Industrial Stocks List, Charts, Trends & More |
| Industrial Sector: Technical Analysis, Trends & YTD Performance | |
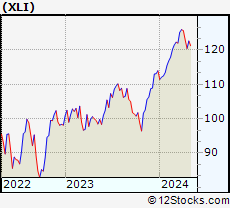
| Industrial sector is composed of stocks
from industrial machinery, aerospace, defense, farm/construction
and industrial services subsectors. Industrial sector, as represented by XLI, an exchange-traded fund [ETF] that holds basket of Industrial stocks (e.g, Caterpillar, Boeing) is up by 7.06% and is currently outperforming the overall market by 2.01% year-to-date. Below is a quick view of Technical charts and trends: |
|
 XLI Weekly Chart |
|
| Long Term Trend: Good | |
| Medium Term Trend: Not Good | |
 XLI Daily Chart |
|
| Short Term Trend: Deteriorating | |
| Overall Trend Score: 49 | |
| YTD Performance: 7.06% | |
| **Trend Scores & Views Are Only For Educational Purposes And Not For Investing | |
| 12Stocks.com: Top Performing Industrial Sector Stocks | ||||||||||||||||||||||||||||||||||||||||||||||||
 The top performing Industrial sector stocks year to date are
Now, more recently, over last week, the top performing Industrial sector stocks on the move are


|
||||||||||||||||||||||||||||||||||||||||||||||||
| 12Stocks.com: Investing in Industrial Sector using Exchange Traded Funds | |
|
The following table shows list of key exchange traded funds (ETF) that
help investors track Industrial Index. For detailed view, check out our ETF Funds section of our website. Quick View: Move mouse or cursor over ETF symbol (ticker) to view short-term Technical chart and over ETF name to view long term chart. Click on ticker or stock name for detailed view. Click on to add stock symbol to your watchlist and to view watchlist. |
12Stocks.com List of ETFs that track Industrial Index
| Ticker | ETF Name | Watchlist | Recent Price | Smart Investing & Trading Score | Change % | Week % | Year-to-date % |
| XLI | Industrial | | 122.04 | 49 | 0.77 | -0.7 | 7.06% |
| UXI | Industrials | | 31.94 | 41 | 0.52 | -2.8 | 10.94% |
| PPA | Aerospace & Defense | | 99.19 | 56 | 0.93 | 0.11 | 7.63% |
| ITA | Aerospace & Defense | | 128.66 | 58 | 0.90 | 0.74 | 1.63% |
| ITB | Home Construction | | 105.05 | 43 | 2.06 | -2.06 | 3.26% |
| XHB | Homebuilders | | 102.54 | 43 | 1.75 | -1.63 | 7.19% |
| SIJ | Short Industrials | | 9.96 | 54 | -1.73 | 1.47 | -12.17% |
| XAR | Aerospace & Defense | | 132.19 | 43 | 0.06 | -1.16 | -2.39% |
| 12Stocks.com: Charts, Trends, Fundamental Data and Performances of Industrial Stocks | |
|
We now take in-depth look at all Industrial stocks including charts, multi-period performances and overall trends (as measured by Smart Investing & Trading Score). One can sort Industrial stocks (click link to choose) by Daily, Weekly and by Year-to-Date performances. Also, one can sort by size of the company or by market capitalization. |
| Select Your Default Chart Type: | |||||
| |||||
| Click on stock symbol or name for detailed view. Click on to add stock symbol to your watchlist and to view watchlist. Quick View: Move mouse or cursor over "Daily" to quickly view daily Technical stock chart and over "Weekly" to view weekly Technical stock chart. | |||||

 | TS Tenaris S.A. |
| Sector: Industrials | |
| SubSector: Metal Fabrication | |
| MarketCap: 7426.8 Millions | |
| Recent Price: 37.98 Smart Investing & Trading Score: 46 | |
| Day Percent Change: -0.30% Day Change: -0.12 | |
| Week Change: -1.41% Year-to-date Change: 9.3% | |
| TS Links: Profile News Message Board | |
| Charts:- Daily , Weekly | |
| Add TS to Watchlist: View: Get Complete TS Trend Analysis ➞ | |
 | GFF Griffon Corporation |
| Sector: Industrials | |
| SubSector: General Building Materials | |
| MarketCap: 616 Millions | |
| Recent Price: 66.56 Smart Investing & Trading Score: 26 | |
| Day Percent Change: 1.99% Day Change: 1.30 | |
| Week Change: -1.52% Year-to-date Change: 9.2% | |
| GFF Links: Profile News Message Board | |
| Charts:- Daily , Weekly | |
| Add GFF to Watchlist: View: Get Complete GFF Trend Analysis ➞ | |
 | BZ Kanzhun Limited |
| Sector: Industrials | |
| SubSector: Staffing & Employment Services | |
| MarketCap: 6680 Millions | |
| Recent Price: 18.02 Smart Investing & Trading Score: 51 | |
| Day Percent Change: -0.50% Day Change: -0.09 | |
| Week Change: -3.82% Year-to-date Change: 9.1% | |
| BZ Links: Profile News Message Board | |
| Charts:- Daily , Weekly | |
| Add BZ to Watchlist: View: Get Complete BZ Trend Analysis ➞ | |
 | PNR Pentair plc |
| Sector: Industrials | |
| SubSector: Industrial Equipment & Components | |
| MarketCap: 4326.59 Millions | |
| Recent Price: 79.28 Smart Investing & Trading Score: 41 | |
| Day Percent Change: 0.13% Day Change: 0.10 | |
| Week Change: -2.24% Year-to-date Change: 9.0% | |
| PNR Links: Profile News Message Board | |
| Charts:- Daily , Weekly | |
| Add PNR to Watchlist: View: Get Complete PNR Trend Analysis ➞ | |
 | AME AMETEK, Inc. |
| Sector: Industrials | |
| SubSector: Diversified Machinery | |
| MarketCap: 16611.8 Millions | |
| Recent Price: 179.21 Smart Investing & Trading Score: 49 | |
| Day Percent Change: 0.65% Day Change: 1.16 | |
| Week Change: -0.28% Year-to-date Change: 8.7% | |
| AME Links: Profile News Message Board | |
| Charts:- Daily , Weekly | |
| Add AME to Watchlist: View: Get Complete AME Trend Analysis ➞ | |
 | FSS Federal Signal Corporation |
| Sector: Industrials | |
| SubSector: Pollution & Treatment Controls | |
| MarketCap: 1694.05 Millions | |
| Recent Price: 83.12 Smart Investing & Trading Score: 38 | |
| Day Percent Change: 0.64% Day Change: 0.53 | |
| Week Change: -0.51% Year-to-date Change: 8.3% | |
| FSS Links: Profile News Message Board | |
| Charts:- Daily , Weekly | |
| Add FSS to Watchlist: View: Get Complete FSS Trend Analysis ➞ | |
 | ATKR Atkore International Group Inc. |
| Sector: Industrials | |
| SubSector: Industrial Electrical Equipment | |
| MarketCap: 1086.79 Millions | |
| Recent Price: 173.13 Smart Investing & Trading Score: 41 | |
| Day Percent Change: 1.77% Day Change: 3.01 | |
| Week Change: 0.91% Year-to-date Change: 8.2% | |
| ATKR Links: Profile News Message Board | |
| Charts:- Daily , Weekly | |
| Add ATKR to Watchlist: View: Get Complete ATKR Trend Analysis ➞ | |
 | CWST Casella Waste Systems, Inc. |
| Sector: Industrials | |
| SubSector: Waste Management | |
| MarketCap: 2093.38 Millions | |
| Recent Price: 92.42 Smart Investing & Trading Score: 36 | |
| Day Percent Change: -0.03% Day Change: -0.03 | |
| Week Change: -2.96% Year-to-date Change: 8.1% | |
| CWST Links: Profile News Message Board | |
| Charts:- Daily , Weekly | |
| Add CWST to Watchlist: View: Get Complete CWST Trend Analysis ➞ | |
 | TREX Trex Company, Inc. |
| Sector: Industrials | |
| SubSector: General Building Materials | |
| MarketCap: 4369.23 Millions | |
| Recent Price: 89.47 Smart Investing & Trading Score: 26 | |
| Day Percent Change: 1.94% Day Change: 1.70 | |
| Week Change: -2.67% Year-to-date Change: 8.1% | |
| TREX Links: Profile News Message Board | |
| Charts:- Daily , Weekly | |
| Add TREX to Watchlist: View: Get Complete TREX Trend Analysis ➞ | |
 | BDC Belden Inc. |
| Sector: Industrials | |
| SubSector: Industrial Electrical Equipment | |
| MarketCap: 1490.59 Millions | |
| Recent Price: 83.14 Smart Investing & Trading Score: 26 | |
| Day Percent Change: 0.99% Day Change: 0.81 | |
| Week Change: -2.48% Year-to-date Change: 7.6% | |
| BDC Links: Profile News Message Board | |
| Charts:- Daily , Weekly | |
| Add BDC to Watchlist: View: Get Complete BDC Trend Analysis ➞ | |
 | OTIS Otis Worldwide Corporation |
| Sector: Industrials | |
| SubSector: Specialty Industrial Machinery | |
| MarketCap: 27727 Millions | |
| Recent Price: 96.13 Smart Investing & Trading Score: 49 | |
| Day Percent Change: 1.23% Day Change: 1.17 | |
| Week Change: -0.03% Year-to-date Change: 7.4% | |
| OTIS Links: Profile News Message Board | |
| Charts:- Daily , Weekly | |
| Add OTIS to Watchlist: View: Get Complete OTIS Trend Analysis ➞ | |
 | BECN Beacon Roofing Supply, Inc. |
| Sector: Industrials | |
| SubSector: General Building Materials | |
| MarketCap: 1210.13 Millions | |
| Recent Price: 93.27 Smart Investing & Trading Score: 36 | |
| Day Percent Change: 0.10% Day Change: 0.09 | |
| Week Change: -3.98% Year-to-date Change: 7.2% | |
| BECN Links: Profile News Message Board | |
| Charts:- Daily , Weekly | |
| Add BECN to Watchlist: View: Get Complete BECN Trend Analysis ➞ | |
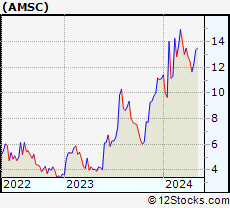 | AMSC American Superconductor Corporation |
| Sector: Industrials | |
| SubSector: Industrial Electrical Equipment | |
| MarketCap: 114.879 Millions | |
| Recent Price: 11.93 Smart Investing & Trading Score: 26 | |
| Day Percent Change: 0.42% Day Change: 0.05 | |
| Week Change: -4.41% Year-to-date Change: 7.1% | |
| AMSC Links: Profile News Message Board | |
| Charts:- Daily , Weekly | |
| Add AMSC to Watchlist: View: Get Complete AMSC Trend Analysis ➞ | |
 | BCC Boise Cascade Company |
| Sector: Industrials | |
| SubSector: Lumber, Wood Production | |
| MarketCap: 963.938 Millions | |
| Recent Price: 138.53 Smart Investing & Trading Score: 26 | |
| Day Percent Change: 0.53% Day Change: 0.73 | |
| Week Change: -7.64% Year-to-date Change: 7.1% | |
| BCC Links: Profile News Message Board | |
| Charts:- Daily , Weekly | |
| Add BCC to Watchlist: View: Get Complete BCC Trend Analysis ➞ | |
 | TEX Terex Corporation |
| Sector: Industrials | |
| SubSector: Farm & Construction Machinery | |
| MarketCap: 1083.07 Millions | |
| Recent Price: 61.51 Smart Investing & Trading Score: 18 | |
| Day Percent Change: 1.31% Day Change: 0.80 | |
| Week Change: -2.94% Year-to-date Change: 7.0% | |
| TEX Links: Profile News Message Board | |
| Charts:- Daily , Weekly | |
| Add TEX to Watchlist: View: Get Complete TEX Trend Analysis ➞ | |
 | GVA Granite Construction Incorporated |
| Sector: Industrials | |
| SubSector: Heavy Construction | |
| MarketCap: 725.895 Millions | |
| Recent Price: 54.42 Smart Investing & Trading Score: 31 | |
| Day Percent Change: 1.11% Day Change: 0.60 | |
| Week Change: -1.66% Year-to-date Change: 7.0% | |
| GVA Links: Profile News Message Board | |
| Charts:- Daily , Weekly | |
| Add GVA to Watchlist: View: Get Complete GVA Trend Analysis ➞ | |
 | SXI Standex International Corporation |
| Sector: Industrials | |
| SubSector: Industrial Equipment & Components | |
| MarketCap: 644.109 Millions | |
| Recent Price: 169.19 Smart Investing & Trading Score: 26 | |
| Day Percent Change: 1.32% Day Change: 2.20 | |
| Week Change: -1.32% Year-to-date Change: 6.8% | |
| SXI Links: Profile News Message Board | |
| Charts:- Daily , Weekly | |
| Add SXI to Watchlist: View: Get Complete SXI Trend Analysis ➞ | |
 | SPR Spirit AeroSystems Holdings, Inc. |
| Sector: Industrials | |
| SubSector: Aerospace/Defense Products & Services | |
| MarketCap: 2283.01 Millions | |
| Recent Price: 33.91 Smart Investing & Trading Score: 61 | |
| Day Percent Change: 1.62% Day Change: 0.54 | |
| Week Change: -1.05% Year-to-date Change: 6.7% | |
| SPR Links: Profile News Message Board | |
| Charts:- Daily , Weekly | |
| Add SPR to Watchlist: View: Get Complete SPR Trend Analysis ➞ | |
 | AOS A. O. Smith Corporation |
| Sector: Industrials | |
| SubSector: Industrial Electrical Equipment | |
| MarketCap: 5809.89 Millions | |
| Recent Price: 87.68 Smart Investing & Trading Score: 70 | |
| Day Percent Change: 1.41% Day Change: 1.22 | |
| Week Change: 1.36% Year-to-date Change: 6.4% | |
| AOS Links: Profile News Message Board | |
| Charts:- Daily , Weekly | |
| Add AOS to Watchlist: View: Get Complete AOS Trend Analysis ➞ | |
 | TKR The Timken Company |
| Sector: Industrials | |
| SubSector: Machine Tools & Accessories | |
| MarketCap: 2277.48 Millions | |
| Recent Price: 85.22 Smart Investing & Trading Score: 48 | |
| Day Percent Change: 1.66% Day Change: 1.39 | |
| Week Change: 0.5% Year-to-date Change: 6.3% | |
| TKR Links: Profile News Message Board | |
| Charts:- Daily , Weekly | |
| Add TKR to Watchlist: View: Get Complete TKR Trend Analysis ➞ | |
 | HRT HireRight Holdings Corporation |
| Sector: Industrials | |
| SubSector: Staffing & Employment Services | |
| MarketCap: 823 Millions | |
| Recent Price: 14.29 Smart Investing & Trading Score: 54 | |
| Day Percent Change: 0.35% Day Change: 0.05 | |
| Week Change: 0.35% Year-to-date Change: 6.3% | |
| HRT Links: Profile News Message Board | |
| Charts:- Daily , Weekly | |
| Add HRT to Watchlist: View: Get Complete HRT Trend Analysis ➞ | |
 | CX CEMEX, S.A.B. de C.V. |
| Sector: Industrials | |
| SubSector: Cement | |
| MarketCap: 2948.23 Millions | |
| Recent Price: 8.22 Smart Investing & Trading Score: 23 | |
| Day Percent Change: 0.55% Day Change: 0.04 | |
| Week Change: -3.91% Year-to-date Change: 6.1% | |
| CX Links: Profile News Message Board | |
| Charts:- Daily , Weekly | |
| Add CX to Watchlist: View: Get Complete CX Trend Analysis ➞ | |
 | ITT ITT Inc. |
| Sector: Industrials | |
| SubSector: Diversified Machinery | |
| MarketCap: 3783.06 Millions | |
| Recent Price: 126.51 Smart Investing & Trading Score: 36 | |
| Day Percent Change: 1.11% Day Change: 1.39 | |
| Week Change: -1.73% Year-to-date Change: 6.0% | |
| ITT Links: Profile News Message Board | |
| Charts:- Daily , Weekly | |
| Add ITT to Watchlist: View: Get Complete ITT Trend Analysis ➞ | |
 | BLD TopBuild Corp. |
| Sector: Industrials | |
| SubSector: General Building Materials | |
| MarketCap: 2534.53 Millions | |
| Recent Price: 396.65 Smart Investing & Trading Score: 26 | |
| Day Percent Change: 2.03% Day Change: 7.91 | |
| Week Change: -5.11% Year-to-date Change: 6.0% | |
| BLD Links: Profile News Message Board | |
| Charts:- Daily , Weekly | |
| Add BLD to Watchlist: View: Get Complete BLD Trend Analysis ➞ | |
 | HAYN Haynes International, Inc. |
| Sector: Industrials | |
| SubSector: Metal Fabrication | |
| MarketCap: 245.75 Millions | |
| Recent Price: 60.42 Smart Investing & Trading Score: 58 | |
| Day Percent Change: -0.02% Day Change: -0.01 | |
| Week Change: -0.4% Year-to-date Change: 5.9% | |
| HAYN Links: Profile News Message Board | |
| Charts:- Daily , Weekly | |
| Add HAYN to Watchlist: View: Get Complete HAYN Trend Analysis ➞ | |
| For tabular summary view of above stock list: Summary View ➞ 0 - 25 , 25 - 50 , 50 - 75 , 75 - 100 , 100 - 125 , 125 - 150 , 150 - 175 , 175 - 200 , 200 - 225 , 225 - 250 , 250 - 275 , 275 - 300 | ||
| Click To Change The Sort Order: By Market Cap or Company Size Performance: Year-to-date, Week and Day | |
| Select Chart Type: | ||
|
Best Stocks Today 12Stocks.com |
© 2024 12Stocks.com Terms & Conditions Privacy Contact Us
All Information Provided Only For Education And Not To Be Used For Investing or Trading. See Terms & Conditions


One More Thing ... Get Best Stocks Delivered Daily!
Never Ever Miss A Move With Our Top Ten Stocks Lists
Find Best Stocks In Any Market - Bull or Bear Market
Take A Peek At Our Top Ten Stocks Lists: Daily, Weekly, Year-to-Date & Top Trends
Find Best Stocks In Any Market - Bull or Bear Market
Take A Peek At Our Top Ten Stocks Lists: Daily, Weekly, Year-to-Date & Top Trends
Industrial Stocks With Best Up Trends [0-bearish to 100-bullish]: HEICO [100], Lockheed Martin[93], ADS-TEC Energy[90], Argan [88], AAR [83], Carpenter Technology[83], Caesarstone [83], VCI Global[80], Sun Country[78], TransDigm [78], Himalaya Shipping[76]
Best Industrial Stocks Year-to-Date:
Tritium DCFC[1502.54%], Intuitive Machines[111.93%], Kaman [92%], FTAI Infrastructure[72.11%], EMCOR [58.18%], Masonite [55.56%], NuScale Power[54.57%], ADS-TEC Energy[51.47%], Graham [50.18%], IES [49.5%], Tutor Perini[48.63%] Best Industrial Stocks This Week:
TPI Composites[9.77%], Frontier [6.62%], Apogee Enterprises[6.33%], Sun Country[5.82%], AAR [5.66%], Mueller Water[5.44%], NET Power[5.42%], Barnes [4.36%], HEICO [4.21%], FTAI Infrastructure[4.12%], ADS-TEC Energy[3.85%] Best Industrial Stocks Daily:
Barnes [9.70%], Montrose Environmental[8.91%], Apogee Enterprises[8.36%], Amprius Technologies[6.07%], Redwire [5.57%], System1 [5.14%], Planet Labs[4.57%], TPI Composites[4.56%], Mueller Water[4.27%], Frontier [3.99%], Powell Industries[3.95%]