
 Login Sign Up


| |||||
 |  | ||||

| 12Stocks.com Market Intelligence |
Best Industrial Stocks
| In a hurry? Industrial Stocks Lists: Performance Trends Table, Stock Charts
Sort Industrial stocks: Daily, Weekly, Year-to-Date, Market Cap & Trends. Filter Industrial stocks list by size:All Industrial Large Mid-Range Small |
| 12Stocks.com Industrial Stocks Performances & Trends Daily | |||||||||
|
|  The overall Smart Investing & Trading Score is 41 (0-bearish to 100-bullish) which puts Industrial sector in short term neutral trend. The Smart Investing & Trading Score from previous trading session is 31 and hence an improvement of trend.
| ||||||||
Here are the Smart Investing & Trading Scores of the most requested Industrial stocks at 12Stocks.com (click stock name for detailed review):
|


| 12Stocks.com: Investing in Industrial sector with Stocks | |
|
The following table helps investors and traders sort through current performance and trends (as measured by Smart Investing & Trading Score) of various
stocks in the Industrial sector. Quick View: Move mouse or cursor over stock symbol (ticker) to view short-term Technical chart and over stock name to view long term chart. Click on  to add stock symbol to your watchlist and to add stock symbol to your watchlist and  to view watchlist. Click on any ticker or stock name for detailed market intelligence report for that stock. to view watchlist. Click on any ticker or stock name for detailed market intelligence report for that stock. |
12Stocks.com Performance of Stocks in Industrial Sector
| Ticker | Stock Name | Watchlist | Category | Recent Price | Smart Investing & Trading Score | Change % | YTD Change% |
| XYL | Xylem |   | Machinery | 127.84 | 68 | 0.53% | 11.79% |
| EMR | Emerson Electric | | Electrical Equipment | 108.58 | 36 | -0.67% | 11.56% |
| MTZ | MasTec | | Heavy Construction | 84.42 | 54 | 1.17% | 11.49% |
| ATI | Allegheny Technologies | | Fabrication | 50.56 | 43 | -1.06% | 11.19% |
| GD | General Dynamics | | Aerospace/Defense | 288.62 | 83 | 1.17% | 11.15% |
| FLS | Flowserve | | Machinery | 45.80 | 49 | 0.37% | 11.11% |
| VMC | Vulcan Materials | | Building Materials | 252.06 | 26 | -1.18% | 11.03% |
| CLH | Clean Harbors | | Waste Mgmt | 193.71 | 56 | 1.47% | 11.00% |
| MWA | Mueller Water | | Equipment | 15.97 | 85 | 0.50% | 10.90% |
| MLI | Mueller Industries | | Fabrication | 52.28 | 54 | -0.08% | 10.88% |
| WCN | Waste Connections | | Waste Mgmt | 165.02 | 56 | 0.40% | 10.55% |
| DOV | Dover | | Machinery | 169.84 | 53 | 0.73% | 10.42% |
| CRS | Carpenter Technology | | Fabrication | 78.04 | 69 | -1.69% | 10.23% |
| HEI | HEICO | | Aerospace/Defense | 197.10 | 81 | 0.22% | 10.19% |
| DCI | Donaldson | | Machinery | 71.91 | 41 | 0.36% | 10.04% |
| STRL | Sterling Construction | | Heavy Construction | 96.56 | 36 | -1.79% | 9.81% |
| NVR | NVR | | Residential | 7685.00 | 49 | -0.22% | 9.78% |
| MYRG | MYR | | Contractors | 158.71 | 41 | -0.08% | 9.74% |
| LECO | Loln Electric | | Small Tools & Accessories | 238.36 | 51 | -0.24% | 9.61% |
| CR | Crane Co | | Machinery | 129.48 | 41 | 0.07% | 9.60% |
| B | Barnes | | Equipment | 35.76 | 68 | -0.89% | 9.59% |
| GMS | GMS | | Building Materials | 90.25 | 36 | 0.19% | 9.49% |
| LXFR | Luxfer | | Machinery | 9.78 | 46 | 4.15% | 9.40% |
| CWST | Casella Waste | | Waste Mgmt | 93.43 | 53 | 1.15% | 9.33% |
| TOL | Toll Brothers | | Residential | 112.21 | 36 | -0.84% | 9.16% |
| For chart view version of above stock list: Chart View ➞ 0 - 25 , 25 - 50 , 50 - 75 , 75 - 100 , 100 - 125 , 125 - 150 , 150 - 175 , 175 - 200 , 200 - 225 , 225 - 250 , 250 - 275 , 275 - 300 | ||
 | Click To Change The Sort Order: By Market Cap or Company Size Performance: Year-to-date, Week and Day |  |
|
Get the most comprehensive stock market coverage daily at 12Stocks.com ➞ Best Stocks Today ➞ Best Stocks Weekly ➞ Best Stocks Year-to-Date ➞ Best Stocks Trends ➞  Best Stocks Today 12Stocks.com Best Nasdaq Stocks ➞ Best S&P 500 Stocks ➞ Best Tech Stocks ➞ Best Biotech Stocks ➞ |
| Detailed Overview of Industrial Stocks |
| Industrial Technical Overview, Leaders & Laggards, Top Industrial ETF Funds & Detailed Industrial Stocks List, Charts, Trends & More |
| Industrial Sector: Technical Analysis, Trends & YTD Performance | |
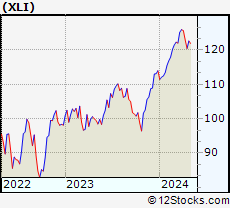
| Industrial sector is composed of stocks
from industrial machinery, aerospace, defense, farm/construction
and industrial services subsectors. Industrial sector, as represented by XLI, an exchange-traded fund [ETF] that holds basket of Industrial stocks (e.g, Caterpillar, Boeing) is up by 5.68% and is currently outperforming the overall market by 2.3% year-to-date. Below is a quick view of Technical charts and trends: |
|
 XLI Weekly Chart |
|
| Long Term Trend: Good | |
| Medium Term Trend: Not Good | |
 XLI Daily Chart |
|
| Short Term Trend: Not Good | |
| Overall Trend Score: 41 | |
| YTD Performance: 5.68% | |
| **Trend Scores & Views Are Only For Educational Purposes And Not For Investing | |
| 12Stocks.com: Top Performing Industrial Sector Stocks | ||||||||||||||||||||||||||||||||||||||||||||||||
 The top performing Industrial sector stocks year to date are
Now, more recently, over last week, the top performing Industrial sector stocks on the move are


|
||||||||||||||||||||||||||||||||||||||||||||||||
| 12Stocks.com: Investing in Industrial Sector using Exchange Traded Funds | |
|
The following table shows list of key exchange traded funds (ETF) that
help investors track Industrial Index. For detailed view, check out our ETF Funds section of our website. Quick View: Move mouse or cursor over ETF symbol (ticker) to view short-term Technical chart and over ETF name to view long term chart. Click on ticker or stock name for detailed view. Click on to add stock symbol to your watchlist and to view watchlist. |
12Stocks.com List of ETFs that track Industrial Index
| Ticker | ETF Name | Watchlist | Recent Price | Smart Investing & Trading Score | Change % | Week % | Year-to-date % |
| XLI | Industrial | | 120.47 | 41 | -0.18 | -1.98 | 5.68% |
| UXI | Industrials | | 31.55 | 36 | -0.35 | -4 | 9.57% |
| PPA | Aerospace & Defense | | 98.31 | 56 | 0.20 | -0.78 | 6.67% |
| ITA | Aerospace & Defense | | 128.00 | 51 | 0.42 | 0.22 | 1.11% |
| ITB | Home Construction | | 102.36 | 36 | -0.62 | -4.57 | 0.62% |
| XHB | Homebuilders | | 100.16 | 36 | -0.54 | -3.91 | 4.7% |
| SIJ | Short Industrials | | 10.23 | 54 | 0.03 | 4.25 | -9.76% |
| IYJ | Industrials | | 119.41 | 36 | 0.09 | -1.91 | 4.42% |
| EXI | Global Industrials | | 133.02 | 36 | -0.46 | -2.09 | 4.39% |
| VIS | Industrials | | 232.20 | 41 | -0.04 | -2.21 | 5.34% |
| PSCI | SmallCap Industrials | | 118.84 | 36 | 0.52 | -2 | 2.49% |
| XAR | Aerospace & Defense | | 132.23 | 36 | 0.10 | -1.13 | -2.36% |
| ARKQ | ARK Industrial Innovation | | 49.86 | 0 | -0.70 | -5.03 | -13.59% |
| 12Stocks.com: Charts, Trends, Fundamental Data and Performances of Industrial Stocks | |
|
We now take in-depth look at all Industrial stocks including charts, multi-period performances and overall trends (as measured by Smart Investing & Trading Score). One can sort Industrial stocks (click link to choose) by Daily, Weekly and by Year-to-Date performances. Also, one can sort by size of the company or by market capitalization. |
| Select Your Default Chart Type: | |||||
| |||||
| Click on stock symbol or name for detailed view. Click on to add stock symbol to your watchlist and to view watchlist. Quick View: Move mouse or cursor over "Daily" to quickly view daily Technical stock chart and over "Weekly" to view weekly Technical stock chart. | |||||

 | XYL Xylem Inc. |
| Sector: Industrials | |
| SubSector: Diversified Machinery | |
| MarketCap: 12195.1 Millions | |
| Recent Price: 127.84 Smart Investing & Trading Score: 68 | |
| Day Percent Change: 0.53% Day Change: 0.68 | |
| Week Change: -0.21% Year-to-date Change: 11.8% | |
| XYL Links: Profile News Message Board | |
| Charts:- Daily , Weekly | |
| Add XYL to Watchlist: View: Get Complete XYL Trend Analysis ➞ | |
 | EMR Emerson Electric Co. |
| Sector: Industrials | |
| SubSector: Industrial Electrical Equipment | |
| MarketCap: 30457.9 Millions | |
| Recent Price: 108.58 Smart Investing & Trading Score: 36 | |
| Day Percent Change: -0.67% Day Change: -0.73 | |
| Week Change: -3.61% Year-to-date Change: 11.6% | |
| EMR Links: Profile News Message Board | |
| Charts:- Daily , Weekly | |
| Add EMR to Watchlist: View: Get Complete EMR Trend Analysis ➞ | |
 | MTZ MasTec, Inc. |
| Sector: Industrials | |
| SubSector: Heavy Construction | |
| MarketCap: 2596.95 Millions | |
| Recent Price: 84.42 Smart Investing & Trading Score: 54 | |
| Day Percent Change: 1.17% Day Change: 0.98 | |
| Week Change: -4.02% Year-to-date Change: 11.5% | |
| MTZ Links: Profile News Message Board | |
| Charts:- Daily , Weekly | |
| Add MTZ to Watchlist: View: Get Complete MTZ Trend Analysis ➞ | |
 | ATI Allegheny Technologies Incorporated |
| Sector: Industrials | |
| SubSector: Metal Fabrication | |
| MarketCap: 913.35 Millions | |
| Recent Price: 50.56 Smart Investing & Trading Score: 43 | |
| Day Percent Change: -1.06% Day Change: -0.54 | |
| Week Change: -2.09% Year-to-date Change: 11.2% | |
| ATI Links: Profile News Message Board | |
| Charts:- Daily , Weekly | |
| Add ATI to Watchlist: View: Get Complete ATI Trend Analysis ➞ | |
 | GD General Dynamics Corporation |
| Sector: Industrials | |
| SubSector: Aerospace/Defense Products & Services | |
| MarketCap: 37063.8 Millions | |
| Recent Price: 288.62 Smart Investing & Trading Score: 83 | |
| Day Percent Change: 1.17% Day Change: 3.35 | |
| Week Change: 0.26% Year-to-date Change: 11.2% | |
| GD Links: Profile News Message Board | |
| Charts:- Daily , Weekly | |
| Add GD to Watchlist: View: Get Complete GD Trend Analysis ➞ | |
 | FLS Flowserve Corporation |
| Sector: Industrials | |
| SubSector: Diversified Machinery | |
| MarketCap: 2974.66 Millions | |
| Recent Price: 45.80 Smart Investing & Trading Score: 49 | |
| Day Percent Change: 0.37% Day Change: 0.17 | |
| Week Change: -1.84% Year-to-date Change: 11.1% | |
| FLS Links: Profile News Message Board | |
| Charts:- Daily , Weekly | |
| Add FLS to Watchlist: View: Get Complete FLS Trend Analysis ➞ | |
 | VMC Vulcan Materials Company |
| Sector: Industrials | |
| SubSector: General Building Materials | |
| MarketCap: 12304.7 Millions | |
| Recent Price: 252.06 Smart Investing & Trading Score: 26 | |
| Day Percent Change: -1.18% Day Change: -3.01 | |
| Week Change: -4.08% Year-to-date Change: 11.0% | |
| VMC Links: Profile News Message Board | |
| Charts:- Daily , Weekly | |
| Add VMC to Watchlist: View: Get Complete VMC Trend Analysis ➞ | |
 | CLH Clean Harbors, Inc. |
| Sector: Industrials | |
| SubSector: Waste Management | |
| MarketCap: 2391.28 Millions | |
| Recent Price: 193.71 Smart Investing & Trading Score: 56 | |
| Day Percent Change: 1.47% Day Change: 2.81 | |
| Week Change: -1.56% Year-to-date Change: 11.0% | |
| CLH Links: Profile News Message Board | |
| Charts:- Daily , Weekly | |
| Add CLH to Watchlist: View: Get Complete CLH Trend Analysis ➞ | |
 | MWA Mueller Water Products, Inc. |
| Sector: Industrials | |
| SubSector: Industrial Equipment & Components | |
| MarketCap: 1321.09 Millions | |
| Recent Price: 15.97 Smart Investing & Trading Score: 85 | |
| Day Percent Change: 0.50% Day Change: 0.08 | |
| Week Change: 5.27% Year-to-date Change: 10.9% | |
| MWA Links: Profile News Message Board | |
| Charts:- Daily , Weekly | |
| Add MWA to Watchlist: View: Get Complete MWA Trend Analysis ➞ | |
 | MLI Mueller Industries, Inc. |
| Sector: Industrials | |
| SubSector: Metal Fabrication | |
| MarketCap: 1259.5 Millions | |
| Recent Price: 52.28 Smart Investing & Trading Score: 54 | |
| Day Percent Change: -0.08% Day Change: -0.04 | |
| Week Change: 1.08% Year-to-date Change: 10.9% | |
| MLI Links: Profile News Message Board | |
| Charts:- Daily , Weekly | |
| Add MLI to Watchlist: View: Get Complete MLI Trend Analysis ➞ | |
 | WCN Waste Connections, Inc. |
| Sector: Industrials | |
| SubSector: Waste Management | |
| MarketCap: 23055.8 Millions | |
| Recent Price: 165.02 Smart Investing & Trading Score: 56 | |
| Day Percent Change: 0.40% Day Change: 0.66 | |
| Week Change: -1.26% Year-to-date Change: 10.6% | |
| WCN Links: Profile News Message Board | |
| Charts:- Daily , Weekly | |
| Add WCN to Watchlist: View: Get Complete WCN Trend Analysis ➞ | |
 | DOV Dover Corporation |
| Sector: Industrials | |
| SubSector: Diversified Machinery | |
| MarketCap: 10725.6 Millions | |
| Recent Price: 169.84 Smart Investing & Trading Score: 53 | |
| Day Percent Change: 0.73% Day Change: 1.23 | |
| Week Change: -1.29% Year-to-date Change: 10.4% | |
| DOV Links: Profile News Message Board | |
| Charts:- Daily , Weekly | |
| Add DOV to Watchlist: View: Get Complete DOV Trend Analysis ➞ | |
 | CRS Carpenter Technology Corporation |
| Sector: Industrials | |
| SubSector: Metal Fabrication | |
| MarketCap: 853.35 Millions | |
| Recent Price: 78.04 Smart Investing & Trading Score: 69 | |
| Day Percent Change: -1.69% Day Change: -1.34 | |
| Week Change: 0.7% Year-to-date Change: 10.2% | |
| CRS Links: Profile News Message Board | |
| Charts:- Daily , Weekly | |
| Add CRS to Watchlist: View: Get Complete CRS Trend Analysis ➞ | |
 | HEI HEICO Corporation |
| Sector: Industrials | |
| SubSector: Aerospace/Defense Products & Services | |
| MarketCap: 10023.1 Millions | |
| Recent Price: 197.10 Smart Investing & Trading Score: 81 | |
| Day Percent Change: 0.22% Day Change: 0.44 | |
| Week Change: 2.78% Year-to-date Change: 10.2% | |
| HEI Links: Profile News Message Board | |
| Charts:- Daily , Weekly | |
| Add HEI to Watchlist: View: Get Complete HEI Trend Analysis ➞ | |
 | DCI Donaldson Company, Inc. |
| Sector: Industrials | |
| SubSector: Diversified Machinery | |
| MarketCap: 4993.46 Millions | |
| Recent Price: 71.91 Smart Investing & Trading Score: 41 | |
| Day Percent Change: 0.36% Day Change: 0.26 | |
| Week Change: -2.12% Year-to-date Change: 10.0% | |
| DCI Links: Profile News Message Board | |
| Charts:- Daily , Weekly | |
| Add DCI to Watchlist: View: Get Complete DCI Trend Analysis ➞ | |
 | STRL Sterling Construction Company, Inc. |
| Sector: Industrials | |
| SubSector: Heavy Construction | |
| MarketCap: 237.395 Millions | |
| Recent Price: 96.56 Smart Investing & Trading Score: 36 | |
| Day Percent Change: -1.79% Day Change: -1.76 | |
| Week Change: -7.94% Year-to-date Change: 9.8% | |
| STRL Links: Profile News Message Board | |
| Charts:- Daily , Weekly | |
| Add STRL to Watchlist: View: Get Complete STRL Trend Analysis ➞ | |
 | NVR NVR, Inc. |
| Sector: Industrials | |
| SubSector: Residential Construction | |
| MarketCap: 9912.56 Millions | |
| Recent Price: 7685.00 Smart Investing & Trading Score: 49 | |
| Day Percent Change: -0.22% Day Change: -17.26 | |
| Week Change: -1.7% Year-to-date Change: 9.8% | |
| NVR Links: Profile News Message Board | |
| Charts:- Daily , Weekly | |
| Add NVR to Watchlist: View: Get Complete NVR Trend Analysis ➞ | |
 | MYRG MYR Group Inc. |
| Sector: Industrials | |
| SubSector: General Contractors | |
| MarketCap: 405.363 Millions | |
| Recent Price: 158.71 Smart Investing & Trading Score: 41 | |
| Day Percent Change: -0.08% Day Change: -0.12 | |
| Week Change: -6.29% Year-to-date Change: 9.7% | |
| MYRG Links: Profile News Message Board | |
| Charts:- Daily , Weekly | |
| Add MYRG to Watchlist: View: Get Complete MYRG Trend Analysis ➞ | |
 | LECO Lincoln Electric Holdings, Inc. |
| Sector: Industrials | |
| SubSector: Small Tools & Accessories | |
| MarketCap: 4085.06 Millions | |
| Recent Price: 238.36 Smart Investing & Trading Score: 51 | |
| Day Percent Change: -0.24% Day Change: -0.57 | |
| Week Change: -0.1% Year-to-date Change: 9.6% | |
| LECO Links: Profile News Message Board | |
| Charts:- Daily , Weekly | |
| Add LECO to Watchlist: View: Get Complete LECO Trend Analysis ➞ | |
 | CR Crane Co. |
| Sector: Industrials | |
| SubSector: Diversified Machinery | |
| MarketCap: 2715.16 Millions | |
| Recent Price: 129.48 Smart Investing & Trading Score: 41 | |
| Day Percent Change: 0.07% Day Change: 0.09 | |
| Week Change: -3.98% Year-to-date Change: 9.6% | |
| CR Links: Profile News Message Board | |
| Charts:- Daily , Weekly | |
| Add CR to Watchlist: View: Get Complete CR Trend Analysis ➞ | |
 | B Barnes Group Inc. |
| Sector: Industrials | |
| SubSector: Industrial Equipment & Components | |
| MarketCap: 2189.79 Millions | |
| Recent Price: 35.76 Smart Investing & Trading Score: 68 | |
| Day Percent Change: -0.89% Day Change: -0.32 | |
| Week Change: 1.88% Year-to-date Change: 9.6% | |
| B Links: Profile News Message Board | |
| Charts:- Daily , Weekly | |
| Add B to Watchlist: View: Get Complete B Trend Analysis ➞ | |
 | GMS GMS Inc. |
| Sector: Industrials | |
| SubSector: General Building Materials | |
| MarketCap: 587.753 Millions | |
| Recent Price: 90.25 Smart Investing & Trading Score: 36 | |
| Day Percent Change: 0.19% Day Change: 0.17 | |
| Week Change: -5.31% Year-to-date Change: 9.5% | |
| GMS Links: Profile News Message Board | |
| Charts:- Daily , Weekly | |
| Add GMS to Watchlist: View: Get Complete GMS Trend Analysis ➞ | |
 | LXFR Luxfer Holdings PLC |
| Sector: Industrials | |
| SubSector: Diversified Machinery | |
| MarketCap: 406.716 Millions | |
| Recent Price: 9.78 Smart Investing & Trading Score: 46 | |
| Day Percent Change: 4.15% Day Change: 0.39 | |
| Week Change: -3.65% Year-to-date Change: 9.4% | |
| LXFR Links: Profile News Message Board | |
| Charts:- Daily , Weekly | |
| Add LXFR to Watchlist: View: Get Complete LXFR Trend Analysis ➞ | |
 | CWST Casella Waste Systems, Inc. |
| Sector: Industrials | |
| SubSector: Waste Management | |
| MarketCap: 2093.38 Millions | |
| Recent Price: 93.43 Smart Investing & Trading Score: 53 | |
| Day Percent Change: 1.15% Day Change: 1.06 | |
| Week Change: -1.9% Year-to-date Change: 9.3% | |
| CWST Links: Profile News Message Board | |
| Charts:- Daily , Weekly | |
| Add CWST to Watchlist: View: Get Complete CWST Trend Analysis ➞ | |
 | TOL Toll Brothers, Inc. |
| Sector: Industrials | |
| SubSector: Residential Construction | |
| MarketCap: 2278.26 Millions | |
| Recent Price: 112.21 Smart Investing & Trading Score: 36 | |
| Day Percent Change: -0.84% Day Change: -0.95 | |
| Week Change: -6.66% Year-to-date Change: 9.2% | |
| TOL Links: Profile News Message Board | |
| Charts:- Daily , Weekly | |
| Add TOL to Watchlist: View: Get Complete TOL Trend Analysis ➞ | |
| For tabular summary view of above stock list: Summary View ➞ 0 - 25 , 25 - 50 , 50 - 75 , 75 - 100 , 100 - 125 , 125 - 150 , 150 - 175 , 175 - 200 , 200 - 225 , 225 - 250 , 250 - 275 , 275 - 300 | ||
| Click To Change The Sort Order: By Market Cap or Company Size Performance: Year-to-date, Week and Day | |
| Select Chart Type: | ||
|
Best Stocks Today 12Stocks.com |
© 2024 12Stocks.com Terms & Conditions Privacy Contact Us
All Information Provided Only For Education And Not To Be Used For Investing or Trading. See Terms & Conditions


One More Thing ... Get Best Stocks Delivered Daily!
Never Ever Miss A Move With Our Top Ten Stocks Lists
Find Best Stocks In Any Market - Bull or Bear Market
Take A Peek At Our Top Ten Stocks Lists: Daily, Weekly, Year-to-Date & Top Trends
Find Best Stocks In Any Market - Bull or Bear Market
Take A Peek At Our Top Ten Stocks Lists: Daily, Weekly, Year-to-Date & Top Trends
Industrial Stocks With Best Up Trends [0-bearish to 100-bullish]: Lockheed Martin[100], VCI Global[100], Argan [95], Generac [93], Himalaya Shipping[90], Caesarstone [90], AAR [90], Sturm Ruger[88], Target Hospitality[86], Mueller Water[85], Select Energy[83]
Best Industrial Stocks Year-to-Date:
Tritium DCFC[497.56%], Intuitive Machines[113.99%], Kaman [92.03%], FTAI Infrastructure[71.47%], Masonite [55.2%], EMCOR [52.55%], Caesarstone [52.14%], ADS-TEC Energy[51.47%], NuScale Power[50.39%], TDCX [47.97%], Graham [47.71%] Best Industrial Stocks This Week:
MingZhu Logistics[17.48%], NET Power[6.5%], Caesarstone [5.76%], AAR [5.48%], Mueller Water[5.27%], Kennametal [4.3%], Sun Country[4.28%], Seaboard [4.11%], Himalaya Shipping[4%], ADS-TEC Energy[3.85%], FTAI Infrastructure[3.73%] Best Industrial Stocks Daily:
MingZhu Logistics[10.31%], Ambipar Emergency[6.09%], Freightos [5.49%], Himalaya Shipping[4.68%], Caesarstone [4.60%], Luxfer [4.15%], Southland [4.10%], ESS Tech[4.03%], Ranpak [3.60%], Preformed Line[3.52%], Darling Ingredients[3.47%]