
 Login Sign Up


| |||||
 |  | ||||

| 12Stocks.com Market Intelligence |
Best Industrial Stocks
| In a hurry? Industrial Stocks Lists: Performance Trends Table, Stock Charts
Sort Industrial stocks: Daily, Weekly, Year-to-Date, Market Cap & Trends. Filter Industrial stocks list by size:All Industrial Large Mid-Range Small |
| 12Stocks.com Industrial Stocks Performances & Trends Daily | |||||||||
|
|  The overall Smart Investing & Trading Score is 30 (0-bearish to 100-bullish) which puts Industrial sector in short term bearish to neutral trend. The Smart Investing & Trading Score from previous trading session is 40 and hence a deterioration of trend.
| ||||||||
Here are the Smart Investing & Trading Scores of the most requested Industrial stocks at 12Stocks.com (click stock name for detailed review):
|


| 12Stocks.com: Investing in Industrial sector with Stocks | |
|
The following table helps investors and traders sort through current performance and trends (as measured by Smart Investing & Trading Score) of various
stocks in the Industrial sector. Quick View: Move mouse or cursor over stock symbol (ticker) to view short-term Technical chart and over stock name to view long term chart. Click on  to add stock symbol to your watchlist and to add stock symbol to your watchlist and  to view watchlist. Click on any ticker or stock name for detailed market intelligence report for that stock. to view watchlist. Click on any ticker or stock name for detailed market intelligence report for that stock. |
12Stocks.com Performance of Stocks in Industrial Sector
| Ticker | Stock Name | Watchlist | Category | Recent Price | Smart Investing & Trading Score | Change % | YTD Change% |
| BBCP | Concrete Pumping |   | Building Materials | 6.96 | 30 | 1.32% | 17.45% |
| BWXT | BWX Technologies | | Aerospace/Defense | 162.04 | 30 | 1.09% | 49.16% |
| MYRG | MYR | | Contractors | 187.27 | 30 | 0.85% | 23.02% |
| BDC | Belden | | Electrical Equipment | 130.20 | 30 | 0.65% | 10.38% |
| GLDD | Great Lakes | | Heavy Construction | 11.66 | 30 | 0.35% | 1.77% |
| EXP | Eagle Materials | | Cement | 230.90 | 30 | 0.27% | -7.85% |
| CLH | Clean Harbors | | Waste Mgmt | 242.21 | 30 | 0.24% | 6.27% |
| KMT | Kennametal | | Machine Tools | 21.43 | 30 | 0.19% | -10.89% |
| TWI | Titan | | Machinery | 8.82 | 30 | 0.12% | 25.63% |
| CNM | Core & Main | | Industrial Distribution | 64.72 | 30 | 0.02% | 25.67% |
| SPXC | SPX | | Machinery | 187.11 | 30 | 0.01% | 28.01% |
| MTW | Manitowoc | | Machinery | 9.90 | 30 | 0.00% | 2.30% |
| VMI | Valmont Industries | | Fabrication | 367.12 | 30 | -0.10% | 19.16% |
| CODI | Compass Diversified | | Conglomerates | 7.50 | 30 | -0.14% | -68.18% |
| PCT | PureCycle Technologies | | Pollution & Treatment Controls | 14.29 | 30 | -0.16% | 22.63% |
| GXO | GXO Logistics | | Integrated Freight & Logistics | 52.65 | 30 | -0.23% | 20.05% |
| TKR | Timken | | Machine Tools | 77.23 | 30 | -0.71% | 6.50% |
| AZZ | AZZ | | Machinery | 112.89 | 30 | -0.90% | 37.29% |
| AME | AMETEK | | Machinery | 182.78 | 30 | -1.10% | -0.62% |
| NPO | EnPro Industries | | Equipment | 218.77 | 30 | -1.20% | 27.91% |
| MEC | Mayville Engineering | | Fabrication | 14.60 | 30 | -1.21% | -11.39% |
| CMCO | Columbus McKinnon | | Machinery | 14.98 | 30 | -1.41% | -62.13% |
| DHR | Danaher | | Machinery | 200.85 | 30 | -1.44% | -9.55% |
| CCS | Century Communities | | Residential | 65.88 | 30 | -1.48% | -13.76% |
| MMM | 3M | | Machinery | 151.77 | 30 | -1.62% | 0.70% |
| For chart view version of above stock list: Chart View ➞ 0 - 25 , 25 - 50 , 50 - 75 , 75 - 100 , 100 - 125 , 125 - 150 , 150 - 175 , 175 - 200 , 200 - 225 , 225 - 250 , 250 - 275 , 275 - 300 | ||
 | Click To Change The Sort Order: By Market Cap or Company Size Performance: Year-to-date, Week and Day |  |
|
Get the most comprehensive stock market coverage daily at 12Stocks.com ➞ Best Stocks Today ➞ Best Stocks Weekly ➞ Best Stocks Year-to-Date ➞ Best Stocks Trends ➞  Best Stocks Today 12Stocks.com Best Nasdaq Stocks ➞ Best S&P 500 Stocks ➞ Best Tech Stocks ➞ Best Biotech Stocks ➞ |
| Detailed Overview of Industrial Stocks |
| Industrial Technical Overview, Leaders & Laggards, Top Industrial ETF Funds & Detailed Industrial Stocks List, Charts, Trends & More |
| Industrial Sector: Technical Analysis, Trends & YTD Performance | |
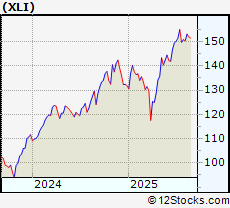
| Industrial sector is composed of stocks
from industrial machinery, aerospace, defense, farm/construction
and industrial services subsectors. Industrial sector, as represented by XLI, an exchange-traded fund [ETF] that holds basket of Industrial stocks (e.g, Caterpillar, Boeing) is up by 11.44% and is currently outperforming the overall market by 4.65% year-to-date. Below is a quick view of Technical charts and trends: |
|
 XLI Weekly Chart |
|
| Long Term Trend: Very Good | |
| Medium Term Trend: Very Good | |
 XLI Daily Chart |
|
| Short Term Trend: Not Good | |
| Overall Trend Score: 30 | |
| YTD Performance: 11.44% | |
| **Trend Scores & Views Are Only For Educational Purposes And Not For Investing | |
| 12Stocks.com: Top Performing Industrial Sector Stocks | ||||||||||||||||||||||||||||||||||||||||||||||||
 The top performing Industrial sector stocks year to date are
Now, more recently, over last week, the top performing Industrial sector stocks on the move are


|
||||||||||||||||||||||||||||||||||||||||||||||||
| 12Stocks.com: Investing in Industrial Sector using Exchange Traded Funds | |
|
The following table shows list of key exchange traded funds (ETF) that
help investors track Industrial Index. For detailed view, check out our ETF Funds section of our website. Quick View: Move mouse or cursor over ETF symbol (ticker) to view short-term Technical chart and over ETF name to view long term chart. Click on ticker or stock name for detailed view. Click on to add stock symbol to your watchlist and to view watchlist. |
12Stocks.com List of ETFs that track Industrial Index
| Ticker | ETF Name | Watchlist | Recent Price | Smart Investing & Trading Score | Change % | Week % | Year-to-date % |
| XLI | Industrial | | 152.01 | 30 | 1.7 | 1.86 | 11.44% |
| UXI | Industrials | | 45.12 | 20 | 3.19 | 3.54 | 16.37% |
| PPA | Aerospace & Defense | | 147.97 | 50 | 0.88 | 0.4 | 21.93% |
| ITA | Aerospace & Defense | | 198.42 | 50 | 0.53 | 0.47 | 25.5% |
| ITB | Home Construction | | 110.70 | 60 | 5.42 | 3.17 | 6.94% |
| XHB | Homebuilders | | 113.24 | 40 | 0.21 | -0.67 | 4.97% |
| SIJ | Short Industrials | | 11.97 | 70 | -3.12 | -3.42 | -20.76% |
| IYJ | Industrials | | 146.17 | 30 | -0.24 | -0.58 | 8.12% |
| EXI | Global Industrials | | 168.86 | 20 | -0.42 | -0.57 | 20.04% |
| VIS | Industrials | | 291.31 | 30 | -0.33 | -0.59 | 13.79% |
| PSCI | SmallCap Industrials | | 147.86 | 50 | -0.02 | -1.17 | 7.75% |
| XAR | Aerospace & Defense | | 217.44 | 40 | 0.62 | -1.47 | 28.91% |
| ARKQ | ARK Industrial Innovation | | 97.96 | 20 | 0.08 | -5.38 | 23.44% |
| 12Stocks.com: Charts, Trends, Fundamental Data and Performances of Industrial Stocks | |
|
We now take in-depth look at all Industrial stocks including charts, multi-period performances and overall trends (as measured by Smart Investing & Trading Score). One can sort Industrial stocks (click link to choose) by Daily, Weekly and by Year-to-Date performances. Also, one can sort by size of the company or by market capitalization. |
| Select Your Default Chart Type: | |||||
| |||||
| Click on stock symbol or name for detailed view. Click on to add stock symbol to your watchlist and to view watchlist. Quick View: Move mouse or cursor over "Daily" to quickly view daily Technical stock chart and over "Weekly" to view weekly Technical stock chart. | |||||

 | BBCP Concrete Pumping Holdings, Inc. |
| Sector: Industrials | |
| SubSector: General Building Materials | |
| MarketCap: 263.653 Millions | |
| Recent Price: 6.96 Smart Investing & Trading Score: 30 | |
| Day Percent Change: 1.32% Day Change: 0.09 | |
| Week Change: 1.02% Year-to-date Change: 17.5% | |
| BBCP Links: Profile News Message Board | |
| Charts:- Daily , Weekly | |
| Add BBCP to Watchlist: View: Get Complete BBCP Trend Analysis ➞ | |
 | BWXT BWX Technologies, Inc. |
| Sector: Industrials | |
| SubSector: Aerospace/Defense Products & Services | |
| MarketCap: 4085.41 Millions | |
| Recent Price: 162.04 Smart Investing & Trading Score: 30 | |
| Day Percent Change: 1.09% Day Change: 1.78 | |
| Week Change: -5.36% Year-to-date Change: 49.2% | |
| BWXT Links: Profile News Message Board | |
| Charts:- Daily , Weekly | |
| Add BWXT to Watchlist: View: Get Complete BWXT Trend Analysis ➞ | |
 | MYRG MYR Group Inc. |
| Sector: Industrials | |
| SubSector: General Contractors | |
| MarketCap: 405.363 Millions | |
| Recent Price: 187.27 Smart Investing & Trading Score: 30 | |
| Day Percent Change: 0.85% Day Change: 1.55 | |
| Week Change: 0.82% Year-to-date Change: 23.0% | |
| MYRG Links: Profile News Message Board | |
| Charts:- Daily , Weekly | |
| Add MYRG to Watchlist: View: Get Complete MYRG Trend Analysis ➞ | |
 | BDC Belden Inc. |
| Sector: Industrials | |
| SubSector: Industrial Electrical Equipment | |
| MarketCap: 1490.59 Millions | |
| Recent Price: 130.20 Smart Investing & Trading Score: 30 | |
| Day Percent Change: 0.65% Day Change: 0.8 | |
| Week Change: -1.12% Year-to-date Change: 10.4% | |
| BDC Links: Profile News Message Board | |
| Charts:- Daily , Weekly | |
| Add BDC to Watchlist: View: Get Complete BDC Trend Analysis ➞ | |
 | GLDD Great Lakes Dredge & Dock Corporation |
| Sector: Industrials | |
| SubSector: Heavy Construction | |
| MarketCap: 619.095 Millions | |
| Recent Price: 11.66 Smart Investing & Trading Score: 30 | |
| Day Percent Change: 0.35% Day Change: 0.04 | |
| Week Change: 1.06% Year-to-date Change: 1.8% | |
| GLDD Links: Profile News Message Board | |
| Charts:- Daily , Weekly | |
| Add GLDD to Watchlist: View: Get Complete GLDD Trend Analysis ➞ | |
 | EXP Eagle Materials Inc. |
| Sector: Industrials | |
| SubSector: Cement | |
| MarketCap: 2234.73 Millions | |
| Recent Price: 230.90 Smart Investing & Trading Score: 30 | |
| Day Percent Change: 0.27% Day Change: 0.61 | |
| Week Change: -3.41% Year-to-date Change: -7.9% | |
| EXP Links: Profile News Message Board | |
| Charts:- Daily , Weekly | |
| Add EXP to Watchlist: View: Get Complete EXP Trend Analysis ➞ | |
 | CLH Clean Harbors, Inc. |
| Sector: Industrials | |
| SubSector: Waste Management | |
| MarketCap: 2391.28 Millions | |
| Recent Price: 242.21 Smart Investing & Trading Score: 30 | |
| Day Percent Change: 0.24% Day Change: 0.58 | |
| Week Change: -1.01% Year-to-date Change: 6.3% | |
| CLH Links: Profile News Message Board | |
| Charts:- Daily , Weekly | |
| Add CLH to Watchlist: View: Get Complete CLH Trend Analysis ➞ | |
 | KMT Kennametal Inc. |
| Sector: Industrials | |
| SubSector: Machine Tools & Accessories | |
| MarketCap: 1486.48 Millions | |
| Recent Price: 21.43 Smart Investing & Trading Score: 30 | |
| Day Percent Change: 0.19% Day Change: 0.04 | |
| Week Change: -1.84% Year-to-date Change: -10.9% | |
| KMT Links: Profile News Message Board | |
| Charts:- Daily , Weekly | |
| Add KMT to Watchlist: View: Get Complete KMT Trend Analysis ➞ | |
 | TWI Titan International, Inc. |
| Sector: Industrials | |
| SubSector: Farm & Construction Machinery | |
| MarketCap: 104.607 Millions | |
| Recent Price: 8.82 Smart Investing & Trading Score: 30 | |
| Day Percent Change: 0.12% Day Change: 0.01 | |
| Week Change: -0.12% Year-to-date Change: 25.6% | |
| TWI Links: Profile News Message Board | |
| Charts:- Daily , Weekly | |
| Add TWI to Watchlist: View: Get Complete TWI Trend Analysis ➞ | |
 | CNM Core & Main, Inc. |
| Sector: Industrials | |
| SubSector: Industrial Distribution | |
| MarketCap: 7150 Millions | |
| Recent Price: 64.72 Smart Investing & Trading Score: 30 | |
| Day Percent Change: 0.02% Day Change: 0.01 | |
| Week Change: -0.82% Year-to-date Change: 25.7% | |
| CNM Links: Profile News Message Board | |
| Charts:- Daily , Weekly | |
| Add CNM to Watchlist: View: Get Complete CNM Trend Analysis ➞ | |
 | SPXC SPX Corporation |
| Sector: Industrials | |
| SubSector: Diversified Machinery | |
| MarketCap: 1415.56 Millions | |
| Recent Price: 187.11 Smart Investing & Trading Score: 30 | |
| Day Percent Change: 0.01% Day Change: 0.02 | |
| Week Change: -0.15% Year-to-date Change: 28.0% | |
| SPXC Links: Profile News Message Board | |
| Charts:- Daily , Weekly | |
| Add SPXC to Watchlist: View: Get Complete SPXC Trend Analysis ➞ | |
 | MTW The Manitowoc Company, Inc. |
| Sector: Industrials | |
| SubSector: Farm & Construction Machinery | |
| MarketCap: 373.707 Millions | |
| Recent Price: 9.90 Smart Investing & Trading Score: 30 | |
| Day Percent Change: 0% Day Change: 0 | |
| Week Change: -0.53% Year-to-date Change: 2.3% | |
| MTW Links: Profile News Message Board | |
| Charts:- Daily , Weekly | |
| Add MTW to Watchlist: View: Get Complete MTW Trend Analysis ➞ | |
 | VMI Valmont Industries, Inc. |
| Sector: Industrials | |
| SubSector: Metal Fabrication | |
| MarketCap: 2251.6 Millions | |
| Recent Price: 367.12 Smart Investing & Trading Score: 30 | |
| Day Percent Change: -0.1% Day Change: -0.36 | |
| Week Change: -3.32% Year-to-date Change: 19.2% | |
| VMI Links: Profile News Message Board | |
| Charts:- Daily , Weekly | |
| Add VMI to Watchlist: View: Get Complete VMI Trend Analysis ➞ | |
 | CODI Compass Diversified Holdings LLC |
| Sector: Industrials | |
| SubSector: Conglomerates | |
| MarketCap: 803.348 Millions | |
| Recent Price: 7.50 Smart Investing & Trading Score: 30 | |
| Day Percent Change: -0.14% Day Change: -0.01 | |
| Week Change: -4.03% Year-to-date Change: -68.2% | |
| CODI Links: Profile News Message Board | |
| Charts:- Daily , Weekly | |
| Add CODI to Watchlist: View: Get Complete CODI Trend Analysis ➞ | |
 | PCT PureCycle Technologies, Inc. |
| Sector: Industrials | |
| SubSector: Pollution & Treatment Controls | |
| MarketCap: 1610 Millions | |
| Recent Price: 14.29 Smart Investing & Trading Score: 30 | |
| Day Percent Change: -0.16% Day Change: -0.02 | |
| Week Change: -5.84% Year-to-date Change: 22.6% | |
| PCT Links: Profile News Message Board | |
| Charts:- Daily , Weekly | |
| Add PCT to Watchlist: View: Get Complete PCT Trend Analysis ➞ | |
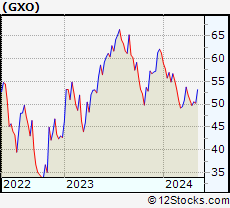 | GXO GXO Logistics, Inc. |
| Sector: Industrials | |
| SubSector: Integrated Freight & Logistics | |
| MarketCap: 7340 Millions | |
| Recent Price: 52.65 Smart Investing & Trading Score: 30 | |
| Day Percent Change: -0.23% Day Change: -0.12 | |
| Week Change: -2.63% Year-to-date Change: 20.1% | |
| GXO Links: Profile News Message Board | |
| Charts:- Daily , Weekly | |
| Add GXO to Watchlist: View: Get Complete GXO Trend Analysis ➞ | |
 | TKR The Timken Company |
| Sector: Industrials | |
| SubSector: Machine Tools & Accessories | |
| MarketCap: 2277.48 Millions | |
| Recent Price: 77.23 Smart Investing & Trading Score: 30 | |
| Day Percent Change: -0.71% Day Change: -0.54 | |
| Week Change: -2.28% Year-to-date Change: 6.5% | |
| TKR Links: Profile News Message Board | |
| Charts:- Daily , Weekly | |
| Add TKR to Watchlist: View: Get Complete TKR Trend Analysis ➞ | |
 | AZZ AZZ Inc. |
| Sector: Industrials | |
| SubSector: Diversified Machinery | |
| MarketCap: 743.416 Millions | |
| Recent Price: 112.89 Smart Investing & Trading Score: 30 | |
| Day Percent Change: -0.9% Day Change: -1.02 | |
| Week Change: -0.97% Year-to-date Change: 37.3% | |
| AZZ Links: Profile News Message Board | |
| Charts:- Daily , Weekly | |
| Add AZZ to Watchlist: View: Get Complete AZZ Trend Analysis ➞ | |
 | AME AMETEK, Inc. |
| Sector: Industrials | |
| SubSector: Diversified Machinery | |
| MarketCap: 16611.8 Millions | |
| Recent Price: 182.78 Smart Investing & Trading Score: 30 | |
| Day Percent Change: -1.1% Day Change: -2.03 | |
| Week Change: -1.09% Year-to-date Change: -0.6% | |
| AME Links: Profile News Message Board | |
| Charts:- Daily , Weekly | |
| Add AME to Watchlist: View: Get Complete AME Trend Analysis ➞ | |
 | NPO EnPro Industries, Inc. |
| Sector: Industrials | |
| SubSector: Industrial Equipment & Components | |
| MarketCap: 734.309 Millions | |
| Recent Price: 218.77 Smart Investing & Trading Score: 30 | |
| Day Percent Change: -1.2% Day Change: -2.66 | |
| Week Change: -2.1% Year-to-date Change: 27.9% | |
| NPO Links: Profile News Message Board | |
| Charts:- Daily , Weekly | |
| Add NPO to Watchlist: View: Get Complete NPO Trend Analysis ➞ | |
 | MEC Mayville Engineering Company, Inc. |
| Sector: Industrials | |
| SubSector: Metal Fabrication | |
| MarketCap: 143.55 Millions | |
| Recent Price: 14.60 Smart Investing & Trading Score: 30 | |
| Day Percent Change: -1.21% Day Change: -0.17 | |
| Week Change: -3.73% Year-to-date Change: -11.4% | |
| MEC Links: Profile News Message Board | |
| Charts:- Daily , Weekly | |
| Add MEC to Watchlist: View: Get Complete MEC Trend Analysis ➞ | |
 | CMCO Columbus McKinnon Corporation |
| Sector: Industrials | |
| SubSector: Farm & Construction Machinery | |
| MarketCap: 598.807 Millions | |
| Recent Price: 14.98 Smart Investing & Trading Score: 30 | |
| Day Percent Change: -1.41% Day Change: -0.2 | |
| Week Change: -5.04% Year-to-date Change: -62.1% | |
| CMCO Links: Profile News Message Board | |
| Charts:- Daily , Weekly | |
| Add CMCO to Watchlist: View: Get Complete CMCO Trend Analysis ➞ | |
 | DHR Danaher Corporation |
| Sector: Industrials | |
| SubSector: Diversified Machinery | |
| MarketCap: 93210.3 Millions | |
| Recent Price: 200.85 Smart Investing & Trading Score: 30 | |
| Day Percent Change: -1.44% Day Change: -2.94 | |
| Week Change: -2.41% Year-to-date Change: -9.6% | |
| DHR Links: Profile News Message Board | |
| Charts:- Daily , Weekly | |
| Add DHR to Watchlist: View: Get Complete DHR Trend Analysis ➞ | |
 | CCS Century Communities, Inc. |
| Sector: Industrials | |
| SubSector: Residential Construction | |
| MarketCap: 459.206 Millions | |
| Recent Price: 65.88 Smart Investing & Trading Score: 30 | |
| Day Percent Change: -1.48% Day Change: -0.94 | |
| Week Change: -4.07% Year-to-date Change: -13.8% | |
| CCS Links: Profile News Message Board | |
| Charts:- Daily , Weekly | |
| Add CCS to Watchlist: View: Get Complete CCS Trend Analysis ➞ | |
 | MMM 3M Company |
| Sector: Industrials | |
| SubSector: Diversified Machinery | |
| MarketCap: 79237.7 Millions | |
| Recent Price: 151.77 Smart Investing & Trading Score: 30 | |
| Day Percent Change: -1.62% Day Change: -2.5 | |
| Week Change: -2.42% Year-to-date Change: 0.7% | |
| MMM Links: Profile News Message Board | |
| Charts:- Daily , Weekly | |
| Add MMM to Watchlist: View: Get Complete MMM Trend Analysis ➞ | |
| For tabular summary view of above stock list: Summary View ➞ 0 - 25 , 25 - 50 , 50 - 75 , 75 - 100 , 100 - 125 , 125 - 150 , 150 - 175 , 175 - 200 , 200 - 225 , 225 - 250 , 250 - 275 , 275 - 300 | ||
| Click To Change The Sort Order: By Market Cap or Company Size Performance: Year-to-date, Week and Day | |
| Select Chart Type: | ||
|
Best Stocks Today 12Stocks.com |
© 2025 12Stocks.com Terms & Conditions Privacy Contact Us
All Information Provided Only For Education And Not To Be Used For Investing or Trading. See Terms & Conditions


One More Thing ... Get Best Stocks Delivered Daily!
Never Ever Miss A Move With Our Top Ten Stocks Lists
Find Best Stocks In Any Market - Bull or Bear Market
Take A Peek At Our Top Ten Stocks Lists: Daily, Weekly, Year-to-Date & Top Trends
Find Best Stocks In Any Market - Bull or Bear Market
Take A Peek At Our Top Ten Stocks Lists: Daily, Weekly, Year-to-Date & Top Trends
Industrial Stocks With Best Up Trends [0-bearish to 100-bullish]: Kanzhun [100], Xometry [100], Cementos Pacasmayo[100], Barnes [100], Hexcel [100], National Energy[100], Montrose Environmental[100], Seaboard [100], CEMEX S.A.B.[100], REX American[100], Eos Energy[100]
Best Industrial Stocks Year-to-Date:
LanzaTech Global[1484.67%], China Yuchai[231.9%], Amprius Technologies[142.5%], Tutor Perini[135.62%], Solid Power[128.57%], Astronics [123.06%], Evolv Technologies[98.23%], American Superconductor[97.28%], NuScale Power[86.78%], Symbotic [85.15%], Elbit Systems[78.5%] Best Industrial Stocks This Week:
LanzaTech Global[5701.71%], Twin Disc[25.39%], National Energy[23.8%], System1 [11.61%], Target Hospitality[10.9%], Kanzhun [10.41%], China Yuchai[8.53%], Astronics [8.27%], Barnes [8.09%], BiomX [7.55%], Cool [6.45%] Best Industrial Stocks Daily:
Twin Disc[30.05%], Bioceres Crop[8.89%], Novonix [7.08%], Kanzhun [6.61%], James Hardie[6.12%], Satellogic [5.65%], Solid Power[4.85%], System1 [4.83%], Xometry [4.58%], BiomX [4.06%], Astronics [3.46%]