
 Login Sign Up


| |||||
 |  | ||||

| 12Stocks.com Market Intelligence |
Best Healthcare Stocks
 | "Discover best trending healthcare stocks with 12Stocks.com." |
| - Subu Vdaygiri, Founder, 12Stocks.com |
| In a hurry? Healthcare Stocks Lists: Performance Trends Table, Stock Charts
Sort Healthcare stocks: Daily, Weekly, Year-to-Date, Market Cap & Trends. Filter Healthcare stocks list by size:All Healthcare Large Mid-Range Small |
| 12Stocks.com Healthcare Stocks Performances & Trends Daily | |||||||||
|
|  The overall Smart Investing & Trading Score is 0 (0-bearish to 100-bullish) which puts Healthcare sector in short term bearish trend. The Smart Investing & Trading Score from previous trading session is 25 and hence a deterioration of trend.
| ||||||||
Here are the Smart Investing & Trading Scores of the most requested Healthcare stocks at 12Stocks.com (click stock name for detailed review):
|


| 12Stocks.com: Investing in Healthcare sector with Stocks | |
|
The following table helps investors and traders sort through current performance and trends (as measured by Smart Investing & Trading Score) of various
stocks in the Healthcare sector. Quick View: Move mouse or cursor over stock symbol (ticker) to view short-term Technical chart and over stock name to view long term chart. Click on  to add stock symbol to your watchlist and to add stock symbol to your watchlist and  to view watchlist. Click on any ticker or stock name for detailed market intelligence report for that stock. to view watchlist. Click on any ticker or stock name for detailed market intelligence report for that stock. |
12Stocks.com Performance of Stocks in Healthcare Sector
| Ticker | Stock Name | Watchlist | Category | Recent Price | Smart Investing & Trading Score | Change % | Weekly Change% |
| ZURA | Zura Bio |   | Biotechnology | 1.96 | 100 | 51.94% | 49.62% |
| GBIO | Generation Bio | | Biotechnology | 0.52 | 100 | -7.72% | 34.94% |
| TNYA | Tenaya | | Biotechnology | 0.87 | 100 | 20.17% | 26.77% |
| IOVA | Iovance Bio | | Biotechnology | 2.34 | 74 | 4.93% | 25.13% |
| LXRX | Lexicon | | Biotechnology | 1.35 | 100 | 4.65% | 25.00% |
| CVRX | CVRx | | Medical Devices | 8.35 | 100 | -1.18% | 22.25% |
| IMNM | Immunome | | Biotechnology | 10.45 | 100 | 8.07% | 20.95% |
| RAPT | RAPT | | Biotechnology | 10.23 | 83 | -2.76% | 20.92% |
| SRPT | Sarepta | | Biotechnology | 21.97 | 74 | 19.53% | 20.91% |
| VTYX | Ventyx Biosciences | | Biotechnology | 3.27 | 100 | 4.47% | 19.34% |
| AIRS | AirSculpt Technologies | | Medical Care Facilities | 5.93 | 100 | 9.81% | 19.08% |
| OVID | Ovid | | Biotechnology | 0.48 | 100 | 22.90% | 18.35% |
| CMPX | Compass | | Biotechnology | 3.15 | 100 | 0.64% | 16.67% |
| TNGX | Tango | | Biotechnology | 6.86 | 95 | 8.03% | 15.68% |
| GALT | Galectin | | Biotechnology | 2.89 | 88 | 1.40% | 15.14% |
| KOD | Kodiak Sciences | | Biotechnology | 5.19 | 80 | 9.61% | 14.57% |
| SRRK | Scholar Rock | | Biotechnology | 42.86 | 100 | 4.16% | 14.48% |
| GLUE | Monte Rosa | | Biotechnology | 5.90 | 100 | 5.17% | 14.34% |
| TERN | Terns | | Biotechnology | 5.60 | 100 | 6.26% | 14.29% |
| REPL | Replimune | | Biotechnology | 12.50 | 95 | -1.03% | 13.95% |
| APLT | Applied | | Biotechnology | 0.47 | 90 | 7.36% | 13.53% |
| GLSI | Greenwich LifeSciences | | Biotechnology | 12.30 | 100 | 9.92% | 13.47% |
| LGND | Ligand | | Biotechnology | 137.57 | 100 | 6.13% | 13.04% |
| FHTX | Foghorn | | Biotechnology | 6.10 | 100 | 3.74% | 12.96% |
| RCKT | Rocket | | Biotechnology | 3.34 | 74 | 16.78% | 12.84% |
| For chart view version of above stock list: Chart View ➞ 0 - 25 , 25 - 50 , 50 - 75 , 75 - 100 , 100 - 125 , 125 - 150 , 150 - 175 , 175 - 200 , 200 - 225 , 225 - 250 , 250 - 275 , 275 - 300 , 300 - 325 , 325 - 350 , 350 - 375 , 375 - 400 , 400 - 425 | ||
 | Click To Change The Sort Order: By Market Cap or Company Size Performance: Year-to-date, Week and Day |  |
|
Get the most comprehensive stock market coverage daily at 12Stocks.com ➞ Best Stocks Today ➞ Best Stocks Weekly ➞ Best Stocks Year-to-Date ➞ Best Stocks Trends ➞  Best Stocks Today 12Stocks.com Best Nasdaq Stocks ➞ Best S&P 500 Stocks ➞ Best Tech Stocks ➞ Best Biotech Stocks ➞ |
| Detailed Overview of Healthcare Stocks |
| Healthcare Technical Overview, Leaders & Laggards, Top Healthcare ETF Funds & Detailed Healthcare Stocks List, Charts, Trends & More |
| Healthcare Sector: Technical Analysis, Trends & YTD Performance | |
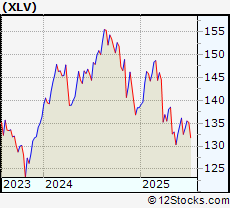
| Healthcare sector is composed of stocks
from pharmaceutical, biotech, diagnostics labs, insurance providers
and healthcare services. Healthcare sector, as represented by XLV, an exchange-traded fund [ETF] that holds basket of Healthcare stocks (e.g, Merck, Amgen) is down by -3.15% and is currently underperforming the overall market by -10.24% year-to-date. Below is a quick view of Technical charts and trends: |
|
 XLV Weekly Chart |
|
| Long Term Trend: Not Good | |
| Medium Term Trend: Not Good | |
 XLV Daily Chart |
|
| Short Term Trend: Not Good | |
| Overall Trend Score: 0 | |
| YTD Performance: -3.15% | |
| **Trend Scores & Views Are Only For Educational Purposes And Not For Investing | |
| 12Stocks.com: Top Performing Healthcare Sector Stocks | ||||||||||||||||||||||||||||||||||||||||||||||||
 The top performing Healthcare sector stocks year to date are
Now, more recently, over last week, the top performing Healthcare sector stocks on the move are


|
||||||||||||||||||||||||||||||||||||||||||||||||
| 12Stocks.com: Investing in Healthcare Sector using Exchange Traded Funds | |
|
The following table shows list of key exchange traded funds (ETF) that
help investors track Healthcare Index. For detailed view, check out our ETF Funds section of our website. Quick View: Move mouse or cursor over ETF symbol (ticker) to view short-term Technical chart and over ETF name to view long term chart. Click on ticker or stock name for detailed view. Click on to add stock symbol to your watchlist and to view watchlist. |
12Stocks.com List of ETFs that track Healthcare Index
| Ticker | ETF Name | Watchlist | Recent Price | Smart Investing & Trading Score | Change % | Week % | Year-to-date % |
| XLV | Health Care | | 132.72 | 0 | -1.14 | -1.83 | -3.15% |
| IBB | Biotechnology | | 131.74 | 83 | 0.43 | 0.11 | -0.27% |
| BBH | Biotech | | 157.93 | 78 | 0.03 | -0.19 | 0.61% |
| IHF | Healthcare Providers | | 43.63 | 0 | -1.98 | -3.52 | -8.9% |
| BIB | Biotechnology | | 50.64 | 88 | 0.43 | 1.84 | 0.2% |
| BIS | Short Biotech | | 15.86 | 18 | -0.61 | -2.27 | -12.13% |
| CURE | Healthcare Bull 3X | | 74.62 | 0 | -3.4 | -5.54 | -18.89% |
| RXL | Health Care | | 39.23 | 10 | -2.2 | -3.64 | -10.58% |
| RXD | Short Health Care | | 12.55 | 100 | 2.5 | 3.85 | 6.11% |
| 12Stocks.com: Charts, Trends, Fundamental Data and Performances of Healthcare Stocks | |
|
We now take in-depth look at all Healthcare stocks including charts, multi-period performances and overall trends (as measured by Smart Investing & Trading Score). One can sort Healthcare stocks (click link to choose) by Daily, Weekly and by Year-to-Date performances. Also, one can sort by size of the company or by market capitalization. |
| Select Your Default Chart Type: | |||||
| |||||
| Click on stock symbol or name for detailed view. Click on to add stock symbol to your watchlist and to view watchlist. Quick View: Move mouse or cursor over "Daily" to quickly view daily Technical stock chart and over "Weekly" to view weekly Technical stock chart. | |||||

 | ZURA Zura Bio Limited |
| Sector: Health Care | |
| SubSector: Biotechnology | |
| MarketCap: 242 Millions | |
| Recent Price: 1.96 Smart Investing & Trading Score: 100 | |
| Day Percent Change: 51.94% Day Change: 0.67 | |
| Week Change: 49.62% Year-to-date Change: -21.6% | |
| ZURA Links: Profile News Message Board | |
| Charts:- Daily , Weekly | |
| Add ZURA to Watchlist: View: Get Complete ZURA Trend Analysis ➞ | |
 | GBIO Generation Bio Co. |
| Sector: Health Care | |
| SubSector: Biotechnology | |
| MarketCap: 17487 Millions | |
| Recent Price: 0.52 Smart Investing & Trading Score: 100 | |
| Day Percent Change: -7.72% Day Change: -0.04 | |
| Week Change: 34.94% Year-to-date Change: -50.8% | |
| GBIO Links: Profile News Message Board | |
| Charts:- Daily , Weekly | |
| Add GBIO to Watchlist: View: Get Complete GBIO Trend Analysis ➞ | |
 | TNYA Tenaya Therapeutics, Inc. |
| Sector: Health Care | |
| SubSector: Biotechnology | |
| MarketCap: 395 Millions | |
| Recent Price: 0.87 Smart Investing & Trading Score: 100 | |
| Day Percent Change: 20.17% Day Change: 0.15 | |
| Week Change: 26.77% Year-to-date Change: -39.4% | |
| TNYA Links: Profile News Message Board | |
| Charts:- Daily , Weekly | |
| Add TNYA to Watchlist: View: Get Complete TNYA Trend Analysis ➞ | |
 | IOVA Iovance Biotherapeutics, Inc. |
| Sector: Health Care | |
| SubSector: Biotechnology | |
| MarketCap: 3533.35 Millions | |
| Recent Price: 2.34 Smart Investing & Trading Score: 74 | |
| Day Percent Change: 4.93% Day Change: 0.11 | |
| Week Change: 25.13% Year-to-date Change: -68.4% | |
| IOVA Links: Profile News Message Board | |
| Charts:- Daily , Weekly | |
| Add IOVA to Watchlist: View: Get Complete IOVA Trend Analysis ➞ | |
 | LXRX Lexicon Pharmaceuticals, Inc. |
| Sector: Health Care | |
| SubSector: Biotechnology | |
| MarketCap: 251.185 Millions | |
| Recent Price: 1.35 Smart Investing & Trading Score: 100 | |
| Day Percent Change: 4.65% Day Change: 0.06 | |
| Week Change: 25% Year-to-date Change: 82.8% | |
| LXRX Links: Profile News Message Board | |
| Charts:- Daily , Weekly | |
| Add LXRX to Watchlist: View: Get Complete LXRX Trend Analysis ➞ | |
 | CVRX CVRx, Inc. |
| Sector: Health Care | |
| SubSector: Medical Devices | |
| MarketCap: 327 Millions | |
| Recent Price: 8.35 Smart Investing & Trading Score: 100 | |
| Day Percent Change: -1.18% Day Change: -0.1 | |
| Week Change: 22.25% Year-to-date Change: -34.1% | |
| CVRX Links: Profile News Message Board | |
| Charts:- Daily , Weekly | |
| Add CVRX to Watchlist: View: Get Complete CVRX Trend Analysis ➞ | |
 | IMNM Immunome, Inc. |
| Sector: Health Care | |
| SubSector: Biotechnology | |
| MarketCap: 12487 Millions | |
| Recent Price: 10.45 Smart Investing & Trading Score: 100 | |
| Day Percent Change: 8.07% Day Change: 0.78 | |
| Week Change: 20.95% Year-to-date Change: -1.6% | |
| IMNM Links: Profile News Message Board | |
| Charts:- Daily , Weekly | |
| Add IMNM to Watchlist: View: Get Complete IMNM Trend Analysis ➞ | |
 | RAPT RAPT Therapeutics, Inc. |
| Sector: Health Care | |
| SubSector: Biotechnology | |
| MarketCap: 368.785 Millions | |
| Recent Price: 10.23 Smart Investing & Trading Score: 83 | |
| Day Percent Change: -2.76% Day Change: -0.29 | |
| Week Change: 20.92% Year-to-date Change: 547.5% | |
| RAPT Links: Profile News Message Board | |
| Charts:- Daily , Weekly | |
| Add RAPT to Watchlist: View: Get Complete RAPT Trend Analysis ➞ | |
 | SRPT Sarepta Therapeutics, Inc. |
| Sector: Health Care | |
| SubSector: Biotechnology | |
| MarketCap: 7388.05 Millions | |
| Recent Price: 21.97 Smart Investing & Trading Score: 74 | |
| Day Percent Change: 19.53% Day Change: 3.59 | |
| Week Change: 20.91% Year-to-date Change: -81.9% | |
| SRPT Links: Profile News Message Board | |
| Charts:- Daily , Weekly | |
| Add SRPT to Watchlist: View: Get Complete SRPT Trend Analysis ➞ | |
 | VTYX Ventyx Biosciences, Inc. |
| Sector: Health Care | |
| SubSector: Biotechnology | |
| MarketCap: 1950 Millions | |
| Recent Price: 3.27 Smart Investing & Trading Score: 100 | |
| Day Percent Change: 4.47% Day Change: 0.14 | |
| Week Change: 19.34% Year-to-date Change: 49.3% | |
| VTYX Links: Profile News Message Board | |
| Charts:- Daily , Weekly | |
| Add VTYX to Watchlist: View: Get Complete VTYX Trend Analysis ➞ | |
 | AIRS AirSculpt Technologies, Inc. |
| Sector: Health Care | |
| SubSector: Medical Care Facilities | |
| MarketCap: 497 Millions | |
| Recent Price: 5.93 Smart Investing & Trading Score: 100 | |
| Day Percent Change: 9.81% Day Change: 0.53 | |
| Week Change: 19.08% Year-to-date Change: 14.3% | |
| AIRS Links: Profile News Message Board | |
| Charts:- Daily , Weekly | |
| Add AIRS to Watchlist: View: Get Complete AIRS Trend Analysis ➞ | |
 | OVID Ovid Therapeutics Inc. |
| Sector: Health Care | |
| SubSector: Biotechnology | |
| MarketCap: 130.385 Millions | |
| Recent Price: 0.48 Smart Investing & Trading Score: 100 | |
| Day Percent Change: 22.9% Day Change: 0.09 | |
| Week Change: 18.35% Year-to-date Change: -48.7% | |
| OVID Links: Profile News Message Board | |
| Charts:- Daily , Weekly | |
| Add OVID to Watchlist: View: Get Complete OVID Trend Analysis ➞ | |
 | CMPX Compass Therapeutics, Inc. |
| Sector: Health Care | |
| SubSector: Biotechnology | |
| MarketCap: 406 Millions | |
| Recent Price: 3.15 Smart Investing & Trading Score: 100 | |
| Day Percent Change: 0.64% Day Change: 0.02 | |
| Week Change: 16.67% Year-to-date Change: 117.2% | |
| CMPX Links: Profile News Message Board | |
| Charts:- Daily , Weekly | |
| Add CMPX to Watchlist: View: Get Complete CMPX Trend Analysis ➞ | |
 | TNGX Tango Therapeutics, Inc. |
| Sector: Health Care | |
| SubSector: Biotechnology | |
| MarketCap: 302 Millions | |
| Recent Price: 6.86 Smart Investing & Trading Score: 95 | |
| Day Percent Change: 8.03% Day Change: 0.51 | |
| Week Change: 15.68% Year-to-date Change: 122.0% | |
| TNGX Links: Profile News Message Board | |
| Charts:- Daily , Weekly | |
| Add TNGX to Watchlist: View: Get Complete TNGX Trend Analysis ➞ | |
 | GALT Galectin Therapeutics, Inc. |
| Sector: Health Care | |
| SubSector: Biotechnology | |
| MarketCap: 114.185 Millions | |
| Recent Price: 2.89 Smart Investing & Trading Score: 88 | |
| Day Percent Change: 1.4% Day Change: 0.04 | |
| Week Change: 15.14% Year-to-date Change: 124.0% | |
| GALT Links: Profile News Message Board | |
| Charts:- Daily , Weekly | |
| Add GALT to Watchlist: View: Get Complete GALT Trend Analysis ➞ | |
 | KOD Kodiak Sciences Inc. |
| Sector: Health Care | |
| SubSector: Biotechnology | |
| MarketCap: 2132.15 Millions | |
| Recent Price: 5.19 Smart Investing & Trading Score: 80 | |
| Day Percent Change: 9.61% Day Change: 0.46 | |
| Week Change: 14.57% Year-to-date Change: -47.8% | |
| KOD Links: Profile News Message Board | |
| Charts:- Daily , Weekly | |
| Add KOD to Watchlist: View: Get Complete KOD Trend Analysis ➞ | |
 | SRRK Scholar Rock Holding Corporation |
| Sector: Health Care | |
| SubSector: Biotechnology | |
| MarketCap: 441.385 Millions | |
| Recent Price: 42.86 Smart Investing & Trading Score: 100 | |
| Day Percent Change: 4.16% Day Change: 1.71 | |
| Week Change: 14.48% Year-to-date Change: -0.8% | |
| SRRK Links: Profile News Message Board | |
| Charts:- Daily , Weekly | |
| Add SRRK to Watchlist: View: Get Complete SRRK Trend Analysis ➞ | |
 | GLUE Monte Rosa Therapeutics, Inc. |
| Sector: Health Care | |
| SubSector: Biotechnology | |
| MarketCap: 346 Millions | |
| Recent Price: 5.90 Smart Investing & Trading Score: 100 | |
| Day Percent Change: 5.17% Day Change: 0.29 | |
| Week Change: 14.34% Year-to-date Change: -15.0% | |
| GLUE Links: Profile News Message Board | |
| Charts:- Daily , Weekly | |
| Add GLUE to Watchlist: View: Get Complete GLUE Trend Analysis ➞ | |
 | TERN Terns Pharmaceuticals, Inc. |
| Sector: Health Care | |
| SubSector: Biotechnology | |
| MarketCap: 611 Millions | |
| Recent Price: 5.60 Smart Investing & Trading Score: 100 | |
| Day Percent Change: 6.26% Day Change: 0.33 | |
| Week Change: 14.29% Year-to-date Change: 1.1% | |
| TERN Links: Profile News Message Board | |
| Charts:- Daily , Weekly | |
| Add TERN to Watchlist: View: Get Complete TERN Trend Analysis ➞ | |
 | REPL Replimune Group, Inc. |
| Sector: Health Care | |
| SubSector: Biotechnology | |
| MarketCap: 367.885 Millions | |
| Recent Price: 12.50 Smart Investing & Trading Score: 95 | |
| Day Percent Change: -1.03% Day Change: -0.13 | |
| Week Change: 13.95% Year-to-date Change: 3.2% | |
| REPL Links: Profile News Message Board | |
| Charts:- Daily , Weekly | |
| Add REPL to Watchlist: View: Get Complete REPL Trend Analysis ➞ | |
 | APLT Applied Therapeutics, Inc. |
| Sector: Health Care | |
| SubSector: Biotechnology | |
| MarketCap: 641.285 Millions | |
| Recent Price: 0.47 Smart Investing & Trading Score: 90 | |
| Day Percent Change: 7.36% Day Change: 0.03 | |
| Week Change: 13.53% Year-to-date Change: -45.1% | |
| APLT Links: Profile News Message Board | |
| Charts:- Daily , Weekly | |
| Add APLT to Watchlist: View: Get Complete APLT Trend Analysis ➞ | |
 | GLSI Greenwich LifeSciences, Inc. |
| Sector: Health Care | |
| SubSector: Biotechnology | |
| MarketCap: 86487 Millions | |
| Recent Price: 12.30 Smart Investing & Trading Score: 100 | |
| Day Percent Change: 9.92% Day Change: 1.11 | |
| Week Change: 13.47% Year-to-date Change: 9.5% | |
| GLSI Links: Profile News Message Board | |
| Charts:- Daily , Weekly | |
| Add GLSI to Watchlist: View: Get Complete GLSI Trend Analysis ➞ | |
 | LGND Ligand Pharmaceuticals Incorporated |
| Sector: Health Care | |
| SubSector: Biotechnology | |
| MarketCap: 1344.45 Millions | |
| Recent Price: 137.57 Smart Investing & Trading Score: 100 | |
| Day Percent Change: 6.13% Day Change: 7.94 | |
| Week Change: 13.04% Year-to-date Change: 28.4% | |
| LGND Links: Profile News Message Board | |
| Charts:- Daily , Weekly | |
| Add LGND to Watchlist: View: Get Complete LGND Trend Analysis ➞ | |
 | FHTX Foghorn Therapeutics Inc. |
| Sector: Health Care | |
| SubSector: Biotechnology | |
| MarketCap: 74487 Millions | |
| Recent Price: 6.10 Smart Investing & Trading Score: 100 | |
| Day Percent Change: 3.74% Day Change: 0.22 | |
| Week Change: 12.96% Year-to-date Change: 29.2% | |
| FHTX Links: Profile News Message Board | |
| Charts:- Daily , Weekly | |
| Add FHTX to Watchlist: View: Get Complete FHTX Trend Analysis ➞ | |
 | RCKT Rocket Pharmaceuticals, Inc. |
| Sector: Health Care | |
| SubSector: Biotechnology | |
| MarketCap: 899.585 Millions | |
| Recent Price: 3.34 Smart Investing & Trading Score: 74 | |
| Day Percent Change: 16.78% Day Change: 0.48 | |
| Week Change: 12.84% Year-to-date Change: -73.4% | |
| RCKT Links: Profile News Message Board | |
| Charts:- Daily , Weekly | |
| Add RCKT to Watchlist: View: Get Complete RCKT Trend Analysis ➞ | |
| For tabular summary view of above stock list: Summary View ➞ 0 - 25 , 25 - 50 , 50 - 75 , 75 - 100 , 100 - 125 , 125 - 150 , 150 - 175 , 175 - 200 , 200 - 225 , 225 - 250 , 250 - 275 , 275 - 300 , 300 - 325 , 325 - 350 , 350 - 375 , 375 - 400 , 400 - 425 | ||
| Click To Change The Sort Order: By Market Cap or Company Size Performance: Year-to-date, Week and Day | |
| Select Chart Type: | ||
|
Best Stocks Today 12Stocks.com |
© 2025 12Stocks.com Terms & Conditions Privacy Contact Us
All Information Provided Only For Education And Not To Be Used For Investing or Trading. See Terms & Conditions


One More Thing ... Get Best Stocks Delivered Daily!
Never Ever Miss A Move With Our Top Ten Stocks Lists
Find Best Stocks In Any Market - Bull or Bear Market
Take A Peek At Our Top Ten Stocks Lists: Daily, Weekly, Year-to-Date & Top Trends
Find Best Stocks In Any Market - Bull or Bear Market
Take A Peek At Our Top Ten Stocks Lists: Daily, Weekly, Year-to-Date & Top Trends
Healthcare Stocks With Best Up Trends [0-bearish to 100-bullish]: Zura Bio[100], Ovid [100], Tenaya [100], Greenwich LifeSciences[100], AirSculpt Technologies[100], Immunome [100], UroGen Pharma[100], sc [100], Zymeworks [100], Terns [100], Ligand [100]
Best Healthcare Stocks Year-to-Date:
Lyra [4042.44%], Nektar [2767.74%], Lyell Immunopharma[1387.5%], RAPT [547.47%], 908 Devices[208.18%], Sana Biotechnology[173.01%], Agenus [145.26%], Galectin [124.03%], Tango [122.01%], Compass [117.24%], Editas Medicine[114.96%] Best Healthcare Stocks This Week:
Zura Bio[49.62%], Generation Bio[34.94%], Tenaya [26.77%], Iovance Bio[25.13%], Lexicon [25%], CVRx [22.25%], Immunome [20.95%], RAPT [20.92%], Sarepta [20.91%], Ventyx Biosciences[19.34%], AirSculpt Technologies[19.08%] Best Healthcare Stocks Daily:
Zura Bio[51.94%], Ovid [22.9%], Tenaya [20.17%], Sarepta [19.53%], Rocket [16.78%], Biohaven [13.1%], Esperion [10.71%], Nektar [10.48%], Greenwich LifeSciences[9.92%], AirSculpt Technologies[9.81%], Kodiak Sciences[9.61%]