
 Login Sign Up


| |||||
 |  | ||||

| 12Stocks.com Market Intelligence |
Best Healthcare Stocks
 | "Discover best trending healthcare stocks with 12Stocks.com." |
| - Subu Vdaygiri, Founder, 12Stocks.com |
| In a hurry? Healthcare Stocks Lists: Performance Trends Table, Stock Charts
Sort Healthcare stocks: Daily, Weekly, Year-to-Date, Market Cap & Trends. Filter Healthcare stocks list by size:All Healthcare Large Mid-Range Small |
| 12Stocks.com Healthcare Stocks Performances & Trends Daily | |||||||||
|
|  The overall Smart Investing & Trading Score is 57 (0-bearish to 100-bullish) which puts Healthcare sector in short term neutral trend. The Smart Investing & Trading Score from previous trading session is 60 and a deterioration of trend continues.
| ||||||||
Here are the Smart Investing & Trading Scores of the most requested Healthcare stocks at 12Stocks.com (click stock name for detailed review):
|


| 12Stocks.com: Investing in Healthcare sector with Stocks | |
|
The following table helps investors and traders sort through current performance and trends (as measured by Smart Investing & Trading Score) of various
stocks in the Healthcare sector. Quick View: Move mouse or cursor over stock symbol (ticker) to view short-term Technical chart and over stock name to view long term chart. Click on  to add stock symbol to your watchlist and to add stock symbol to your watchlist and  to view watchlist. Click on any ticker or stock name for detailed market intelligence report for that stock. to view watchlist. Click on any ticker or stock name for detailed market intelligence report for that stock. |
12Stocks.com Performance of Stocks in Healthcare Sector
| Ticker | Stock Name | Watchlist | Category | Recent Price | Smart Investing & Trading Score | Change % | YTD Change% |
| CIVI | Civitas |   | Long-Term | 70.55 | 22 | -0.30% | 3.17% |
| CNTA | Centessa | | Biotechnology | 9.44 | 25 | -0.32% | 16.83% |
| GHRS | GH Research | | Biotechnology | 11.83 | 88 | -0.67% | 115.88% |
| TERN | Terns | | Biotechnology | 5.14 | 42 | 0.78% | -22.24% |
| CERS | Cerus | | Biotechnology | 1.74 | 34 | 1.16% | -19.44% |
| CARA | Cara | | Biotechnology | 0.78 | 47 | 2.37% | 4.52% |
| CDXS | Codexis | | Biotechnology | 3.34 | 69 | 7.40% | 9.51% |
| PETQ | PetIQ | | Pharmaceutical | 16.83 | 64 | -0.24% | -14.78% |
| ATRA | Atara Bio | | Biotechnology | 0.65 | 10 | -5.61% | 25.99% |
| EGRX | Eagle | | Pharmaceutical | 4.42 | 47 | 5.49% | -15.49% |
| OABI | OmniAb | | Biotechnology | 4.55 | 27 | 0.22% | -24.92% |
| ASMB | Assembly Biosciences | | Biotechnology | 13.07 | 63 | -1.51% | NA |
| COLL | Collegium | | Pharmaceutical | 37.48 | 90 | -0.79% | 21.77% |
| EHAB | Enhabit | | Medical Care Facilities | 10.13 | 60 | -0.49% | -2.13% |
| PGEN | Precigen | | Biotechnology | 1.40 | 0 | 0.00% | 4.48% |
| IMVT | Immunovant | | Biotechnology | 28.77 | 42 | 0.88% | -31.71% |
| CSTL | Castle Biosciences | | Laboratories | 22.91 | 100 | 4.04% | 6.16% |
| ARDX | Ardelyx | | Biotechnology | 6.77 | 49 | 2.42% | 9.19% |
| RCUS | Arcus Biosciences | | Biotechnology | 15.50 | 24 | 0.00% | -18.85% |
| GNFT | Genfit SA | | Biotechnology | 3.50 | 10 | 1.76% | -9.09% |
| PETS | PetMed Express | | Delivery | 3.98 | 30 | 0.63% | -47.29% |
| LMAT | LeMaitre Vascular | | Instruments | 66.81 | 52 | 0.04% | 17.71% |
| ETNB | 89bio | | Biotechnology | 8.88 | 32 | 1.49% | -20.50% |
| OFIX | Orthofix | | Equipment | 13.22 | 68 | 1.50% | -1.93% |
| TSVT | 2seventy bio | | Biotechnology | 4.75 | 49 | 3.71% | 9.83% |
| For chart view version of above stock list: Chart View ➞ 0 - 25 , 25 - 50 , 50 - 75 , 75 - 100 , 100 - 125 , 125 - 150 , 150 - 175 , 175 - 200 , 200 - 225 , 225 - 250 , 250 - 275 , 275 - 300 , 300 - 325 , 325 - 350 , 350 - 375 , 375 - 400 , 400 - 425 , 425 - 450 , 450 - 475 , 475 - 500 , 500 - 525 , 525 - 550 , 550 - 575 , 575 - 600 , 600 - 625 , 625 - 650 , 650 - 675 , 675 - 700 , 700 - 725 | ||
 | Click To Change The Sort Order: By Market Cap or Company Size Performance: Year-to-date, Week and Day |  |
|
Get the most comprehensive stock market coverage daily at 12Stocks.com ➞ Best Stocks Today ➞ Best Stocks Weekly ➞ Best Stocks Year-to-Date ➞ Best Stocks Trends ➞  Best Stocks Today 12Stocks.com Best Nasdaq Stocks ➞ Best S&P 500 Stocks ➞ Best Tech Stocks ➞ Best Biotech Stocks ➞ |
| Detailed Overview of Healthcare Stocks |
| Healthcare Technical Overview, Leaders & Laggards, Top Healthcare ETF Funds & Detailed Healthcare Stocks List, Charts, Trends & More |
| Healthcare Sector: Technical Analysis, Trends & YTD Performance | |
| Healthcare sector is composed of stocks
from pharmaceutical, biotech, diagnostics labs, insurance providers
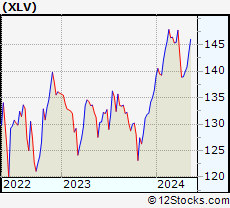
and healthcare services. Healthcare sector, as represented by XLV, an exchange-traded fund [ETF] that holds basket of Healthcare stocks (e.g, Merck, Amgen) is up by 3.01% and is currently underperforming the overall market by -2.61% year-to-date. Below is a quick view of Technical charts and trends: |
|
 XLV Weekly Chart |
|
| Long Term Trend: Not Good | |
| Medium Term Trend: Good | |
 XLV Daily Chart |
|
| Short Term Trend: Very Good | |
| Overall Trend Score: 57 | |
| YTD Performance: 3.01% | |
| **Trend Scores & Views Are Only For Educational Purposes And Not For Investing | |
| 12Stocks.com: Top Performing Healthcare Sector Stocks | ||||||||||||||||||||||||||||||||||||||||||||||||
 The top performing Healthcare sector stocks year to date are
Now, more recently, over last week, the top performing Healthcare sector stocks on the move are


|
||||||||||||||||||||||||||||||||||||||||||||||||
| 12Stocks.com: Investing in Healthcare Sector using Exchange Traded Funds | |
|
The following table shows list of key exchange traded funds (ETF) that
help investors track Healthcare Index. For detailed view, check out our ETF Funds section of our website. Quick View: Move mouse or cursor over ETF symbol (ticker) to view short-term Technical chart and over ETF name to view long term chart. Click on ticker or stock name for detailed view. Click on to add stock symbol to your watchlist and to view watchlist. |
12Stocks.com List of ETFs that track Healthcare Index
| Ticker | ETF Name | Watchlist | Recent Price | Smart Investing & Trading Score | Change % | Week % | Year-to-date % |
| XLV | Health Care | | 140.48 | 57 | -0.07 | 0.37 | 3.01% |
| XBI | Biotech | | 88.34 | 50 | 1.16 | 5.81 | -1.06% |
| IBB | Biotechnology | | 130.64 | 64 | 0.89 | 3.28 | -3.84% |
| BBH | Biotech | | 160.51 | 64 | 1.18 | 3.12 | -2.9% |
| VHT | Health Care | | 257.14 | 37 | -0.05 | 0.71 | 2.57% |
| IYH | Healthcare | | 59.12 | 37 | -0.10 | 0.87 | 3.27% |
| IHF | Healthcare Providers | | 51.64 | 15 | 0.39 | -0.54 | -1.66% |
| IHI | Medical Devices | | 55.16 | 0 | 0.25 | -0.67 | 2.2% |
| BIB | Biotechnology | | 52.58 | 57 | 0.00 | 5.88 | -7.84% |
| BIS | Short Biotech | | 18.61 | 36 | -2.62 | -7.96 | 2.99% |
| XHE | Health Care Equipment | | 84.89 | 47 | 1.16 | 2.98 | 0.75% |
| CURE | Healthcare Bull 3X | | 105.11 | 40 | -1.36 | -0.19 | 3.31% |
| LABU | Biotech Bull 3X | | 102.99 | 42 | 3.19 | 17.69 | -15.56% |
| LABD | Biotech Bear 3X | | 8.76 | 44 | -2.99 | -16.73 | -9.6% |
| PSCH | SmallCap Health Care | | 41.83 | 30 | 0.80 | 2.78 | -2.27% |
| XHS | Health Care Services | | 88.14 | 27 | -0.19 | 0.31 | -0.91% |
| PTH | DWA Healthcare Momentum | | 41.27 | 22 | 0.00 | 3.46 | 5.44% |
| BTEC | Principal Healthcare Innovators | | 35.90 | 42 | 0.00 | 4.81 | -1.19% |
| RXL | Health Care | | 95.21 | 47 | -0.12 | 0.41 | 4.16% |
| RXD | Short Health Care | | 11.34 | 64 | -0.18 | -0.96 | -4.91% |
| 12Stocks.com: Charts, Trends, Fundamental Data and Performances of Healthcare Stocks | |
|
We now take in-depth look at all Healthcare stocks including charts, multi-period performances and overall trends (as measured by Smart Investing & Trading Score). One can sort Healthcare stocks (click link to choose) by Daily, Weekly and by Year-to-Date performances. Also, one can sort by size of the company or by market capitalization. |
| Select Your Default Chart Type: | |||||
| |||||
| Click on stock symbol or name for detailed view. Click on to add stock symbol to your watchlist and to view watchlist. Quick View: Move mouse or cursor over "Daily" to quickly view daily Technical stock chart and over "Weekly" to view weekly Technical stock chart. | |||||

 | CIVI Civitas Solutions, Inc. |
| Sector: Health Care | |
| SubSector: Long-Term Care Facilities | |
| MarketCap: 625.74 Millions | |
| Recent Price: 70.55 Smart Investing & Trading Score: 22 | |
| Day Percent Change: -0.30% Day Change: -0.21 | |
| Week Change: -4.68% Year-to-date Change: 3.2% | |
| CIVI Links: Profile News Message Board | |
| Charts:- Daily , Weekly | |
| Add CIVI to Watchlist: View: Get Complete CIVI Trend Analysis ➞ | |
 | CNTA Centessa Pharmaceuticals plc |
| Sector: Health Care | |
| SubSector: Biotechnology | |
| MarketCap: 616 Millions | |
| Recent Price: 9.44 Smart Investing & Trading Score: 25 | |
| Day Percent Change: -0.32% Day Change: -0.03 | |
| Week Change: 5.65% Year-to-date Change: 16.8% | |
| CNTA Links: Profile News Message Board | |
| Charts:- Daily , Weekly | |
| Add CNTA to Watchlist: View: Get Complete CNTA Trend Analysis ➞ | |
 | GHRS GH Research PLC |
| Sector: Health Care | |
| SubSector: Biotechnology | |
| MarketCap: 614 Millions | |
| Recent Price: 11.83 Smart Investing & Trading Score: 88 | |
| Day Percent Change: -0.67% Day Change: -0.08 | |
| Week Change: 12.45% Year-to-date Change: 115.9% | |
| GHRS Links: Profile News Message Board | |
| Charts:- Daily , Weekly | |
| Add GHRS to Watchlist: View: Get Complete GHRS Trend Analysis ➞ | |
 | TERN Terns Pharmaceuticals, Inc. |
| Sector: Health Care | |
| SubSector: Biotechnology | |
| MarketCap: 611 Millions | |
| Recent Price: 5.14 Smart Investing & Trading Score: 42 | |
| Day Percent Change: 0.78% Day Change: 0.04 | |
| Week Change: 4.68% Year-to-date Change: -22.2% | |
| TERN Links: Profile News Message Board | |
| Charts:- Daily , Weekly | |
| Add TERN to Watchlist: View: Get Complete TERN Trend Analysis ➞ | |
 | CERS Cerus Corporation |
| Sector: Health Care | |
| SubSector: Biotechnology | |
| MarketCap: 607.185 Millions | |
| Recent Price: 1.74 Smart Investing & Trading Score: 34 | |
| Day Percent Change: 1.16% Day Change: 0.02 | |
| Week Change: 1.75% Year-to-date Change: -19.4% | |
| CERS Links: Profile News Message Board | |
| Charts:- Daily , Weekly | |
| Add CERS to Watchlist: View: Get Complete CERS Trend Analysis ➞ | |
 | CARA Cara Therapeutics, Inc. |
| Sector: Health Care | |
| SubSector: Biotechnology | |
| MarketCap: 597.985 Millions | |
| Recent Price: 0.78 Smart Investing & Trading Score: 47 | |
| Day Percent Change: 2.37% Day Change: 0.02 | |
| Week Change: 13.49% Year-to-date Change: 4.5% | |
| CARA Links: Profile News Message Board | |
| Charts:- Daily , Weekly | |
| Add CARA to Watchlist: View: Get Complete CARA Trend Analysis ➞ | |
 | CDXS Codexis, Inc. |
| Sector: Health Care | |
| SubSector: Biotechnology | |
| MarketCap: 592.185 Millions | |
| Recent Price: 3.34 Smart Investing & Trading Score: 69 | |
| Day Percent Change: 7.40% Day Change: 0.23 | |
| Week Change: 25.56% Year-to-date Change: 9.5% | |
| CDXS Links: Profile News Message Board | |
| Charts:- Daily , Weekly | |
| Add CDXS to Watchlist: View: Get Complete CDXS Trend Analysis ➞ | |
 | PETQ PetIQ, Inc. |
| Sector: Health Care | |
| SubSector: Drugs - Generic | |
| MarketCap: 587.585 Millions | |
| Recent Price: 16.83 Smart Investing & Trading Score: 64 | |
| Day Percent Change: -0.24% Day Change: -0.04 | |
| Week Change: 1.81% Year-to-date Change: -14.8% | |
| PETQ Links: Profile News Message Board | |
| Charts:- Daily , Weekly | |
| Add PETQ to Watchlist: View: Get Complete PETQ Trend Analysis ➞ | |
 | ATRA Atara Biotherapeutics, Inc. |
| Sector: Health Care | |
| SubSector: Biotechnology | |
| MarketCap: 579.185 Millions | |
| Recent Price: 0.65 Smart Investing & Trading Score: 10 | |
| Day Percent Change: -5.61% Day Change: -0.04 | |
| Week Change: -6.36% Year-to-date Change: 26.0% | |
| ATRA Links: Profile News Message Board | |
| Charts:- Daily , Weekly | |
| Add ATRA to Watchlist: View: Get Complete ATRA Trend Analysis ➞ | |
 | EGRX Eagle Pharmaceuticals, Inc. |
| Sector: Health Care | |
| SubSector: Drugs - Generic | |
| MarketCap: 573.385 Millions | |
| Recent Price: 4.42 Smart Investing & Trading Score: 47 | |
| Day Percent Change: 5.49% Day Change: 0.23 | |
| Week Change: 6.25% Year-to-date Change: -15.5% | |
| EGRX Links: Profile News Message Board | |
| Charts:- Daily , Weekly | |
| Add EGRX to Watchlist: View: Get Complete EGRX Trend Analysis ➞ | |
 | OABI OmniAb, Inc. |
| Sector: Health Care | |
| SubSector: Biotechnology | |
| MarketCap: 570 Millions | |
| Recent Price: 4.55 Smart Investing & Trading Score: 27 | |
| Day Percent Change: 0.22% Day Change: 0.01 | |
| Week Change: 1.79% Year-to-date Change: -24.9% | |
| OABI Links: Profile News Message Board | |
| Charts:- Daily , Weekly | |
| Add OABI to Watchlist: View: Get Complete OABI Trend Analysis ➞ | |
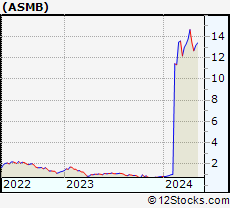 | ASMB Assembly Biosciences, Inc. |
| Sector: Health Care | |
| SubSector: Biotechnology | |
| MarketCap: 569.485 Millions | |
| Recent Price: 13.07 Smart Investing & Trading Score: 63 | |
| Day Percent Change: -1.51% Day Change: -0.20 | |
| Week Change: 3.32% Year-to-date Change: 1,493.7% | |
| ASMB Links: Profile News Message Board | |
| Charts:- Daily , Weekly | |
| Add ASMB to Watchlist: View: Get Complete ASMB Trend Analysis ➞ | |
 | COLL Collegium Pharmaceutical, Inc. |
| Sector: Health Care | |
| SubSector: Drugs - Generic | |
| MarketCap: 569.185 Millions | |
| Recent Price: 37.48 Smart Investing & Trading Score: 90 | |
| Day Percent Change: -0.79% Day Change: -0.30 | |
| Week Change: 2.91% Year-to-date Change: 21.8% | |
| COLL Links: Profile News Message Board | |
| Charts:- Daily , Weekly | |
| Add COLL to Watchlist: View: Get Complete COLL Trend Analysis ➞ | |
 | EHAB Enhabit, Inc. |
| Sector: Health Care | |
| SubSector: Medical Care Facilities | |
| MarketCap: 569 Millions | |
| Recent Price: 10.13 Smart Investing & Trading Score: 60 | |
| Day Percent Change: -0.49% Day Change: -0.05 | |
| Week Change: 1% Year-to-date Change: -2.1% | |
| EHAB Links: Profile News Message Board | |
| Charts:- Daily , Weekly | |
| Add EHAB to Watchlist: View: Get Complete EHAB Trend Analysis ➞ | |
 | PGEN Precigen, Inc. |
| Sector: Health Care | |
| SubSector: Biotechnology | |
| MarketCap: 564.785 Millions | |
| Recent Price: 1.40 Smart Investing & Trading Score: 0 | |
| Day Percent Change: 0.00% Day Change: 0.00 | |
| Week Change: -0.71% Year-to-date Change: 4.5% | |
| PGEN Links: Profile News Message Board | |
| Charts:- Daily , Weekly | |
| Add PGEN to Watchlist: View: Get Complete PGEN Trend Analysis ➞ | |
 | IMVT Immunovant, Inc. |
| Sector: Health Care | |
| SubSector: Biotechnology | |
| MarketCap: 552.885 Millions | |
| Recent Price: 28.77 Smart Investing & Trading Score: 42 | |
| Day Percent Change: 0.88% Day Change: 0.25 | |
| Week Change: 5.89% Year-to-date Change: -31.7% | |
| IMVT Links: Profile News Message Board | |
| Charts:- Daily , Weekly | |
| Add IMVT to Watchlist: View: Get Complete IMVT Trend Analysis ➞ | |
 | CSTL Castle Biosciences, Inc. |
| Sector: Health Care | |
| SubSector: Medical Laboratories & Research | |
| MarketCap: 545 Millions | |
| Recent Price: 22.91 Smart Investing & Trading Score: 100 | |
| Day Percent Change: 4.04% Day Change: 0.89 | |
| Week Change: 12.64% Year-to-date Change: 6.2% | |
| CSTL Links: Profile News Message Board | |
| Charts:- Daily , Weekly | |
| Add CSTL to Watchlist: View: Get Complete CSTL Trend Analysis ➞ | |
 | ARDX Ardelyx, Inc. |
| Sector: Health Care | |
| SubSector: Biotechnology | |
| MarketCap: 541.985 Millions | |
| Recent Price: 6.77 Smart Investing & Trading Score: 49 | |
| Day Percent Change: 2.42% Day Change: 0.16 | |
| Week Change: 5.45% Year-to-date Change: 9.2% | |
| ARDX Links: Profile News Message Board | |
| Charts:- Daily , Weekly | |
| Add ARDX to Watchlist: View: Get Complete ARDX Trend Analysis ➞ | |
 | RCUS Arcus Biosciences, Inc. |
| Sector: Health Care | |
| SubSector: Biotechnology | |
| MarketCap: 539.285 Millions | |
| Recent Price: 15.50 Smart Investing & Trading Score: 24 | |
| Day Percent Change: 0.00% Day Change: 0.00 | |
| Week Change: -0.32% Year-to-date Change: -18.9% | |
| RCUS Links: Profile News Message Board | |
| Charts:- Daily , Weekly | |
| Add RCUS to Watchlist: View: Get Complete RCUS Trend Analysis ➞ | |
 | GNFT Genfit SA |
| Sector: Health Care | |
| SubSector: Biotechnology | |
| MarketCap: 529.285 Millions | |
| Recent Price: 3.50 Smart Investing & Trading Score: 10 | |
| Day Percent Change: 1.76% Day Change: 0.06 | |
| Week Change: 0.29% Year-to-date Change: -9.1% | |
| GNFT Links: Profile News Message Board | |
| Charts:- Daily , Weekly | |
| Add GNFT to Watchlist: View: Get Complete GNFT Trend Analysis ➞ | |
 | PETS PetMed Express, Inc. |
| Sector: Health Care | |
| SubSector: Drug Delivery | |
| MarketCap: 528.23 Millions | |
| Recent Price: 3.98 Smart Investing & Trading Score: 30 | |
| Day Percent Change: 0.63% Day Change: 0.02 | |
| Week Change: -0.87% Year-to-date Change: -47.3% | |
| PETS Links: Profile News Message Board | |
| Charts:- Daily , Weekly | |
| Add PETS to Watchlist: View: Get Complete PETS Trend Analysis ➞ | |
 | LMAT LeMaitre Vascular, Inc. |
| Sector: Health Care | |
| SubSector: Medical Instruments & Supplies | |
| MarketCap: 522.16 Millions | |
| Recent Price: 66.81 Smart Investing & Trading Score: 52 | |
| Day Percent Change: 0.04% Day Change: 0.03 | |
| Week Change: 2.06% Year-to-date Change: 17.7% | |
| LMAT Links: Profile News Message Board | |
| Charts:- Daily , Weekly | |
| Add LMAT to Watchlist: View: Get Complete LMAT Trend Analysis ➞ | |
 | ETNB 89bio, Inc. |
| Sector: Health Care | |
| SubSector: Biotechnology | |
| MarketCap: 517.485 Millions | |
| Recent Price: 8.88 Smart Investing & Trading Score: 32 | |
| Day Percent Change: 1.49% Day Change: 0.13 | |
| Week Change: 7.51% Year-to-date Change: -20.5% | |
| ETNB Links: Profile News Message Board | |
| Charts:- Daily , Weekly | |
| Add ETNB to Watchlist: View: Get Complete ETNB Trend Analysis ➞ | |
 | OFIX Orthofix Medical Inc. |
| Sector: Health Care | |
| SubSector: Medical Appliances & Equipment | |
| MarketCap: 508.18 Millions | |
| Recent Price: 13.22 Smart Investing & Trading Score: 68 | |
| Day Percent Change: 1.50% Day Change: 0.20 | |
| Week Change: 1.77% Year-to-date Change: -1.9% | |
| OFIX Links: Profile News Message Board | |
| Charts:- Daily , Weekly | |
| Add OFIX to Watchlist: View: Get Complete OFIX Trend Analysis ➞ | |
 | TSVT 2seventy bio, Inc. |
| Sector: Health Care | |
| SubSector: Biotechnology | |
| MarketCap: 504 Millions | |
| Recent Price: 4.75 Smart Investing & Trading Score: 49 | |
| Day Percent Change: 3.71% Day Change: 0.17 | |
| Week Change: 11.5% Year-to-date Change: 9.8% | |
| TSVT Links: Profile News Message Board | |
| Charts:- Daily , Weekly | |
| Add TSVT to Watchlist: View: Get Complete TSVT Trend Analysis ➞ | |
| For tabular summary view of above stock list: Summary View ➞ 0 - 25 , 25 - 50 , 50 - 75 , 75 - 100 , 100 - 125 , 125 - 150 , 150 - 175 , 175 - 200 , 200 - 225 , 225 - 250 , 250 - 275 , 275 - 300 , 300 - 325 , 325 - 350 , 350 - 375 , 375 - 400 , 400 - 425 , 425 - 450 , 450 - 475 , 475 - 500 , 500 - 525 , 525 - 550 , 550 - 575 , 575 - 600 , 600 - 625 , 625 - 650 , 650 - 675 , 675 - 700 , 700 - 725 | ||
| Click To Change The Sort Order: By Market Cap or Company Size Performance: Year-to-date, Week and Day | |
| Select Chart Type: | ||
|
Best Stocks Today 12Stocks.com |
© 2024 12Stocks.com Terms & Conditions Privacy Contact Us
All Information Provided Only For Education And Not To Be Used For Investing or Trading. See Terms & Conditions


One More Thing ... Get Best Stocks Delivered Daily!
Never Ever Miss A Move With Our Top Ten Stocks Lists
Find Best Stocks In Any Market - Bull or Bear Market
Take A Peek At Our Top Ten Stocks Lists: Daily, Weekly, Year-to-Date & Top Trends
Find Best Stocks In Any Market - Bull or Bear Market
Take A Peek At Our Top Ten Stocks Lists: Daily, Weekly, Year-to-Date & Top Trends
Healthcare Stocks With Best Up Trends [0-bearish to 100-bullish]: Emergent Bio[100], Lantheus [100], Blueprint Medicines[100], Glaukos [100], TransMedics [100], Corcept [100], Avanos [100], IRadimed [100], Castle Biosciences[100], Anika [100], Surmodics [100]
Best Healthcare Stocks Year-to-Date:
Pieris [6064.83%], Avenue [2924.84%], Precision BioSciences[2842.47%], Inovio [2249.02%], Assembly Biosciences[1493.71%], Agenus [1414.68%], Aurora Cannabis[1362.62%], NuCana [1245.5%], Adverum Biotechnologies[1228.37%], Affimed N.V[740%], CareMax [674.23%] Best Healthcare Stocks This Week:
CytomX [182.08%], GeneDx [75.99%], Deciphera [73.17%], Emergent Bio[71.88%], P3 Health[38.51%], Cue Biopharma[36.26%], TransMedics [35.13%], Seres [33.33%], Surmodics [31.94%], Phibro Animal[31.58%], Poseida [31.22%] Best Healthcare Stocks Daily:
Emergent Bio[70.98%], Pulmonx [21.37%], Regencell Bioscience[21.25%], Orchestra BioMed[18.83%], Ocular Therapeutix[16.53%], Lantheus [16.01%], Cellectis S.A[14.75%], Butterfly Network[13.09%], Blueprint Medicines[12.75%], Moderna [12.70%], Mustang Bio[12.65%]