
 Login Sign Up


| |||||
 |  | ||||

| 12Stocks.com Market Intelligence |
Best Healthcare Stocks
 | "Discover best trending healthcare stocks with 12Stocks.com." |
| - Subu Vdaygiri, Founder, 12Stocks.com |
| In a hurry? Healthcare Stocks Lists: Performance Trends Table, Stock Charts
Sort Healthcare stocks: Daily, Weekly, Year-to-Date, Market Cap & Trends. Filter Healthcare stocks list by size:All Healthcare Large Mid-Range Small |
| 12Stocks.com Healthcare Stocks Performances & Trends Daily | |||||||||
|
|  The overall Smart Investing & Trading Score is 57 (0-bearish to 100-bullish) which puts Healthcare sector in short term neutral trend. The Smart Investing & Trading Score from previous trading session is 60 and a deterioration of trend continues.
| ||||||||
Here are the Smart Investing & Trading Scores of the most requested Healthcare stocks at 12Stocks.com (click stock name for detailed review):
|


| 12Stocks.com: Investing in Healthcare sector with Stocks | |
|
The following table helps investors and traders sort through current performance and trends (as measured by Smart Investing & Trading Score) of various
stocks in the Healthcare sector. Quick View: Move mouse or cursor over stock symbol (ticker) to view short-term Technical chart and over stock name to view long term chart. Click on  to add stock symbol to your watchlist and to add stock symbol to your watchlist and  to view watchlist. Click on any ticker or stock name for detailed market intelligence report for that stock. to view watchlist. Click on any ticker or stock name for detailed market intelligence report for that stock. |
12Stocks.com Performance of Stocks in Healthcare Sector
| Ticker | Stock Name | Watchlist | Category | Recent Price | Smart Investing & Trading Score | Change % | YTD Change% |
| FDMT | 4D Molecular |   | Biotechnology | 25.38 | 32 | 0.08% | 22.61% |
| OMER | Omeros | | Biotechnology | 3.73 | 54 | 9.71% | 14.07% |
| VERA | Vera | | Biotechnology | 41.91 | 44 | -0.95% | 170.74% |
| KIDS | OrthoPediatrics | | Equipment | 31.82 | 100 | 2.51% | -2.12% |
| TYRA | Tyra Biosciences | | Biotechnology | 17.90 | 62 | -2.16% | 34.25% |
| PHAT | Phathom | | Biotechnology | 9.76 | 44 | 5.40% | 6.90% |
| MLYS | Mineralys | | Biotechnology | 12.93 | 67 | 0.23% | 48.22% |
| VREX | Varex Imaging | | Equipment | 16.42 | 45 | -0.97% | -19.90% |
| NTLA | Intellia | | Biotechnology | 23.29 | 59 | 3.51% | -23.61% |
| APRE | Aprea | | Biotechnology | 5.25 | 17 | 0.00% | 11.70% |
| AXNX | Axonics Modulation | | Equipment | 67.08 | 37 | 0.31% | 7.79% |
| INMD | InMode | | Equipment | 17.34 | 34 | 0.58% | -22.03% |
| HLVX | HilleVax | | Biotechnology | 13.94 | 49 | 3.03% | -15.39% |
| AKRO | Akero | | Biotechnology | 19.69 | 35 | -1.94% | -15.67% |
| MTEM | Molecular Templates | | Biotechnology | 1.73 | 24 | 4.85% | -53.62% |
| TCMD | Tactile Systems | | Instruments | 14.43 | 32 | 0.63% | 0.91% |
| AMPH | Amphastar | | Pharmaceutical | 42.63 | 64 | 1.30% | -31.08% |
| CYTK | Cytokinetics | | Biotechnology | 64.34 | 32 | 1.53% | -22.94% |
| GOSS | Gossamer Bio | | Biotechnology | 0.76 | 42 | 7.96% | -16.30% |
| RYTM | Rhythm | | Biotechnology | 41.02 | 64 | -0.99% | -10.77% |
| APLT | Applied | | Biotechnology | 4.52 | 32 | 1.80% | 34.93% |
| SHCR | Sharecare | | Health Information | 0.75 | 32 | 3.09% | -30.86% |
| CGEN | Compugen | | Biotechnology | 2.15 | 64 | 8.04% | 8.59% |
| SPRY | ARS | | Biotechnology | 9.19 | 90 | -1.39% | 61.65% |
| AVRO | AVROBIO | | Biotechnology | 1.23 | 42 | 0.82% | -9.56% |
| For chart view version of above stock list: Chart View ➞ 0 - 25 , 25 - 50 , 50 - 75 , 75 - 100 , 100 - 125 , 125 - 150 , 150 - 175 , 175 - 200 , 200 - 225 , 225 - 250 , 250 - 275 , 275 - 300 , 300 - 325 , 325 - 350 , 350 - 375 , 375 - 400 , 400 - 425 , 425 - 450 , 450 - 475 , 475 - 500 , 500 - 525 , 525 - 550 , 550 - 575 , 575 - 600 , 600 - 625 , 625 - 650 , 650 - 675 , 675 - 700 , 700 - 725 | ||
 | Click To Change The Sort Order: By Market Cap or Company Size Performance: Year-to-date, Week and Day |  |
|
Get the most comprehensive stock market coverage daily at 12Stocks.com ➞ Best Stocks Today ➞ Best Stocks Weekly ➞ Best Stocks Year-to-Date ➞ Best Stocks Trends ➞  Best Stocks Today 12Stocks.com Best Nasdaq Stocks ➞ Best S&P 500 Stocks ➞ Best Tech Stocks ➞ Best Biotech Stocks ➞ |
| Detailed Overview of Healthcare Stocks |
| Healthcare Technical Overview, Leaders & Laggards, Top Healthcare ETF Funds & Detailed Healthcare Stocks List, Charts, Trends & More |
| Healthcare Sector: Technical Analysis, Trends & YTD Performance | |
| Healthcare sector is composed of stocks
from pharmaceutical, biotech, diagnostics labs, insurance providers
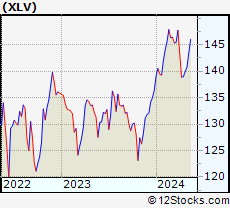
and healthcare services. Healthcare sector, as represented by XLV, an exchange-traded fund [ETF] that holds basket of Healthcare stocks (e.g, Merck, Amgen) is up by 3.01% and is currently underperforming the overall market by -2.61% year-to-date. Below is a quick view of Technical charts and trends: |
|
 XLV Weekly Chart |
|
| Long Term Trend: Not Good | |
| Medium Term Trend: Good | |
 XLV Daily Chart |
|
| Short Term Trend: Very Good | |
| Overall Trend Score: 57 | |
| YTD Performance: 3.01% | |
| **Trend Scores & Views Are Only For Educational Purposes And Not For Investing | |
| 12Stocks.com: Top Performing Healthcare Sector Stocks | ||||||||||||||||||||||||||||||||||||||||||||||||
 The top performing Healthcare sector stocks year to date are
Now, more recently, over last week, the top performing Healthcare sector stocks on the move are


|
||||||||||||||||||||||||||||||||||||||||||||||||
| 12Stocks.com: Investing in Healthcare Sector using Exchange Traded Funds | |
|
The following table shows list of key exchange traded funds (ETF) that
help investors track Healthcare Index. For detailed view, check out our ETF Funds section of our website. Quick View: Move mouse or cursor over ETF symbol (ticker) to view short-term Technical chart and over ETF name to view long term chart. Click on ticker or stock name for detailed view. Click on to add stock symbol to your watchlist and to view watchlist. |
12Stocks.com List of ETFs that track Healthcare Index
| Ticker | ETF Name | Watchlist | Recent Price | Smart Investing & Trading Score | Change % | Week % | Year-to-date % |
| XLV | Health Care | | 140.48 | 57 | -0.07 | 0.37 | 3.01% |
| XBI | Biotech | | 88.34 | 50 | 1.16 | 5.81 | -1.06% |
| IBB | Biotechnology | | 130.64 | 64 | 0.89 | 3.28 | -3.84% |
| BBH | Biotech | | 160.51 | 64 | 1.18 | 3.12 | -2.9% |
| VHT | Health Care | | 257.14 | 37 | -0.05 | 0.71 | 2.57% |
| IYH | Healthcare | | 59.12 | 37 | -0.10 | 0.87 | 3.27% |
| IHF | Healthcare Providers | | 51.64 | 15 | 0.39 | -0.54 | -1.66% |
| IHI | Medical Devices | | 55.16 | 0 | 0.25 | -0.67 | 2.2% |
| BIB | Biotechnology | | 52.58 | 57 | 0.00 | 5.88 | -7.84% |
| BIS | Short Biotech | | 18.61 | 36 | -2.62 | -7.96 | 2.99% |
| XHE | Health Care Equipment | | 84.89 | 47 | 1.16 | 2.98 | 0.75% |
| CURE | Healthcare Bull 3X | | 105.11 | 40 | -1.36 | -0.19 | 3.31% |
| LABU | Biotech Bull 3X | | 102.99 | 42 | 3.19 | 17.69 | -15.56% |
| LABD | Biotech Bear 3X | | 8.76 | 44 | -2.99 | -16.73 | -9.6% |
| PSCH | SmallCap Health Care | | 41.83 | 30 | 0.80 | 2.78 | -2.27% |
| XHS | Health Care Services | | 88.14 | 27 | -0.19 | 0.31 | -0.91% |
| PTH | DWA Healthcare Momentum | | 41.27 | 22 | 0.00 | 3.46 | 5.44% |
| BTEC | Principal Healthcare Innovators | | 35.90 | 42 | 0.00 | 4.81 | -1.19% |
| RXL | Health Care | | 95.21 | 47 | -0.12 | 0.41 | 4.16% |
| RXD | Short Health Care | | 11.34 | 64 | -0.18 | -0.96 | -4.91% |
| 12Stocks.com: Charts, Trends, Fundamental Data and Performances of Healthcare Stocks | |
|
We now take in-depth look at all Healthcare stocks including charts, multi-period performances and overall trends (as measured by Smart Investing & Trading Score). One can sort Healthcare stocks (click link to choose) by Daily, Weekly and by Year-to-Date performances. Also, one can sort by size of the company or by market capitalization. |
| Select Your Default Chart Type: | |||||
| |||||
| Click on stock symbol or name for detailed view. Click on to add stock symbol to your watchlist and to view watchlist. Quick View: Move mouse or cursor over "Daily" to quickly view daily Technical stock chart and over "Weekly" to view weekly Technical stock chart. | |||||

 | FDMT 4D Molecular Therapeutics, Inc. |
| Sector: Health Care | |
| SubSector: Biotechnology | |
| MarketCap: 772 Millions | |
| Recent Price: 25.38 Smart Investing & Trading Score: 32 | |
| Day Percent Change: 0.08% Day Change: 0.02 | |
| Week Change: 9.28% Year-to-date Change: 22.6% | |
| FDMT Links: Profile News Message Board | |
| Charts:- Daily , Weekly | |
| Add FDMT to Watchlist: View: Get Complete FDMT Trend Analysis ➞ | |
 | OMER Omeros Corporation |
| Sector: Health Care | |
| SubSector: Biotechnology | |
| MarketCap: 759.585 Millions | |
| Recent Price: 3.73 Smart Investing & Trading Score: 54 | |
| Day Percent Change: 9.71% Day Change: 0.33 | |
| Week Change: 18.41% Year-to-date Change: 14.1% | |
| OMER Links: Profile News Message Board | |
| Charts:- Daily , Weekly | |
| Add OMER to Watchlist: View: Get Complete OMER Trend Analysis ➞ | |
 | VERA Vera Therapeutics, Inc. |
| Sector: Health Care | |
| SubSector: Biotechnology | |
| MarketCap: 746 Millions | |
| Recent Price: 41.91 Smart Investing & Trading Score: 44 | |
| Day Percent Change: -0.95% Day Change: -0.40 | |
| Week Change: 5.65% Year-to-date Change: 170.7% | |
| VERA Links: Profile News Message Board | |
| Charts:- Daily , Weekly | |
| Add VERA to Watchlist: View: Get Complete VERA Trend Analysis ➞ | |
 | KIDS OrthoPediatrics Corp. |
| Sector: Health Care | |
| SubSector: Medical Appliances & Equipment | |
| MarketCap: 742.28 Millions | |
| Recent Price: 31.82 Smart Investing & Trading Score: 100 | |
| Day Percent Change: 2.51% Day Change: 0.78 | |
| Week Change: 5.16% Year-to-date Change: -2.1% | |
| KIDS Links: Profile News Message Board | |
| Charts:- Daily , Weekly | |
| Add KIDS to Watchlist: View: Get Complete KIDS Trend Analysis ➞ | |
 | TYRA Tyra Biosciences, Inc. |
| Sector: Health Care | |
| SubSector: Biotechnology | |
| MarketCap: 732 Millions | |
| Recent Price: 17.90 Smart Investing & Trading Score: 62 | |
| Day Percent Change: -2.16% Day Change: -0.39 | |
| Week Change: 14.2% Year-to-date Change: 34.3% | |
| TYRA Links: Profile News Message Board | |
| Charts:- Daily , Weekly | |
| Add TYRA to Watchlist: View: Get Complete TYRA Trend Analysis ➞ | |
 | PHAT Phathom Pharmaceuticals, Inc. |
| Sector: Health Care | |
| SubSector: Biotechnology | |
| MarketCap: 728.785 Millions | |
| Recent Price: 9.76 Smart Investing & Trading Score: 44 | |
| Day Percent Change: 5.40% Day Change: 0.50 | |
| Week Change: 6.32% Year-to-date Change: 6.9% | |
| PHAT Links: Profile News Message Board | |
| Charts:- Daily , Weekly | |
| Add PHAT to Watchlist: View: Get Complete PHAT Trend Analysis ➞ | |
 | MLYS Mineralys Therapeutics, Inc. |
| Sector: Health Care | |
| SubSector: Biotechnology | |
| MarketCap: 719 Millions | |
| Recent Price: 12.93 Smart Investing & Trading Score: 67 | |
| Day Percent Change: 0.23% Day Change: 0.03 | |
| Week Change: 8.98% Year-to-date Change: 48.2% | |
| MLYS Links: Profile News Message Board | |
| Charts:- Daily , Weekly | |
| Add MLYS to Watchlist: View: Get Complete MLYS Trend Analysis ➞ | |
 | VREX Varex Imaging Corporation |
| Sector: Health Care | |
| SubSector: Medical Appliances & Equipment | |
| MarketCap: 718.78 Millions | |
| Recent Price: 16.42 Smart Investing & Trading Score: 45 | |
| Day Percent Change: -0.97% Day Change: -0.16 | |
| Week Change: -2.2% Year-to-date Change: -19.9% | |
| VREX Links: Profile News Message Board | |
| Charts:- Daily , Weekly | |
| Add VREX to Watchlist: View: Get Complete VREX Trend Analysis ➞ | |
 | NTLA Intellia Therapeutics, Inc. |
| Sector: Health Care | |
| SubSector: Biotechnology | |
| MarketCap: 707.185 Millions | |
| Recent Price: 23.29 Smart Investing & Trading Score: 59 | |
| Day Percent Change: 3.51% Day Change: 0.79 | |
| Week Change: 12.19% Year-to-date Change: -23.6% | |
| NTLA Links: Profile News Message Board | |
| Charts:- Daily , Weekly | |
| Add NTLA to Watchlist: View: Get Complete NTLA Trend Analysis ➞ | |
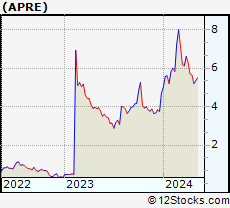 | APRE Aprea Therapeutics, Inc. |
| Sector: Health Care | |
| SubSector: Biotechnology | |
| MarketCap: 699.285 Millions | |
| Recent Price: 5.25 Smart Investing & Trading Score: 17 | |
| Day Percent Change: 0.00% Day Change: 0.00 | |
| Week Change: 0.96% Year-to-date Change: 11.7% | |
| APRE Links: Profile News Message Board | |
| Charts:- Daily , Weekly | |
| Add APRE to Watchlist: View: Get Complete APRE Trend Analysis ➞ | |
 | AXNX Axonics Modulation Technologies, Inc. |
| Sector: Health Care | |
| SubSector: Medical Appliances & Equipment | |
| MarketCap: 692.48 Millions | |
| Recent Price: 67.08 Smart Investing & Trading Score: 37 | |
| Day Percent Change: 0.31% Day Change: 0.21 | |
| Week Change: 0.58% Year-to-date Change: 7.8% | |
| AXNX Links: Profile News Message Board | |
| Charts:- Daily , Weekly | |
| Add AXNX to Watchlist: View: Get Complete AXNX Trend Analysis ➞ | |
 | INMD InMode Ltd. |
| Sector: Health Care | |
| SubSector: Medical Appliances & Equipment | |
| MarketCap: 689.08 Millions | |
| Recent Price: 17.34 Smart Investing & Trading Score: 34 | |
| Day Percent Change: 0.58% Day Change: 0.10 | |
| Week Change: 1.17% Year-to-date Change: -22.0% | |
| INMD Links: Profile News Message Board | |
| Charts:- Daily , Weekly | |
| Add INMD to Watchlist: View: Get Complete INMD Trend Analysis ➞ | |
 | HLVX HilleVax, Inc. |
| Sector: Health Care | |
| SubSector: Biotechnology | |
| MarketCap: 680 Millions | |
| Recent Price: 13.94 Smart Investing & Trading Score: 49 | |
| Day Percent Change: 3.03% Day Change: 0.41 | |
| Week Change: 8.82% Year-to-date Change: -15.4% | |
| HLVX Links: Profile News Message Board | |
| Charts:- Daily , Weekly | |
| Add HLVX to Watchlist: View: Get Complete HLVX Trend Analysis ➞ | |
 | AKRO Akero Therapeutics, Inc. |
| Sector: Health Care | |
| SubSector: Biotechnology | |
| MarketCap: 675.085 Millions | |
| Recent Price: 19.69 Smart Investing & Trading Score: 35 | |
| Day Percent Change: -1.94% Day Change: -0.39 | |
| Week Change: -0.25% Year-to-date Change: -15.7% | |
| AKRO Links: Profile News Message Board | |
| Charts:- Daily , Weekly | |
| Add AKRO to Watchlist: View: Get Complete AKRO Trend Analysis ➞ | |
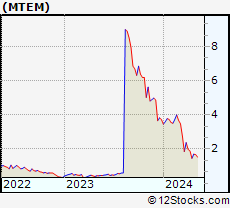 | MTEM Molecular Templates, Inc. |
| Sector: Health Care | |
| SubSector: Biotechnology | |
| MarketCap: 662.785 Millions | |
| Recent Price: 1.73 Smart Investing & Trading Score: 24 | |
| Day Percent Change: 4.85% Day Change: 0.08 | |
| Week Change: 1.47% Year-to-date Change: -53.6% | |
| MTEM Links: Profile News Message Board | |
| Charts:- Daily , Weekly | |
| Add MTEM to Watchlist: View: Get Complete MTEM Trend Analysis ➞ | |
 | TCMD Tactile Systems Technology, Inc. |
| Sector: Health Care | |
| SubSector: Medical Instruments & Supplies | |
| MarketCap: 655.96 Millions | |
| Recent Price: 14.43 Smart Investing & Trading Score: 32 | |
| Day Percent Change: 0.63% Day Change: 0.09 | |
| Week Change: 0.91% Year-to-date Change: 0.9% | |
| TCMD Links: Profile News Message Board | |
| Charts:- Daily , Weekly | |
| Add TCMD to Watchlist: View: Get Complete TCMD Trend Analysis ➞ | |
 | AMPH Amphastar Pharmaceuticals, Inc. |
| Sector: Health Care | |
| SubSector: Drug Manufacturers - Other | |
| MarketCap: 655.533 Millions | |
| Recent Price: 42.63 Smart Investing & Trading Score: 64 | |
| Day Percent Change: 1.30% Day Change: 0.55 | |
| Week Change: 3.69% Year-to-date Change: -31.1% | |
| AMPH Links: Profile News Message Board | |
| Charts:- Daily , Weekly | |
| Add AMPH to Watchlist: View: Get Complete AMPH Trend Analysis ➞ | |
 | CYTK Cytokinetics, Incorporated |
| Sector: Health Care | |
| SubSector: Biotechnology | |
| MarketCap: 654.285 Millions | |
| Recent Price: 64.34 Smart Investing & Trading Score: 32 | |
| Day Percent Change: 1.53% Day Change: 0.97 | |
| Week Change: -1.53% Year-to-date Change: -22.9% | |
| CYTK Links: Profile News Message Board | |
| Charts:- Daily , Weekly | |
| Add CYTK to Watchlist: View: Get Complete CYTK Trend Analysis ➞ | |
 | GOSS Gossamer Bio, Inc. |
| Sector: Health Care | |
| SubSector: Biotechnology | |
| MarketCap: 653.285 Millions | |
| Recent Price: 0.76 Smart Investing & Trading Score: 42 | |
| Day Percent Change: 7.96% Day Change: 0.06 | |
| Week Change: 14.34% Year-to-date Change: -16.3% | |
| GOSS Links: Profile News Message Board | |
| Charts:- Daily , Weekly | |
| Add GOSS to Watchlist: View: Get Complete GOSS Trend Analysis ➞ | |
 | RYTM Rhythm Pharmaceuticals, Inc. |
| Sector: Health Care | |
| SubSector: Biotechnology | |
| MarketCap: 643.685 Millions | |
| Recent Price: 41.02 Smart Investing & Trading Score: 64 | |
| Day Percent Change: -0.99% Day Change: -0.41 | |
| Week Change: 7.16% Year-to-date Change: -10.8% | |
| RYTM Links: Profile News Message Board | |
| Charts:- Daily , Weekly | |
| Add RYTM to Watchlist: View: Get Complete RYTM Trend Analysis ➞ | |
 | APLT Applied Therapeutics, Inc. |
| Sector: Health Care | |
| SubSector: Biotechnology | |
| MarketCap: 641.285 Millions | |
| Recent Price: 4.52 Smart Investing & Trading Score: 32 | |
| Day Percent Change: 1.80% Day Change: 0.08 | |
| Week Change: 5.61% Year-to-date Change: 34.9% | |
| APLT Links: Profile News Message Board | |
| Charts:- Daily , Weekly | |
| Add APLT to Watchlist: View: Get Complete APLT Trend Analysis ➞ | |
 | SHCR Sharecare, Inc. |
| Sector: Health Care | |
| SubSector: Health Information Services | |
| MarketCap: 640 Millions | |
| Recent Price: 0.75 Smart Investing & Trading Score: 32 | |
| Day Percent Change: 3.09% Day Change: 0.02 | |
| Week Change: -7.37% Year-to-date Change: -30.9% | |
| SHCR Links: Profile News Message Board | |
| Charts:- Daily , Weekly | |
| Add SHCR to Watchlist: View: Get Complete SHCR Trend Analysis ➞ | |
 | CGEN Compugen Ltd. |
| Sector: Health Care | |
| SubSector: Biotechnology | |
| MarketCap: 634.285 Millions | |
| Recent Price: 2.15 Smart Investing & Trading Score: 64 | |
| Day Percent Change: 8.04% Day Change: 0.16 | |
| Week Change: 11.98% Year-to-date Change: 8.6% | |
| CGEN Links: Profile News Message Board | |
| Charts:- Daily , Weekly | |
| Add CGEN to Watchlist: View: Get Complete CGEN Trend Analysis ➞ | |
 | SPRY ARS Pharmaceuticals, Inc. |
| Sector: Health Care | |
| SubSector: Biotechnology | |
| MarketCap: 632 Millions | |
| Recent Price: 9.19 Smart Investing & Trading Score: 90 | |
| Day Percent Change: -1.39% Day Change: -0.13 | |
| Week Change: 9.93% Year-to-date Change: 61.7% | |
| SPRY Links: Profile News Message Board | |
| Charts:- Daily , Weekly | |
| Add SPRY to Watchlist: View: Get Complete SPRY Trend Analysis ➞ | |
 | AVRO AVROBIO, Inc. |
| Sector: Health Care | |
| SubSector: Biotechnology | |
| MarketCap: 626.185 Millions | |
| Recent Price: 1.23 Smart Investing & Trading Score: 42 | |
| Day Percent Change: 0.82% Day Change: 0.01 | |
| Week Change: 1.65% Year-to-date Change: -9.6% | |
| AVRO Links: Profile News Message Board | |
| Charts:- Daily , Weekly | |
| Add AVRO to Watchlist: View: Get Complete AVRO Trend Analysis ➞ | |
| For tabular summary view of above stock list: Summary View ➞ 0 - 25 , 25 - 50 , 50 - 75 , 75 - 100 , 100 - 125 , 125 - 150 , 150 - 175 , 175 - 200 , 200 - 225 , 225 - 250 , 250 - 275 , 275 - 300 , 300 - 325 , 325 - 350 , 350 - 375 , 375 - 400 , 400 - 425 , 425 - 450 , 450 - 475 , 475 - 500 , 500 - 525 , 525 - 550 , 550 - 575 , 575 - 600 , 600 - 625 , 625 - 650 , 650 - 675 , 675 - 700 , 700 - 725 | ||
| Click To Change The Sort Order: By Market Cap or Company Size Performance: Year-to-date, Week and Day | |
| Select Chart Type: | ||
|
Best Stocks Today 12Stocks.com |
© 2024 12Stocks.com Terms & Conditions Privacy Contact Us
All Information Provided Only For Education And Not To Be Used For Investing or Trading. See Terms & Conditions


One More Thing ... Get Best Stocks Delivered Daily!
Never Ever Miss A Move With Our Top Ten Stocks Lists
Find Best Stocks In Any Market - Bull or Bear Market
Take A Peek At Our Top Ten Stocks Lists: Daily, Weekly, Year-to-Date & Top Trends
Find Best Stocks In Any Market - Bull or Bear Market
Take A Peek At Our Top Ten Stocks Lists: Daily, Weekly, Year-to-Date & Top Trends
Healthcare Stocks With Best Up Trends [0-bearish to 100-bullish]: Emergent Bio[100], Lantheus [100], Blueprint Medicines[100], Glaukos [100], TransMedics [100], Corcept [100], Avanos [100], IRadimed [100], Castle Biosciences[100], Anika [100], Surmodics [100]
Best Healthcare Stocks Year-to-Date:
Pieris [6064.83%], Avenue [2924.84%], Precision BioSciences[2842.47%], Inovio [2249.02%], Assembly Biosciences[1493.71%], Agenus [1414.68%], Aurora Cannabis[1362.62%], NuCana [1245.5%], Adverum Biotechnologies[1228.37%], Affimed N.V[740%], CareMax [674.23%] Best Healthcare Stocks This Week:
CytomX [182.08%], GeneDx [75.99%], Deciphera [73.17%], Emergent Bio[71.88%], P3 Health[38.51%], Cue Biopharma[36.26%], TransMedics [35.13%], Seres [33.33%], Surmodics [31.94%], Phibro Animal[31.58%], Poseida [31.22%] Best Healthcare Stocks Daily:
Emergent Bio[70.98%], Pulmonx [21.37%], Regencell Bioscience[21.25%], Orchestra BioMed[18.83%], Ocular Therapeutix[16.53%], Lantheus [16.01%], Cellectis S.A[14.75%], Butterfly Network[13.09%], Blueprint Medicines[12.75%], Moderna [12.70%], Mustang Bio[12.65%]