
 Login Sign Up


| |||||
 |  | ||||

| 12Stocks.com Market Intelligence |
Best Financial Stocks
| In a hurry? Financial Stocks Lists: Performance Trends Table, Stock Charts
Sort Financial stocks: Daily, Weekly, Year-to-Date, Market Cap & Trends. Filter Financial stocks list by size:All Financial Large Mid-Range Small & MicroCap |
| 12Stocks.com Financial Stocks Performances & Trends Daily | |||||||||
|
|  The overall Smart Investing & Trading Score is 90 (0-bearish to 100-bullish) which puts Financial sector in short term bullish trend. The Smart Investing & Trading Score from previous trading session is 60 and an improvement of trend continues.
| ||||||||
Here are the Smart Investing & Trading Scores of the most requested Financial stocks at 12Stocks.com (click stock name for detailed review):
|


| 12Stocks.com: Investing in Financial sector with Stocks | |
|
The following table helps investors and traders sort through current performance and trends (as measured by Smart Investing & Trading Score) of various
stocks in the Financial sector. Quick View: Move mouse or cursor over stock symbol (ticker) to view short-term Technical chart and over stock name to view long term chart. Click on  to add stock symbol to your watchlist and to add stock symbol to your watchlist and  to view watchlist. Click on any ticker or stock name for detailed market intelligence report for that stock. to view watchlist. Click on any ticker or stock name for detailed market intelligence report for that stock. |
12Stocks.com Performance of Stocks in Financial Sector
| Ticker | Stock Name | Watchlist | Category | Recent Price | Trend Score | Change % | YTD Change% |
| MFC | Manulife |   | Insurance - Life | 31.39 | 40 | 1.16% | 4.99% |
| GLAD | Gladstone Capital | | Closed-End Fund - Debt | 23.57 | 40 | 1.16% | -15.49% |
| FOR | Forestar | | Real Estate - Development | 27.08 | 40 | 1.16% | 5.70% |
| BTX | BlackRock Technology | | Asset Mgmt | 6.99 | 40 | 1.16% | 1.91% |
| ENFC | Entegra | | Regional Banks | 8.85 | 40 | 1.14% | 0.00% |
| AMP | Ameriprise | | Asset Mgmt | 491.39 | 40 | 1.07% | -6.42% |
| KIM | Kimco Realty | | REIT - Retail | 22.17 | 40 | 1.00% | -1.16% |
| TRTX | TPG RE | | REIT - Mortgage | 9.34 | 40 | 0.97% | 15.67% |
| ACGL | Arch Capital | | Insurance - | 88.19 | 40 | 0.96% | -3.49% |
| LPLA | LPL | | Capital Markets | 339.37 | 40 | 0.95% | 3.65% |
| NXR | Nuveen Select | | Closed-End Fund - Debt | 16.71 | 40 | 0.91% | 0.00% |
| EPRT | Essential Properties | | REIT - Retail | 30.19 | 40 | 0.90% | -0.24% |
| FBRC | FBR | | Brokerage | 1.14 | 40 | 0.88% | 0.00% |
| MKL | Markel | | Insurance - Property & Casualty | 1944.60 | 40 | 0.87% | 13.23% |
| IGD | Voya Global | | Closed-End Fund - Foreign | 5.99 | 40 | 0.84% | 17.81% |
| PCH | PotlatchDeltic Corp | | REIT - Specialty | 40.70 | 40 | 0.77% | 6.37% |
| SLF | Sun Life | | Insurance - | 59.46 | 40 | 0.66% | 3.00% |
| MCN | XAI Madison | | Closed-End Fund - Equity | 6.21 | 40 | 0.65% | -1.28% |
| JCE | Nuveen Core | | Closed-End Fund - Equity | 15.64 | 40 | 0.64% | 5.00% |
| BNL | Broadstone Net | | REIT - | 18.55 | 40 | 0.60% | 22.48% |
| FDEF | First Defiance | | S&L | 23.26 | 40 | 0.52% | 0.00% |
| TRCB | Two River | | Regional Banks | 14.23 | 40 | 0.49% | 0.00% |
| CACB | Cascade Bancorp | | Regional Banks | 4.17 | 40 | 0.48% | 0.00% |
| BME | BlackRock Health | | Closed-End Fund - Equity | 36.51 | 40 | 0.47% | 2.29% |
| GBLI | Global Indemnity | | Insurance - Property & Casualty | 29.86 | 40 | 0.46% | -15.92% |
| For chart view version of above stock list: Chart View ➞ 0 - 25 , 25 - 50 , 50 - 75 , 75 - 100 , 100 - 125 , 125 - 150 , 150 - 175 , 175 - 200 , 200 - 225 , 225 - 250 , 250 - 275 , 275 - 300 , 300 - 325 , 325 - 350 , 350 - 375 , 375 - 400 , 400 - 425 , 425 - 450 , 450 - 475 , 475 - 500 , 500 - 525 , 525 - 550 , 550 - 575 , 575 - 600 , 600 - 625 , 625 - 650 , 650 - 675 , 675 - 700 , 700 - 725 , 725 - 750 , 750 - 775 , 775 - 800 , 800 - 825 , 825 - 850 , 850 - 875 , 875 - 900 , 900 - 925 , 925 - 950 , 950 - 975 , 975 - 1000 , 1000 - 1025 , 1025 - 1050 , 1050 - 1075 , 1075 - 1100 , 1100 - 1125 , 1125 - 1150 , 1150 - 1175 , 1175 - 1200 , 1200 - 1225 , 1225 - 1250 , 1250 - 1275 , 1275 - 1300 , 1300 - 1325 , 1325 - 1350 , 1350 - 1375 , 1375 - 1400 , 1400 - 1425 , 1425 - 1450 , 1450 - 1475 , 1475 - 1500 , 1500 - 1525 , 1525 - 1550 | ||
 | Click To Change The Sort Order: By Market Cap or Company Size Performance: Year-to-date, Week and Day |  |
|
Get the most comprehensive stock market coverage daily at 12Stocks.com ➞ Best Stocks Today ➞ Best Stocks Weekly ➞ Best Stocks Year-to-Date ➞ Best Stocks Trends ➞  Best Stocks Today 12Stocks.com Best Nasdaq Stocks ➞ Best S&P 500 Stocks ➞ Best Tech Stocks ➞ Best Biotech Stocks ➞ |
| Detailed Overview of Financial Stocks |
| Financial Technical Overview, Leaders & Laggards, Top Financial ETF Funds & Detailed Financial Stocks List, Charts, Trends & More |
| Financial Sector: Technical Analysis, Trends & YTD Performance | |
| Financial sector is composed of stocks
from banks, brokers, insurance, REITs
and services subsectors. Financial sector, as represented by XLF, an exchange-traded fund [ETF] that holds basket of Financial stocks (e.g, Bank of America, Goldman Sachs) is up by 13.0735% and is currently underperforming the overall market by -0.7866% year-to-date. Below is a quick view of Technical charts and trends: |
|
 XLF Weekly Chart |
|
| Long Term Trend: Good | |
| Medium Term Trend: Good | |
 XLF Daily Chart |
|
| Short Term Trend: Very Good | |
| Overall Trend Score: 90 | |
| YTD Performance: 13.0735% | |
| **Trend Scores & Views Are Only For Educational Purposes And Not For Investing | |
| 12Stocks.com: Top Performing Financial Sector Stocks | |||||||||||||||||||||||||||||||||||||||||||||||
 The top performing Financial sector stocks year to date are
Now, more recently, over last week, the top performing Financial sector stocks on the move are


|
|||||||||||||||||||||||||||||||||||||||||||||||
| 12Stocks.com: Investing in Financial Sector using Exchange Traded Funds | |
|
The following table shows list of key exchange traded funds (ETF) that
help investors track Financial Index. For detailed view, check out our ETF Funds section of our website. Quick View: Move mouse or cursor over ETF symbol (ticker) to view short-term Technical chart and over ETF name to view long term chart. Click on ticker or stock name for detailed view. Click on to add stock symbol to your watchlist and to view watchlist. |
12Stocks.com List of ETFs that track Financial Index
| Ticker | ETF Name | Watchlist | Recent Price | Smart Investing & Trading Score | Change % | Week % | Year-to-date % |
| CHIX | China Financials | | 10.57 | 20 | 0 | 0 | 0% |
| 12Stocks.com: Charts, Trends, Fundamental Data and Performances of Financial Stocks | |
|
We now take in-depth look at all Financial stocks including charts, multi-period performances and overall trends (as measured by Smart Investing & Trading Score). One can sort Financial stocks (click link to choose) by Daily, Weekly and by Year-to-Date performances. Also, one can sort by size of the company or by market capitalization. |
| Select Your Default Chart Type: | |||||
| |||||
| Click on stock symbol or name for detailed view. Click on to add stock symbol to your watchlist and to view watchlist. Quick View: Move mouse or cursor over "Daily" to quickly view daily Technical stock chart and over "Weekly" to view weekly Technical stock chart. | |||||

 | MFC Manulife Financial Corp |
| Sector: Financials | |
| SubSector: Insurance - Life | |
| MarketCap: 52077.2 Millions | |
| Recent Price: 31.39 Smart Investing & Trading Score: 40 | |
| Day Percent Change: 1.16017% Day Change: -0.02 | |
| Week Change: 1.68448% Year-to-date Change: 5.0% | |
| MFC Links: Profile News Message Board | |
| Charts:- Daily , Weekly | |
| Add MFC to Watchlist: View: Get Complete MFC Trend Analysis ➞ | |
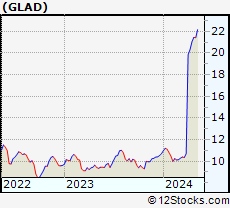 | GLAD Gladstone Capital Corp |
| Sector: Financials | |
| SubSector: Closed-End Fund - Debt | |
| MarketCap: 581.69 Millions | |
| Recent Price: 23.57 Smart Investing & Trading Score: 40 | |
| Day Percent Change: 1.1588% Day Change: 0.02 | |
| Week Change: 1.63864% Year-to-date Change: -15.5% | |
| GLAD Links: Profile News Message Board | |
| Charts:- Daily , Weekly | |
| Add GLAD to Watchlist: View: Get Complete GLAD Trend Analysis ➞ | |
 | FOR Forestar Group Inc |
| Sector: Financials | |
| SubSector: Real Estate - Development | |
| MarketCap: 1459.93 Millions | |
| Recent Price: 27.08 Smart Investing & Trading Score: 40 | |
| Day Percent Change: 1.15801% Day Change: -0.06 | |
| Week Change: -1.9551% Year-to-date Change: 5.7% | |
| FOR Links: Profile News Message Board | |
| Charts:- Daily , Weekly | |
| Add FOR to Watchlist: View: Get Complete FOR Trend Analysis ➞ | |
 | BTX BlackRock Technology and Private Equity Term Trust |
| Sector: Financials | |
| SubSector: Asset Management | |
| MarketCap: 1497.63 Millions | |
| Recent Price: 6.99 Smart Investing & Trading Score: 40 | |
| Day Percent Change: 1.15774% Day Change: -0.04 | |
| Week Change: -1.82584% Year-to-date Change: 1.9% | |
| BTX Links: Profile News Message Board | |
| Charts:- Daily , Weekly | |
| Add BTX to Watchlist: View: Get Complete BTX Trend Analysis ➞ | |
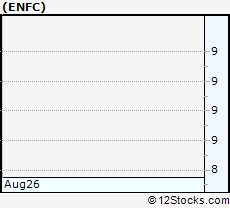 | ENFC Entegra Financial Corp. |
| Sector: Financials | |
| SubSector: Regional - Southeast Banks | |
| MarketCap: 148.81 Millions | |
| Recent Price: 8.85 Smart Investing & Trading Score: 40 | |
| Day Percent Change: 1.14286% Day Change: -9999 | |
| Week Change: -71.4792% Year-to-date Change: 0.0% | |
| ENFC Links: Profile News Message Board | |
| Charts:- Daily , Weekly | |
| Add ENFC to Watchlist: View: Get Complete ENFC Trend Analysis ➞ | |
 | AMP Ameriprise Financial Inc |
| Sector: Financials | |
| SubSector: Asset Management | |
| MarketCap: 46125.2 Millions | |
| Recent Price: 491.39 Smart Investing & Trading Score: 40 | |
| Day Percent Change: 1.0737% Day Change: 6.87 | |
| Week Change: -0.123984% Year-to-date Change: -6.4% | |
| AMP Links: Profile News Message Board | |
| Charts:- Daily , Weekly | |
| Add AMP to Watchlist: View: Get Complete AMP Trend Analysis ➞ | |
 | KIM Kimco Realty Corporation |
| Sector: Financials | |
| SubSector: REIT - Retail | |
| MarketCap: 15413.1 Millions | |
| Recent Price: 22.17 Smart Investing & Trading Score: 40 | |
| Day Percent Change: 1.00228% Day Change: 0.23 | |
| Week Change: -0.58296% Year-to-date Change: -1.2% | |
| KIM Links: Profile News Message Board | |
| Charts:- Daily , Weekly | |
| Add KIM to Watchlist: View: Get Complete KIM Trend Analysis ➞ | |
 | TRTX TPG RE Finance Trust Inc |
| Sector: Financials | |
| SubSector: REIT - Mortgage | |
| MarketCap: 760.76 Millions | |
| Recent Price: 9.34 Smart Investing & Trading Score: 40 | |
| Day Percent Change: 0.972973% Day Change: -0.16 | |
| Week Change: -1.37276% Year-to-date Change: 15.7% | |
| TRTX Links: Profile News Message Board | |
| Charts:- Daily , Weekly | |
| Add TRTX to Watchlist: View: Get Complete TRTX Trend Analysis ➞ | |
 | ACGL Arch Capital Group Ltd |
| Sector: Financials | |
| SubSector: Insurance - Diversified | |
| MarketCap: 34071.3 Millions | |
| Recent Price: 88.19 Smart Investing & Trading Score: 40 | |
| Day Percent Change: 0.961649% Day Change: 1.3 | |
| Week Change: -2.66004% Year-to-date Change: -3.5% | |
| ACGL Links: Profile News Message Board | |
| Charts:- Daily , Weekly | |
| Add ACGL to Watchlist: View: Get Complete ACGL Trend Analysis ➞ | |
 | LPLA LPL Financial Holdings Inc |
| Sector: Financials | |
| SubSector: Capital Markets | |
| MarketCap: 26640.6 Millions | |
| Recent Price: 339.37 Smart Investing & Trading Score: 40 | |
| Day Percent Change: 0.945894% Day Change: 5.58 | |
| Week Change: -0.728368% Year-to-date Change: 3.6% | |
| LPLA Links: Profile News Message Board | |
| Charts:- Daily , Weekly | |
| Add LPLA to Watchlist: View: Get Complete LPLA Trend Analysis ➞ | |
 | NXR Nuveen Select Tax-Free Income Portfolio 3 |
| Sector: Financials | |
| SubSector: Closed-End Fund - Debt | |
| MarketCap: 185.707 Millions | |
| Recent Price: 16.71 Smart Investing & Trading Score: 40 | |
| Day Percent Change: 0.905797% Day Change: -9999 | |
| Week Change: 0.392317% Year-to-date Change: 0.0% | |
| NXR Links: Profile News Message Board | |
| Charts:- Daily , Weekly | |
| Add NXR to Watchlist: View: Get Complete NXR Trend Analysis ➞ | |
 | EPRT Essential Properties Realty Trust Inc |
| Sector: Financials | |
| SubSector: REIT - Retail | |
| MarketCap: 6119.76 Millions | |
| Recent Price: 30.19 Smart Investing & Trading Score: 40 | |
| Day Percent Change: 0.902406% Day Change: 0.04 | |
| Week Change: 1.68407% Year-to-date Change: -0.2% | |
| EPRT Links: Profile News Message Board | |
| Charts:- Daily , Weekly | |
| Add EPRT to Watchlist: View: Get Complete EPRT Trend Analysis ➞ | |
 | FBRC FBR & Co. |
| Sector: Financials | |
| SubSector: Investment Brokerage - National | |
| MarketCap: 123.34 Millions | |
| Recent Price: 1.14 Smart Investing & Trading Score: 40 | |
| Day Percent Change: 0.884956% Day Change: -9999 | |
| Week Change: 65.2174% Year-to-date Change: 0.0% | |
| FBRC Links: Profile News Message Board | |
| Charts:- Daily , Weekly | |
| Add FBRC to Watchlist: View: Get Complete FBRC Trend Analysis ➞ | |
 | MKL Markel Group Inc |
| Sector: Financials | |
| SubSector: Insurance - Property & Casualty | |
| MarketCap: 24192.3 Millions | |
| Recent Price: 1944.60 Smart Investing & Trading Score: 40 | |
| Day Percent Change: 0.869367% Day Change: 19.75 | |
| Week Change: 1.24223% Year-to-date Change: 13.2% | |
| MKL Links: Profile News Message Board | |
| Charts:- Daily , Weekly | |
| Add MKL to Watchlist: View: Get Complete MKL Trend Analysis ➞ | |
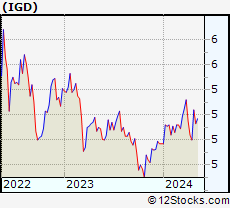 | IGD Voya Global Equity Dividend and Premium Opportunity Fund |
| Sector: Financials | |
| SubSector: Closed-End Fund - Foreign | |
| MarketCap: 466.11 Millions | |
| Recent Price: 5.99 Smart Investing & Trading Score: 40 | |
| Day Percent Change: 0.841751% Day Change: -0.02 | |
| Week Change: 1.35364% Year-to-date Change: 17.8% | |
| IGD Links: Profile News Message Board | |
| Charts:- Daily , Weekly | |
| Add IGD to Watchlist: View: Get Complete IGD Trend Analysis ➞ | |
 | PCH PotlatchDeltic Corp |
| Sector: Financials | |
| SubSector: REIT - Specialty | |
| MarketCap: 3313.25 Millions | |
| Recent Price: 40.70 Smart Investing & Trading Score: 40 | |
| Day Percent Change: 0.767517% Day Change: -0.35 | |
| Week Change: -2.0693% Year-to-date Change: 6.4% | |
| PCH Links: Profile News Message Board | |
| Charts:- Daily , Weekly | |
| Add PCH to Watchlist: View: Get Complete PCH Trend Analysis ➞ | |
 | SLF Sun Life Financial, Inc |
| Sector: Financials | |
| SubSector: Insurance - Diversified | |
| MarketCap: 32445.3 Millions | |
| Recent Price: 59.46 Smart Investing & Trading Score: 40 | |
| Day Percent Change: 0.660234% Day Change: 0.16 | |
| Week Change: 1.32924% Year-to-date Change: 3.0% | |
| SLF Links: Profile News Message Board | |
| Charts:- Daily , Weekly | |
| Add SLF to Watchlist: View: Get Complete SLF Trend Analysis ➞ | |
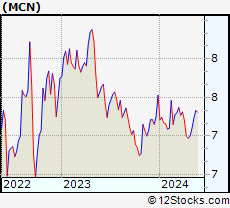 | MCN XAI Madison Equity Premium Income Fund |
| Sector: Financials | |
| SubSector: Closed-End Fund - Equity | |
| MarketCap: 132.4 Millions | |
| Recent Price: 6.21 Smart Investing & Trading Score: 40 | |
| Day Percent Change: 0.648298% Day Change: -0.08 | |
| Week Change: -0.480769% Year-to-date Change: -1.3% | |
| MCN Links: Profile News Message Board | |
| Charts:- Daily , Weekly | |
| Add MCN to Watchlist: View: Get Complete MCN Trend Analysis ➞ | |
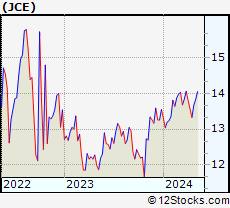 | JCE Nuveen Core Equity Alpha Fund |
| Sector: Financials | |
| SubSector: Closed-End Fund - Equity | |
| MarketCap: 264.96 Millions | |
| Recent Price: 15.64 Smart Investing & Trading Score: 40 | |
| Day Percent Change: 0.643501% Day Change: -0.09 | |
| Week Change: -0.82435% Year-to-date Change: 5.0% | |
| JCE Links: Profile News Message Board | |
| Charts:- Daily , Weekly | |
| Add JCE to Watchlist: View: Get Complete JCE Trend Analysis ➞ | |
 | BNL Broadstone Net Lease Inc |
| Sector: Financials | |
| SubSector: REIT - Diversified | |
| MarketCap: 3532.95 Millions | |
| Recent Price: 18.55 Smart Investing & Trading Score: 40 | |
| Day Percent Change: 0.596529% Day Change: 0.41 | |
| Week Change: -0.37594% Year-to-date Change: 22.5% | |
| BNL Links: Profile News Message Board | |
| Charts:- Daily , Weekly | |
| Add BNL to Watchlist: View: Get Complete BNL Trend Analysis ➞ | |
 | FDEF First Defiance Financial Corp. |
| Sector: Financials | |
| SubSector: Savings & Loans | |
| MarketCap: 542.73 Millions | |
| Recent Price: 23.26 Smart Investing & Trading Score: 40 | |
| Day Percent Change: 0.518583% Day Change: -9999 | |
| Week Change: 0% Year-to-date Change: 0.0% | |
| FDEF Links: Profile News Message Board | |
| Charts:- Daily , Weekly | |
| Add FDEF to Watchlist: View: Get Complete FDEF Trend Analysis ➞ | |
 | TRCB Two River Bancorp |
| Sector: Financials | |
| SubSector: Regional - Northeast Banks | |
| MarketCap: 148.09 Millions | |
| Recent Price: 14.23 Smart Investing & Trading Score: 40 | |
| Day Percent Change: 0.49435% Day Change: -9999 | |
| Week Change: -19.6045% Year-to-date Change: 0.0% | |
| TRCB Links: Profile News Message Board | |
| Charts:- Daily , Weekly | |
| Add TRCB to Watchlist: View: Get Complete TRCB Trend Analysis ➞ | |
 | CACB Cascade Bancorp |
| Sector: Financials | |
| SubSector: Regional - Pacific Banks | |
| MarketCap: 616.14 Millions | |
| Recent Price: 4.17 Smart Investing & Trading Score: 40 | |
| Day Percent Change: 0.481928% Day Change: -9999 | |
| Week Change: 1.45985% Year-to-date Change: 0.0% | |
| CACB Links: Profile News Message Board | |
| Charts:- Daily , Weekly | |
| Add CACB to Watchlist: View: Get Complete CACB Trend Analysis ➞ | |
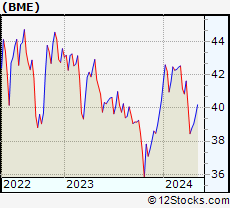 | BME BlackRock Health Sciences Trust |
| Sector: Financials | |
| SubSector: Closed-End Fund - Equity | |
| MarketCap: 479.87 Millions | |
| Recent Price: 36.51 Smart Investing & Trading Score: 40 | |
| Day Percent Change: 0.467804% Day Change: 0.07 | |
| Week Change: -1.64332% Year-to-date Change: 2.3% | |
| BME Links: Profile News Message Board | |
| Charts:- Daily , Weekly | |
| Add BME to Watchlist: View: Get Complete BME Trend Analysis ➞ | |
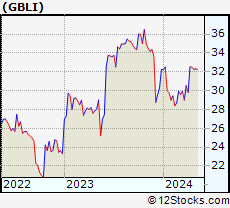 | GBLI Global Indemnity Group LLC |
| Sector: Financials | |
| SubSector: Insurance - Property & Casualty | |
| MarketCap: 428.89 Millions | |
| Recent Price: 29.86 Smart Investing & Trading Score: 40 | |
| Day Percent Change: 0.464929% Day Change: 0.2 | |
| Week Change: 1.83668% Year-to-date Change: -15.9% | |
| GBLI Links: Profile News Message Board | |
| Charts:- Daily , Weekly | |
| Add GBLI to Watchlist: View: Get Complete GBLI Trend Analysis ➞ | |
| For tabular summary view of above stock list: Summary View ➞ 0 - 25 , 25 - 50 , 50 - 75 , 75 - 100 , 100 - 125 , 125 - 150 , 150 - 175 , 175 - 200 , 200 - 225 , 225 - 250 , 250 - 275 , 275 - 300 , 300 - 325 , 325 - 350 , 350 - 375 , 375 - 400 , 400 - 425 , 425 - 450 , 450 - 475 , 475 - 500 , 500 - 525 , 525 - 550 , 550 - 575 , 575 - 600 , 600 - 625 , 625 - 650 , 650 - 675 , 675 - 700 , 700 - 725 , 725 - 750 , 750 - 775 , 775 - 800 , 800 - 825 , 825 - 850 , 850 - 875 , 875 - 900 , 900 - 925 , 925 - 950 , 950 - 975 , 975 - 1000 , 1000 - 1025 , 1025 - 1050 , 1050 - 1075 , 1075 - 1100 , 1100 - 1125 , 1125 - 1150 , 1150 - 1175 , 1175 - 1200 , 1200 - 1225 , 1225 - 1250 , 1250 - 1275 , 1275 - 1300 , 1300 - 1325 , 1325 - 1350 , 1350 - 1375 , 1375 - 1400 , 1400 - 1425 , 1425 - 1450 , 1450 - 1475 , 1475 - 1500 , 1500 - 1525 , 1525 - 1550 | ||
| Click To Change The Sort Order: By Market Cap or Company Size Performance: Year-to-date, Week and Day | |
| Select Chart Type: | ||
|
Best Stocks Today 12Stocks.com |
© 2025 12Stocks.com Terms & Conditions Privacy Contact Us
All Information Provided Only For Education And Not To Be Used For Investing or Trading. See Terms & Conditions


One More Thing ... Get Best Stocks Delivered Daily!
Never Ever Miss A Move With Our Top Ten Stocks Lists
Find Best Stocks In Any Market - Bull or Bear Market
Take A Peek At Our Top Ten Stocks Lists: Daily, Weekly, Year-to-Date & Top Trends
Find Best Stocks In Any Market - Bull or Bear Market
Take A Peek At Our Top Ten Stocks Lists: Daily, Weekly, Year-to-Date & Top Trends
Financial Stocks With Best Up Trends [0-bearish to 100-bullish]: Better Home[100], AMREP Corp[100], PIMCO California[100], Torchmark [100], PIMCO California[100], Triumph Bancorp[100], StepStone [100], Radian [100], National Bank[100], PIMCO Municipal[100], MARA [100]
Best Financial Stocks Year-to-Date:
Insight Select[12384.6%], Oxford Lane[292.479%], Better Home[250.328%], Metalpha Technology[213.274%], Robinhood Markets[206.567%], Cipher Mining[145.528%], Mr. Cooper[133.957%], Banco Santander[130.037%], IHS Holding[117.61%], Deutsche Bank[114.776%], LoanDepot [110.733%] Best Financial Stocks This Week:
Colony Starwood[15929900%], Blackhawk Network[91300%], Macquarie Global[81662.9%], Credit Suisse[63241.6%], Pennsylvania Real[23823%], First Republic[22570.9%], Select ome[14000%], CorEnergy Infrastructure[6797.78%], FedNat Holding[5525%], BlackRock Municipal[5340%], BlackRock MuniYield[3379.04%] Best Financial Stocks Daily:
Better Home[13.3451%], AMREP Corp[11.992%], PIMCO California[11.9545%], Torchmark [11.8363%], Forge Global[11.5409%], PIMCO California[11.4754%], BlackRock Muni[10.8108%], Blackrock MuniYield[10.72%], Triumph Bancorp[10.2661%], StepStone [8.74771%], BlackRock MuniYield[8.15348%]