
 Login Sign Up


| |||||
 |  | ||||

| 12Stocks.com Market Intelligence |
Best Financial Stocks
| In a hurry? Financial Stocks Lists: Performance Trends Table, Stock Charts
Sort Financial stocks: Daily, Weekly, Year-to-Date, Market Cap & Trends. Filter Financial stocks list by size:All Financial Large Mid-Range Small & MicroCap |
| 12Stocks.com Financial Stocks Performances & Trends Daily | |||||||||
|
|  The overall Smart Investing & Trading Score is 33 (0-bearish to 100-bullish) which puts Financial sector in short term bearish to neutral trend. The Smart Investing & Trading Score from previous trading session is 26 and hence an improvement of trend.
| ||||||||
Here are the Smart Investing & Trading Scores of the most requested Financial stocks at 12Stocks.com (click stock name for detailed review):
|


| 12Stocks.com: Investing in Financial sector with Stocks | |
|
The following table helps investors and traders sort through current performance and trends (as measured by Smart Investing & Trading Score) of various
stocks in the Financial sector. Quick View: Move mouse or cursor over stock symbol (ticker) to view short-term Technical chart and over stock name to view long term chart. Click on  to add stock symbol to your watchlist and to add stock symbol to your watchlist and  to view watchlist. Click on any ticker or stock name for detailed market intelligence report for that stock. to view watchlist. Click on any ticker or stock name for detailed market intelligence report for that stock. |
12Stocks.com Performance of Stocks in Financial Sector
| Ticker | Stock Name | Watchlist | Category | Recent Price | Trend Score | Change % | YTD Change% |
| VBTX | Veritex |   | Regional - Southwest Banks | 31.40 | 43 | 1.55% | 16.48% |
| BANC | Banc of California | | Regional Banks | 14.38 | 43 | 1.55% | -6.29% |
| FHN | First Horizon | | Regional Banks | 21.67 | 43 | 1.55% | 8.48% |
| CATY | Cathay General | | Regional Banks | 45.52 | 43 | 1.54% | -3.68% |
| THFF | First | | Regional Banks | 53.23 | 43 | 1.51% | 17.76% |
| ACNB | ACNB | | Regional - Southwest Banks | 41.95 | 43 | 1.50% | 6.16% |
| AXP | American Express | | Credit Services | 298.59 | 43 | 1.47% | 1.18% |
| HBAN | Huntington Bancshares | | Regional Banks | 16.27 | 43 | 1.43% | 1.05% |
| WAL | Western Alliance | | Regional Banks | 77.40 | 43 | 1.40% | -6.94% |
| ZION | Zions Ban | | Regional Banks | 52.76 | 43 | 1.31% | -1.99% |
| TSBK | Timberland Bancorp | | S&L | 31.37 | 43 | 1.29% | 3.66% |
| SFBS | ServisFirst Bancshares | | Foreign Banks | 78.28 | 43 | 1.25% | -6.88% |
| ASB | Associated Banc-Corp | | Regional Banks | 24.39 | 43 | 1.25% | 3.00% |
| EWBC | East West | | Foreign Banks | 100.03 | 43 | 1.24% | 5.07% |
| FMNB | Farmers National | | Regional Banks | 13.35 | 43 | 1.21% | -4.88% |
| MC | Moelis & | | Asset Mgmt | 69.38 | 43 | 1.17% | -5.28% |
| RF | Regions | | Regional Banks | 25.18 | 43 | 1.17% | 8.20% |
| LOB | Live Oak | | S&L | 31.35 | 43 | 1.10% | -20.66% |
| HMST | HomeStreet | | S&L | 13.05 | 43 | 1.08% | 14.27% |
| DCOM | Dime Community | | S&L | 27.42 | 43 | 1.07% | -9.19% |
| WSFS | WSFS | | Regional Banks | 54.27 | 43 | 0.95% | 2.40% |
| MBWM | Mercantile Bank | | Regional Banks | 44.85 | 43 | 0.92% | 1.63% |
| TRMK | Trustmark | | Regional Banks | 36.89 | 43 | 0.90% | 4.99% |
| SSB | South State | | Regional Banks | 93.59 | 43 | 0.89% | -5.45% |
| FULT | Fulton | | Regional Banks | 17.76 | 43 | 0.79% | -6.96% |
| For chart view version of above stock list: Chart View ➞ 0 - 25 , 25 - 50 , 50 - 75 , 75 - 100 , 100 - 125 , 125 - 150 , 150 - 175 , 175 - 200 , 200 - 225 , 225 - 250 , 250 - 275 , 275 - 300 , 300 - 325 , 325 - 350 , 350 - 375 , 375 - 400 , 400 - 425 , 425 - 450 , 450 - 475 , 475 - 500 , 500 - 525 , 525 - 550 , 550 - 575 | ||
 | Click To Change The Sort Order: By Market Cap or Company Size Performance: Year-to-date, Week and Day |  |
|
Get the most comprehensive stock market coverage daily at 12Stocks.com ➞ Best Stocks Today ➞ Best Stocks Weekly ➞ Best Stocks Year-to-Date ➞ Best Stocks Trends ➞  Best Stocks Today 12Stocks.com Best Nasdaq Stocks ➞ Best S&P 500 Stocks ➞ Best Tech Stocks ➞ Best Biotech Stocks ➞ |
| Detailed Overview of Financial Stocks |
| Financial Technical Overview, Leaders & Laggards, Top Financial ETF Funds & Detailed Financial Stocks List, Charts, Trends & More |
| Financial Sector: Technical Analysis, Trends & YTD Performance | |
| Financial sector is composed of stocks
from banks, brokers, insurance, REITs
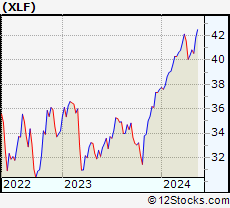
and services subsectors. Financial sector, as represented by XLF, an exchange-traded fund [ETF] that holds basket of Financial stocks (e.g, Bank of America, Goldman Sachs) is up by 7.8% and is currently outperforming the overall market by 0.27% year-to-date. Below is a quick view of Technical charts and trends: |
|
 XLF Weekly Chart |
|
| Long Term Trend: Good | |
| Medium Term Trend: Not Good | |
 XLF Daily Chart |
|
| Short Term Trend: Not Good | |
| Overall Trend Score: 33 | |
| YTD Performance: 7.8% | |
| **Trend Scores & Views Are Only For Educational Purposes And Not For Investing | |
| 12Stocks.com: Top Performing Financial Sector Stocks | ||||||||||||||||||||||||||||||||||||||||||||||||
 The top performing Financial sector stocks year to date are
Now, more recently, over last week, the top performing Financial sector stocks on the move are


|
||||||||||||||||||||||||||||||||||||||||||||||||
| 12Stocks.com: Investing in Financial Sector using Exchange Traded Funds | |
|
The following table shows list of key exchange traded funds (ETF) that
help investors track Financial Index. For detailed view, check out our ETF Funds section of our website. Quick View: Move mouse or cursor over ETF symbol (ticker) to view short-term Technical chart and over ETF name to view long term chart. Click on ticker or stock name for detailed view. Click on to add stock symbol to your watchlist and to view watchlist. |
12Stocks.com List of ETFs that track Financial Index
| Ticker | ETF Name | Watchlist | Recent Price | Smart Investing & Trading Score | Change % | Week % | Year-to-date % |
| XLF | Financial | | 51.91 | 33 | 0.99 | 0.99 | 7.8% |
| IAI | Broker-Dealers & Secs | | 174.97 | 63 | 2.34 | 2.34 | 21.82% |
| KBE | Bank | | 55.98 | 43 | 1.3 | 1.3 | 1.64% |
| FAS | Financial Bull 3X | | 161.82 | 33 | 2.91 | 2.91 | 7.48% |
| FAZ | Financial Bear 3X | | 4.54 | 62 | -2.78 | -2.78 | -27.4% |
| UYG | Financials | | 92.87 | 26 | 1.72 | 1.72 | 9% |
| KIE | Insurance | | 56.42 | 25 | 1.27 | 1.27 | 0.32% |
| 12Stocks.com: Charts, Trends, Fundamental Data and Performances of Financial Stocks | |
|
We now take in-depth look at all Financial stocks including charts, multi-period performances and overall trends (as measured by Smart Investing & Trading Score). One can sort Financial stocks (click link to choose) by Daily, Weekly and by Year-to-Date performances. Also, one can sort by size of the company or by market capitalization. |
| Select Your Default Chart Type: | |||||
| |||||
| Click on stock symbol or name for detailed view. Click on to add stock symbol to your watchlist and to view watchlist. Quick View: Move mouse or cursor over "Daily" to quickly view daily Technical stock chart and over "Weekly" to view weekly Technical stock chart. | |||||

 | VBTX Veritex Holdings, Inc. |
| Sector: Financials | |
| SubSector: Regional - Southwest Banks | |
| MarketCap: 625.165 Millions | |
| Recent Price: 31.40 Smart Investing & Trading Score: 43 | |
| Day Percent Change: 1.55% Day Change: 0.48 | |
| Week Change: 1.55% Year-to-date Change: 16.5% | |
| VBTX Links: Profile News Message Board | |
| Charts:- Daily , Weekly | |
| Add VBTX to Watchlist: View: Get Complete VBTX Trend Analysis ➞ | |
 | BANC Banc of California, Inc. |
| Sector: Financials | |
| SubSector: Regional - Pacific Banks | |
| MarketCap: 459.929 Millions | |
| Recent Price: 14.38 Smart Investing & Trading Score: 43 | |
| Day Percent Change: 1.55% Day Change: 0.22 | |
| Week Change: 1.55% Year-to-date Change: -6.3% | |
| BANC Links: Profile News Message Board | |
| Charts:- Daily , Weekly | |
| Add BANC to Watchlist: View: Get Complete BANC Trend Analysis ➞ | |
 | FHN First Horizon National Corporation |
| Sector: Financials | |
| SubSector: Regional - Southeast Banks | |
| MarketCap: 2661.05 Millions | |
| Recent Price: 21.67 Smart Investing & Trading Score: 43 | |
| Day Percent Change: 1.55% Day Change: 0.33 | |
| Week Change: 1.55% Year-to-date Change: 8.5% | |
| FHN Links: Profile News Message Board | |
| Charts:- Daily , Weekly | |
| Add FHN to Watchlist: View: Get Complete FHN Trend Analysis ➞ | |
 | CATY Cathay General Bancorp |
| Sector: Financials | |
| SubSector: Regional - Pacific Banks | |
| MarketCap: 1781.99 Millions | |
| Recent Price: 45.52 Smart Investing & Trading Score: 43 | |
| Day Percent Change: 1.54% Day Change: 0.69 | |
| Week Change: 1.54% Year-to-date Change: -3.7% | |
| CATY Links: Profile News Message Board | |
| Charts:- Daily , Weekly | |
| Add CATY to Watchlist: View: Get Complete CATY Trend Analysis ➞ | |
 | THFF First Financial Corporation |
| Sector: Financials | |
| SubSector: Regional - Midwest Banks | |
| MarketCap: 433.07 Millions | |
| Recent Price: 53.23 Smart Investing & Trading Score: 43 | |
| Day Percent Change: 1.51% Day Change: 0.79 | |
| Week Change: 1.51% Year-to-date Change: 17.8% | |
| THFF Links: Profile News Message Board | |
| Charts:- Daily , Weekly | |
| Add THFF to Watchlist: View: Get Complete THFF Trend Analysis ➞ | |
 | ACNB ACNB Corporation |
| Sector: Financials | |
| SubSector: Regional - Southwest Banks | |
| MarketCap: 231.065 Millions | |
| Recent Price: 41.95 Smart Investing & Trading Score: 43 | |
| Day Percent Change: 1.5% Day Change: 0.62 | |
| Week Change: 1.5% Year-to-date Change: 6.2% | |
| ACNB Links: Profile News Message Board | |
| Charts:- Daily , Weekly | |
| Add ACNB to Watchlist: View: Get Complete ACNB Trend Analysis ➞ | |
 | AXP American Express Company |
| Sector: Financials | |
| SubSector: Credit Services | |
| MarketCap: 68388 Millions | |
| Recent Price: 298.59 Smart Investing & Trading Score: 43 | |
| Day Percent Change: 1.47% Day Change: 4.32 | |
| Week Change: 1.47% Year-to-date Change: 1.2% | |
| AXP Links: Profile News Message Board | |
| Charts:- Daily , Weekly | |
| Add AXP to Watchlist: View: Get Complete AXP Trend Analysis ➞ | |
 | HBAN Huntington Bancshares Incorporated |
| Sector: Financials | |
| SubSector: Regional - Midwest Banks | |
| MarketCap: 8468.1 Millions | |
| Recent Price: 16.27 Smart Investing & Trading Score: 43 | |
| Day Percent Change: 1.43% Day Change: 0.23 | |
| Week Change: 1.43% Year-to-date Change: 1.1% | |
| HBAN Links: Profile News Message Board | |
| Charts:- Daily , Weekly | |
| Add HBAN to Watchlist: View: Get Complete HBAN Trend Analysis ➞ | |
 | WAL Western Alliance Bancorporation |
| Sector: Financials | |
| SubSector: Regional - Pacific Banks | |
| MarketCap: 2980.09 Millions | |
| Recent Price: 77.40 Smart Investing & Trading Score: 43 | |
| Day Percent Change: 1.4% Day Change: 1.07 | |
| Week Change: 1.4% Year-to-date Change: -6.9% | |
| WAL Links: Profile News Message Board | |
| Charts:- Daily , Weekly | |
| Add WAL to Watchlist: View: Get Complete WAL Trend Analysis ➞ | |
 | ZION Zions Bancorporation, National Association |
| Sector: Financials | |
| SubSector: Regional - Pacific Banks | |
| MarketCap: 4577.89 Millions | |
| Recent Price: 52.76 Smart Investing & Trading Score: 43 | |
| Day Percent Change: 1.31% Day Change: 0.68 | |
| Week Change: 1.31% Year-to-date Change: -2.0% | |
| ZION Links: Profile News Message Board | |
| Charts:- Daily , Weekly | |
| Add ZION to Watchlist: View: Get Complete ZION Trend Analysis ➞ | |
 | TSBK Timberland Bancorp, Inc. |
| Sector: Financials | |
| SubSector: Savings & Loans | |
| MarketCap: 155.03 Millions | |
| Recent Price: 31.37 Smart Investing & Trading Score: 43 | |
| Day Percent Change: 1.29% Day Change: 0.4 | |
| Week Change: 1.29% Year-to-date Change: 3.7% | |
| TSBK Links: Profile News Message Board | |
| Charts:- Daily , Weekly | |
| Add TSBK to Watchlist: View: Get Complete TSBK Trend Analysis ➞ | |
 | SFBS ServisFirst Bancshares, Inc. |
| Sector: Financials | |
| SubSector: Foreign Money Center Banks | |
| MarketCap: 1596.71 Millions | |
| Recent Price: 78.28 Smart Investing & Trading Score: 43 | |
| Day Percent Change: 1.25% Day Change: 0.97 | |
| Week Change: 1.25% Year-to-date Change: -6.9% | |
| SFBS Links: Profile News Message Board | |
| Charts:- Daily , Weekly | |
| Add SFBS to Watchlist: View: Get Complete SFBS Trend Analysis ➞ | |
 | ASB Associated Banc-Corp |
| Sector: Financials | |
| SubSector: Regional - Midwest Banks | |
| MarketCap: 1904.8 Millions | |
| Recent Price: 24.39 Smart Investing & Trading Score: 43 | |
| Day Percent Change: 1.25% Day Change: 0.3 | |
| Week Change: 1.25% Year-to-date Change: 3.0% | |
| ASB Links: Profile News Message Board | |
| Charts:- Daily , Weekly | |
| Add ASB to Watchlist: View: Get Complete ASB Trend Analysis ➞ | |
 | EWBC East West Bancorp, Inc. |
| Sector: Financials | |
| SubSector: Foreign Money Center Banks | |
| MarketCap: 4618.31 Millions | |
| Recent Price: 100.03 Smart Investing & Trading Score: 43 | |
| Day Percent Change: 1.24% Day Change: 1.23 | |
| Week Change: 1.24% Year-to-date Change: 5.1% | |
| EWBC Links: Profile News Message Board | |
| Charts:- Daily , Weekly | |
| Add EWBC to Watchlist: View: Get Complete EWBC Trend Analysis ➞ | |
 | FMNB Farmers National Banc Corp. |
| Sector: Financials | |
| SubSector: Regional - Midwest Banks | |
| MarketCap: 366.57 Millions | |
| Recent Price: 13.35 Smart Investing & Trading Score: 43 | |
| Day Percent Change: 1.21% Day Change: 0.16 | |
| Week Change: 1.21% Year-to-date Change: -4.9% | |
| FMNB Links: Profile News Message Board | |
| Charts:- Daily , Weekly | |
| Add FMNB to Watchlist: View: Get Complete FMNB Trend Analysis ➞ | |
 | MC Moelis & Company |
| Sector: Financials | |
| SubSector: Asset Management | |
| MarketCap: 1675.93 Millions | |
| Recent Price: 69.38 Smart Investing & Trading Score: 43 | |
| Day Percent Change: 1.17% Day Change: 0.8 | |
| Week Change: 1.17% Year-to-date Change: -5.3% | |
| MC Links: Profile News Message Board | |
| Charts:- Daily , Weekly | |
| Add MC to Watchlist: View: Get Complete MC Trend Analysis ➞ | |
 | RF Regions Financial Corporation |
| Sector: Financials | |
| SubSector: Regional - Southeast Banks | |
| MarketCap: 8936.25 Millions | |
| Recent Price: 25.18 Smart Investing & Trading Score: 43 | |
| Day Percent Change: 1.17% Day Change: 0.29 | |
| Week Change: 1.17% Year-to-date Change: 8.2% | |
| RF Links: Profile News Message Board | |
| Charts:- Daily , Weekly | |
| Add RF to Watchlist: View: Get Complete RF Trend Analysis ➞ | |
 | LOB Live Oak Bancshares, Inc. |
| Sector: Financials | |
| SubSector: Savings & Loans | |
| MarketCap: 394.23 Millions | |
| Recent Price: 31.35 Smart Investing & Trading Score: 43 | |
| Day Percent Change: 1.1% Day Change: 0.34 | |
| Week Change: 1.1% Year-to-date Change: -20.7% | |
| LOB Links: Profile News Message Board | |
| Charts:- Daily , Weekly | |
| Add LOB to Watchlist: View: Get Complete LOB Trend Analysis ➞ | |
 | HMST HomeStreet, Inc. |
| Sector: Financials | |
| SubSector: Savings & Loans | |
| MarketCap: 535.33 Millions | |
| Recent Price: 13.05 Smart Investing & Trading Score: 43 | |
| Day Percent Change: 1.08% Day Change: 0.14 | |
| Week Change: 1.08% Year-to-date Change: 14.3% | |
| HMST Links: Profile News Message Board | |
| Charts:- Daily , Weekly | |
| Add HMST to Watchlist: View: Get Complete HMST Trend Analysis ➞ | |
 | DCOM Dime Community Bancshares, Inc. |
| Sector: Financials | |
| SubSector: Savings & Loans | |
| MarketCap: 477.83 Millions | |
| Recent Price: 27.42 Smart Investing & Trading Score: 43 | |
| Day Percent Change: 1.07% Day Change: 0.29 | |
| Week Change: 1.07% Year-to-date Change: -9.2% | |
| DCOM Links: Profile News Message Board | |
| Charts:- Daily , Weekly | |
| Add DCOM to Watchlist: View: Get Complete DCOM Trend Analysis ➞ | |
 | WSFS WSFS Financial Corporation |
| Sector: Financials | |
| SubSector: Regional - Mid-Atlantic Banks | |
| MarketCap: 1191.29 Millions | |
| Recent Price: 54.27 Smart Investing & Trading Score: 43 | |
| Day Percent Change: 0.95% Day Change: 0.51 | |
| Week Change: 0.95% Year-to-date Change: 2.4% | |
| WSFS Links: Profile News Message Board | |
| Charts:- Daily , Weekly | |
| Add WSFS to Watchlist: View: Get Complete WSFS Trend Analysis ➞ | |
 | MBWM Mercantile Bank Corporation |
| Sector: Financials | |
| SubSector: Regional - Midwest Banks | |
| MarketCap: 372.77 Millions | |
| Recent Price: 44.85 Smart Investing & Trading Score: 43 | |
| Day Percent Change: 0.92% Day Change: 0.41 | |
| Week Change: 0.92% Year-to-date Change: 1.6% | |
| MBWM Links: Profile News Message Board | |
| Charts:- Daily , Weekly | |
| Add MBWM to Watchlist: View: Get Complete MBWM Trend Analysis ➞ | |
 | TRMK Trustmark Corporation |
| Sector: Financials | |
| SubSector: Regional - Southeast Banks | |
| MarketCap: 1630.15 Millions | |
| Recent Price: 36.89 Smart Investing & Trading Score: 43 | |
| Day Percent Change: 0.9% Day Change: 0.33 | |
| Week Change: 0.9% Year-to-date Change: 5.0% | |
| TRMK Links: Profile News Message Board | |
| Charts:- Daily , Weekly | |
| Add TRMK to Watchlist: View: Get Complete TRMK Trend Analysis ➞ | |
 | SSB South State Corporation |
| Sector: Financials | |
| SubSector: Regional - Mid-Atlantic Banks | |
| MarketCap: 2113.49 Millions | |
| Recent Price: 93.59 Smart Investing & Trading Score: 43 | |
| Day Percent Change: 0.89% Day Change: 0.83 | |
| Week Change: 0.89% Year-to-date Change: -5.5% | |
| SSB Links: Profile News Message Board | |
| Charts:- Daily , Weekly | |
| Add SSB to Watchlist: View: Get Complete SSB Trend Analysis ➞ | |
 | FULT Fulton Financial Corporation |
| Sector: Financials | |
| SubSector: Regional - Northeast Banks | |
| MarketCap: 2030.89 Millions | |
| Recent Price: 17.76 Smart Investing & Trading Score: 43 | |
| Day Percent Change: 0.79% Day Change: 0.14 | |
| Week Change: 0.79% Year-to-date Change: -7.0% | |
| FULT Links: Profile News Message Board | |
| Charts:- Daily , Weekly | |
| Add FULT to Watchlist: View: Get Complete FULT Trend Analysis ➞ | |
| For tabular summary view of above stock list: Summary View ➞ 0 - 25 , 25 - 50 , 50 - 75 , 75 - 100 , 100 - 125 , 125 - 150 , 150 - 175 , 175 - 200 , 200 - 225 , 225 - 250 , 250 - 275 , 275 - 300 , 300 - 325 , 325 - 350 , 350 - 375 , 375 - 400 , 400 - 425 , 425 - 450 , 450 - 475 , 475 - 500 , 500 - 525 , 525 - 550 , 550 - 575 | ||
| Click To Change The Sort Order: By Market Cap or Company Size Performance: Year-to-date, Week and Day | |
| Select Chart Type: | ||
|
Best Stocks Today 12Stocks.com |
© 2025 12Stocks.com Terms & Conditions Privacy Contact Us
All Information Provided Only For Education And Not To Be Used For Investing or Trading. See Terms & Conditions


One More Thing ... Get Best Stocks Delivered Daily!
Never Ever Miss A Move With Our Top Ten Stocks Lists
Find Best Stocks In Any Market - Bull or Bear Market
Take A Peek At Our Top Ten Stocks Lists: Daily, Weekly, Year-to-Date & Top Trends
Find Best Stocks In Any Market - Bull or Bear Market
Take A Peek At Our Top Ten Stocks Lists: Daily, Weekly, Year-to-Date & Top Trends
Financial Stocks With Best Up Trends [0-bearish to 100-bullish]: Uniti [100], LendingTree [100], Mercury General[100], Perella Weinberg[100], Broadstone Net[100], LendingClub [100], TPG RE[100], CareTrust REIT[100], Stewart Information[100], Healthcare Realty[100], VICI Properties[100]
Best Financial Stocks Year-to-Date:
ESSA Bancorp[3207.77%], Easterly Government[108.45%], Mr. Cooper[86.58%], Heritage Insurance[75.29%], Root [65.29%], Industrial Logistics[64.89%], Rocket [58.42%], Diversified Healthcare[49.61%], ProAssurance [49.59%], Uniti [47.09%], SoFi Technologies[41.62%] Best Financial Stocks This Week:
Uniti [64.77%], Industrial Logistics[11.36%], LendingTree [7.32%], eXp World[7.27%], EverQuote [6.89%], Camping World[6.84%], First Foundation[6.69%], Diamond Hill[5.46%], Mercury General[5.36%], Cipher Mining[5.27%], AlTi Global[5.13%] Best Financial Stocks Daily:
Uniti [64.77%], Industrial Logistics[11.36%], LendingTree [7.32%], eXp World[7.27%], EverQuote [6.89%], Camping World[6.84%], First Foundation[6.69%], Diamond Hill[5.46%], Mercury General[5.36%], Cipher Mining[5.27%], AlTi Global[5.13%]