
 Login Sign Up


| |||||
 |  | ||||

| 12Stocks.com Market Intelligence |
Best Financial Stocks
| In a hurry? Financial Stocks Lists: Performance Trends Table, Stock Charts
Sort Financial stocks: Daily, Weekly, Year-to-Date, Market Cap & Trends. Filter Financial stocks list by size:All Financial Large Mid-Range Small & MicroCap |
| 12Stocks.com Financial Stocks Performances & Trends Daily | |||||||||
|
|  The overall Smart Investing & Trading Score is 33 (0-bearish to 100-bullish) which puts Financial sector in short term bearish to neutral trend. The Smart Investing & Trading Score from previous trading session is 26 and hence an improvement of trend.
| ||||||||
Here are the Smart Investing & Trading Scores of the most requested Financial stocks at 12Stocks.com (click stock name for detailed review):
|


| 12Stocks.com: Investing in Financial sector with Stocks | |
|
The following table helps investors and traders sort through current performance and trends (as measured by Smart Investing & Trading Score) of various
stocks in the Financial sector. Quick View: Move mouse or cursor over stock symbol (ticker) to view short-term Technical chart and over stock name to view long term chart. Click on  to add stock symbol to your watchlist and to add stock symbol to your watchlist and  to view watchlist. Click on any ticker or stock name for detailed market intelligence report for that stock. to view watchlist. Click on any ticker or stock name for detailed market intelligence report for that stock. |
12Stocks.com Performance of Stocks in Financial Sector
| Ticker | Stock Name | Watchlist | Category | Recent Price | Trend Score | Change % | YTD Change% |
| FCFS | FirstCash |   | Credit Services | 134.75 | 95 | 2.80% | 30.49% |
| NMRK | Newmark | | Property Mgmt | 15.50 | 95 | 2.51% | 21.25% |
| ICE | Intercontinental Exchange | | Investments | 188.45 | 95 | 2.09% | 26.82% |
| WELL | Welltower | | REIT | 168.78 | 95 | 1.53% | 34.52% |
| RM | Regional Management | | Credit Services | 33.87 | 93 | 3.23% | 0.51% |
| COOP | Mr. Cooper | | S&L | 179.14 | 93 | 2.80% | 86.58% |
| ATLO | Ames National | | Regional Banks | 18.51 | 93 | 2.78% | 13.90% |
| ARR | ARMOUR Residential | | Mortgage | 16.80 | 93 | 2.56% | -5.83% |
| KREF | KKR Real | | Mortgage | 9.19 | 93 | 1.32% | -6.88% |
| MBI | MBIA | | Insurance | 5.51 | 93 | -1.61% | -14.71% |
| NNN | National Retail | | REIT - | 43.05 | 93 | 2.45% | 6.95% |
| WD | Walker & Dunlop | | Mortgage | 75.65 | 93 | 1.60% | -21.56% |
| BEN | Franklin Resources | | Asset Mgmt | 25.13 | 90 | 4.93% | 25.94% |
| FNF | Fidelity National | | Insurance | 57.96 | 90 | 2.44% | 4.04% |
| NDAQ | Nasdaq | | Investments | 96.91 | 90 | 1.83% | 25.77% |
| IVR | Invesco Mortgage | | Mortgage | 7.71 | 90 | 1.72% | 0.47% |
| MTG | MGIC | | Insurance | 26.72 | 90 | 1.67% | 13.29% |
| VTR | Ventas | | REIT | 68.28 | 90 | 1.16% | 16.76% |
| EVER | EverQuote | | Regional Banks | 25.76 | 88 | 6.89% | 28.86% |
| KRC | Kilroy Realty | | REIT - Office | 37.54 | 88 | 2.71% | -5.66% |
| O | Realty ome | | REIT - Retail | 57.45 | 88 | 1.56% | 9.64% |
| upst | Upstart | | Credit Services | 82.83 | 88 | 4.56% | 34.53% |
| CWK | Cushman & Wakefield | | Property Mgmt | 12.32 | 88 | 3.27% | -5.81% |
| ARES | Ares Management | | Asset Mgmt | 188.55 | 88 | 3.13% | 7.34% |
| AGNC | AGNC | | Mortgage | 9.63 | 88 | 1.58% | 8.42% |
| For chart view version of above stock list: Chart View ➞ 0 - 25 , 25 - 50 , 50 - 75 , 75 - 100 , 100 - 125 , 125 - 150 , 150 - 175 , 175 - 200 , 200 - 225 , 225 - 250 , 250 - 275 , 275 - 300 , 300 - 325 , 325 - 350 , 350 - 375 , 375 - 400 , 400 - 425 , 425 - 450 , 450 - 475 , 475 - 500 , 500 - 525 , 525 - 550 , 550 - 575 | ||
 | Click To Change The Sort Order: By Market Cap or Company Size Performance: Year-to-date, Week and Day |  |
|
Get the most comprehensive stock market coverage daily at 12Stocks.com ➞ Best Stocks Today ➞ Best Stocks Weekly ➞ Best Stocks Year-to-Date ➞ Best Stocks Trends ➞  Best Stocks Today 12Stocks.com Best Nasdaq Stocks ➞ Best S&P 500 Stocks ➞ Best Tech Stocks ➞ Best Biotech Stocks ➞ |
| Detailed Overview of Financial Stocks |
| Financial Technical Overview, Leaders & Laggards, Top Financial ETF Funds & Detailed Financial Stocks List, Charts, Trends & More |
| Financial Sector: Technical Analysis, Trends & YTD Performance | |
| Financial sector is composed of stocks
from banks, brokers, insurance, REITs
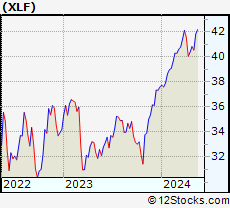
and services subsectors. Financial sector, as represented by XLF, an exchange-traded fund [ETF] that holds basket of Financial stocks (e.g, Bank of America, Goldman Sachs) is up by 7.8% and is currently outperforming the overall market by 0.27% year-to-date. Below is a quick view of Technical charts and trends: |
|
 XLF Weekly Chart |
|
| Long Term Trend: Good | |
| Medium Term Trend: Not Good | |
 XLF Daily Chart |
|
| Short Term Trend: Not Good | |
| Overall Trend Score: 33 | |
| YTD Performance: 7.8% | |
| **Trend Scores & Views Are Only For Educational Purposes And Not For Investing | |
| 12Stocks.com: Top Performing Financial Sector Stocks | ||||||||||||||||||||||||||||||||||||||||||||||||
 The top performing Financial sector stocks year to date are
Now, more recently, over last week, the top performing Financial sector stocks on the move are


|
||||||||||||||||||||||||||||||||||||||||||||||||
| 12Stocks.com: Investing in Financial Sector using Exchange Traded Funds | |
|
The following table shows list of key exchange traded funds (ETF) that
help investors track Financial Index. For detailed view, check out our ETF Funds section of our website. Quick View: Move mouse or cursor over ETF symbol (ticker) to view short-term Technical chart and over ETF name to view long term chart. Click on ticker or stock name for detailed view. Click on to add stock symbol to your watchlist and to view watchlist. |
12Stocks.com List of ETFs that track Financial Index
| Ticker | ETF Name | Watchlist | Recent Price | Smart Investing & Trading Score | Change % | Week % | Year-to-date % |
| XLF | Financial | | 51.91 | 33 | 0.99 | 0.99 | 7.8% |
| IAI | Broker-Dealers & Secs | | 174.97 | 63 | 2.34 | 2.34 | 21.82% |
| KBE | Bank | | 55.98 | 43 | 1.3 | 1.3 | 1.64% |
| FAS | Financial Bull 3X | | 161.82 | 33 | 2.91 | 2.91 | 7.48% |
| FAZ | Financial Bear 3X | | 4.54 | 62 | -2.78 | -2.78 | -27.4% |
| UYG | Financials | | 92.87 | 26 | 1.72 | 1.72 | 9% |
| KIE | Insurance | | 56.42 | 25 | 1.27 | 1.27 | 0.32% |
| 12Stocks.com: Charts, Trends, Fundamental Data and Performances of Financial Stocks | |
|
We now take in-depth look at all Financial stocks including charts, multi-period performances and overall trends (as measured by Smart Investing & Trading Score). One can sort Financial stocks (click link to choose) by Daily, Weekly and by Year-to-Date performances. Also, one can sort by size of the company or by market capitalization. |
| Select Your Default Chart Type: | |||||
| |||||
| Click on stock symbol or name for detailed view. Click on to add stock symbol to your watchlist and to view watchlist. Quick View: Move mouse or cursor over "Daily" to quickly view daily Technical stock chart and over "Weekly" to view weekly Technical stock chart. | |||||

 | FCFS FirstCash, Inc. |
| Sector: Financials | |
| SubSector: Credit Services | |
| MarketCap: 2795.48 Millions | |
| Recent Price: 134.75 Smart Investing & Trading Score: 95 | |
| Day Percent Change: 2.8% Day Change: 3.67 | |
| Week Change: 2.8% Year-to-date Change: 30.5% | |
| FCFS Links: Profile News Message Board | |
| Charts:- Daily , Weekly | |
| Add FCFS to Watchlist: View: Get Complete FCFS Trend Analysis ➞ | |
 | NMRK Newmark Group, Inc. |
| Sector: Financials | |
| SubSector: Property Management | |
| MarketCap: 767.542 Millions | |
| Recent Price: 15.50 Smart Investing & Trading Score: 95 | |
| Day Percent Change: 2.51% Day Change: 0.38 | |
| Week Change: 2.51% Year-to-date Change: 21.3% | |
| NMRK Links: Profile News Message Board | |
| Charts:- Daily , Weekly | |
| Add NMRK to Watchlist: View: Get Complete NMRK Trend Analysis ➞ | |
 | ICE Intercontinental Exchange, Inc. |
| Sector: Financials | |
| SubSector: Diversified Investments | |
| MarketCap: 46054.6 Millions | |
| Recent Price: 188.45 Smart Investing & Trading Score: 95 | |
| Day Percent Change: 2.09% Day Change: 3.85 | |
| Week Change: 2.09% Year-to-date Change: 26.8% | |
| ICE Links: Profile News Message Board | |
| Charts:- Daily , Weekly | |
| Add ICE to Watchlist: View: Get Complete ICE Trend Analysis ➞ | |
 | WELL Welltower Inc. |
| Sector: Financials | |
| SubSector: REIT - Healthcare Facilities | |
| MarketCap: 21398.8 Millions | |
| Recent Price: 168.78 Smart Investing & Trading Score: 95 | |
| Day Percent Change: 1.53% Day Change: 2.54 | |
| Week Change: 1.53% Year-to-date Change: 34.5% | |
| WELL Links: Profile News Message Board | |
| Charts:- Daily , Weekly | |
| Add WELL to Watchlist: View: Get Complete WELL Trend Analysis ➞ | |
 | RM Regional Management Corp. |
| Sector: Financials | |
| SubSector: Credit Services | |
| MarketCap: 148.008 Millions | |
| Recent Price: 33.87 Smart Investing & Trading Score: 93 | |
| Day Percent Change: 3.23% Day Change: 1.06 | |
| Week Change: 3.23% Year-to-date Change: 0.5% | |
| RM Links: Profile News Message Board | |
| Charts:- Daily , Weekly | |
| Add RM to Watchlist: View: Get Complete RM Trend Analysis ➞ | |
 | COOP Mr. Cooper Group Inc. |
| Sector: Financials | |
| SubSector: Savings & Loans | |
| MarketCap: 648.33 Millions | |
| Recent Price: 179.14 Smart Investing & Trading Score: 93 | |
| Day Percent Change: 2.8% Day Change: 4.88 | |
| Week Change: 2.8% Year-to-date Change: 86.6% | |
| COOP Links: Profile News Message Board | |
| Charts:- Daily , Weekly | |
| Add COOP to Watchlist: View: Get Complete COOP Trend Analysis ➞ | |
 | ATLO Ames National Corporation |
| Sector: Financials | |
| SubSector: Regional - Northeast Banks | |
| MarketCap: 195.999 Millions | |
| Recent Price: 18.51 Smart Investing & Trading Score: 93 | |
| Day Percent Change: 2.78% Day Change: 0.5 | |
| Week Change: 2.78% Year-to-date Change: 13.9% | |
| ATLO Links: Profile News Message Board | |
| Charts:- Daily , Weekly | |
| Add ATLO to Watchlist: View: Get Complete ATLO Trend Analysis ➞ | |
 | ARR ARMOUR Residential REIT, Inc. |
| Sector: Financials | |
| SubSector: Mortgage Investment | |
| MarketCap: 578.739 Millions | |
| Recent Price: 16.80 Smart Investing & Trading Score: 93 | |
| Day Percent Change: 2.56% Day Change: 0.42 | |
| Week Change: 2.56% Year-to-date Change: -5.8% | |
| ARR Links: Profile News Message Board | |
| Charts:- Daily , Weekly | |
| Add ARR to Watchlist: View: Get Complete ARR Trend Analysis ➞ | |
 | KREF KKR Real Estate Finance Trust Inc. |
| Sector: Financials | |
| SubSector: Mortgage Investment | |
| MarketCap: 645.939 Millions | |
| Recent Price: 9.19 Smart Investing & Trading Score: 93 | |
| Day Percent Change: 1.32% Day Change: 0.12 | |
| Week Change: 1.32% Year-to-date Change: -6.9% | |
| KREF Links: Profile News Message Board | |
| Charts:- Daily , Weekly | |
| Add KREF to Watchlist: View: Get Complete KREF Trend Analysis ➞ | |
 | MBI MBIA Inc. |
| Sector: Financials | |
| SubSector: Property & Casualty Insurance | |
| MarketCap: 539.012 Millions | |
| Recent Price: 5.51 Smart Investing & Trading Score: 93 | |
| Day Percent Change: -1.61% Day Change: -0.09 | |
| Week Change: -1.61% Year-to-date Change: -14.7% | |
| MBI Links: Profile News Message Board | |
| Charts:- Daily , Weekly | |
| Add MBI to Watchlist: View: Get Complete MBI Trend Analysis ➞ | |
 | NNN National Retail Properties, Inc. |
| Sector: Financials | |
| SubSector: REIT - Diversified | |
| MarketCap: 5459.93 Millions | |
| Recent Price: 43.05 Smart Investing & Trading Score: 93 | |
| Day Percent Change: 2.45% Day Change: 1.03 | |
| Week Change: 2.45% Year-to-date Change: 7.0% | |
| NNN Links: Profile News Message Board | |
| Charts:- Daily , Weekly | |
| Add NNN to Watchlist: View: Get Complete NNN Trend Analysis ➞ | |
 | WD Walker & Dunlop, Inc. |
| Sector: Financials | |
| SubSector: Mortgage Investment | |
| MarketCap: 1312.99 Millions | |
| Recent Price: 75.65 Smart Investing & Trading Score: 93 | |
| Day Percent Change: 1.6% Day Change: 1.19 | |
| Week Change: 1.6% Year-to-date Change: -21.6% | |
| WD Links: Profile News Message Board | |
| Charts:- Daily , Weekly | |
| Add WD to Watchlist: View: Get Complete WD Trend Analysis ➞ | |
 | BEN Franklin Resources, Inc. |
| Sector: Financials | |
| SubSector: Asset Management | |
| MarketCap: 9419.73 Millions | |
| Recent Price: 25.13 Smart Investing & Trading Score: 90 | |
| Day Percent Change: 4.93% Day Change: 1.18 | |
| Week Change: 4.93% Year-to-date Change: 25.9% | |
| BEN Links: Profile News Message Board | |
| Charts:- Daily , Weekly | |
| Add BEN to Watchlist: View: Get Complete BEN Trend Analysis ➞ | |
 | FNF Fidelity National Financial, Inc. |
| Sector: Financials | |
| SubSector: Surety & Title Insurance | |
| MarketCap: 6532.18 Millions | |
| Recent Price: 57.96 Smart Investing & Trading Score: 90 | |
| Day Percent Change: 2.44% Day Change: 1.38 | |
| Week Change: 2.44% Year-to-date Change: 4.0% | |
| FNF Links: Profile News Message Board | |
| Charts:- Daily , Weekly | |
| Add FNF to Watchlist: View: Get Complete FNF Trend Analysis ➞ | |
 | NDAQ Nasdaq, Inc. |
| Sector: Financials | |
| SubSector: Diversified Investments | |
| MarketCap: 14885.2 Millions | |
| Recent Price: 96.91 Smart Investing & Trading Score: 90 | |
| Day Percent Change: 1.83% Day Change: 1.74 | |
| Week Change: 1.83% Year-to-date Change: 25.8% | |
| NDAQ Links: Profile News Message Board | |
| Charts:- Daily , Weekly | |
| Add NDAQ to Watchlist: View: Get Complete NDAQ Trend Analysis ➞ | |
 | IVR Invesco Mortgage Capital Inc. |
| Sector: Financials | |
| SubSector: Mortgage Investment | |
| MarketCap: 1182.19 Millions | |
| Recent Price: 7.71 Smart Investing & Trading Score: 90 | |
| Day Percent Change: 1.72% Day Change: 0.13 | |
| Week Change: 1.72% Year-to-date Change: 0.5% | |
| IVR Links: Profile News Message Board | |
| Charts:- Daily , Weekly | |
| Add IVR to Watchlist: View: Get Complete IVR Trend Analysis ➞ | |
 | MTG MGIC Investment Corporation |
| Sector: Financials | |
| SubSector: Property & Casualty Insurance | |
| MarketCap: 2521.62 Millions | |
| Recent Price: 26.72 Smart Investing & Trading Score: 90 | |
| Day Percent Change: 1.67% Day Change: 0.44 | |
| Week Change: 1.67% Year-to-date Change: 13.3% | |
| MTG Links: Profile News Message Board | |
| Charts:- Daily , Weekly | |
| Add MTG to Watchlist: View: Get Complete MTG Trend Analysis ➞ | |
 | VTR Ventas, Inc. |
| Sector: Financials | |
| SubSector: REIT - Healthcare Facilities | |
| MarketCap: 11180.4 Millions | |
| Recent Price: 68.28 Smart Investing & Trading Score: 90 | |
| Day Percent Change: 1.16% Day Change: 0.78 | |
| Week Change: 1.16% Year-to-date Change: 16.8% | |
| VTR Links: Profile News Message Board | |
| Charts:- Daily , Weekly | |
| Add VTR to Watchlist: View: Get Complete VTR Trend Analysis ➞ | |
 | EVER EverQuote, Inc. |
| Sector: Financials | |
| SubSector: Regional - Southeast Banks | |
| MarketCap: 767.135 Millions | |
| Recent Price: 25.76 Smart Investing & Trading Score: 88 | |
| Day Percent Change: 6.89% Day Change: 1.66 | |
| Week Change: 6.89% Year-to-date Change: 28.9% | |
| EVER Links: Profile News Message Board | |
| Charts:- Daily , Weekly | |
| Add EVER to Watchlist: View: Get Complete EVER Trend Analysis ➞ | |
 | KRC Kilroy Realty Corporation |
| Sector: Financials | |
| SubSector: REIT - Office | |
| MarketCap: 6390.46 Millions | |
| Recent Price: 37.54 Smart Investing & Trading Score: 88 | |
| Day Percent Change: 2.71% Day Change: 0.99 | |
| Week Change: 2.71% Year-to-date Change: -5.7% | |
| KRC Links: Profile News Message Board | |
| Charts:- Daily , Weekly | |
| Add KRC to Watchlist: View: Get Complete KRC Trend Analysis ➞ | |
 | O Realty Income Corporation |
| Sector: Financials | |
| SubSector: REIT - Retail | |
| MarketCap: 17647.4 Millions | |
| Recent Price: 57.45 Smart Investing & Trading Score: 88 | |
| Day Percent Change: 1.56% Day Change: 0.88 | |
| Week Change: 1.56% Year-to-date Change: 9.6% | |
| O Links: Profile News Message Board | |
| Charts:- Daily , Weekly | |
| Add O to Watchlist: View: Get Complete O Trend Analysis ➞ | |
 | upst Upstart Holdings, Inc. |
| Sector: Financials | |
| SubSector: Credit Services | |
| MarketCap: 2900 Millions | |
| Recent Price: 82.83 Smart Investing & Trading Score: 88 | |
| Day Percent Change: 4.56% Day Change: 3.61 | |
| Week Change: 4.56% Year-to-date Change: 34.5% | |
| upst Links: Profile News Message Board | |
| Charts:- Daily , Weekly | |
| Add upst to Watchlist: View: Get Complete upst Trend Analysis ➞ | |
 | CWK Cushman & Wakefield plc |
| Sector: Financials | |
| SubSector: Property Management | |
| MarketCap: 2651.62 Millions | |
| Recent Price: 12.32 Smart Investing & Trading Score: 88 | |
| Day Percent Change: 3.27% Day Change: 0.39 | |
| Week Change: 3.27% Year-to-date Change: -5.8% | |
| CWK Links: Profile News Message Board | |
| Charts:- Daily , Weekly | |
| Add CWK to Watchlist: View: Get Complete CWK Trend Analysis ➞ | |
 | ARES Ares Management Corporation |
| Sector: Financials | |
| SubSector: Asset Management | |
| MarketCap: 5826.23 Millions | |
| Recent Price: 188.55 Smart Investing & Trading Score: 88 | |
| Day Percent Change: 3.13% Day Change: 5.72 | |
| Week Change: 3.13% Year-to-date Change: 7.3% | |
| ARES Links: Profile News Message Board | |
| Charts:- Daily , Weekly | |
| Add ARES to Watchlist: View: Get Complete ARES Trend Analysis ➞ | |
 | AGNC AGNC Investment Corp. |
| Sector: Financials | |
| SubSector: Mortgage Investment | |
| MarketCap: 6622.19 Millions | |
| Recent Price: 9.63 Smart Investing & Trading Score: 88 | |
| Day Percent Change: 1.58% Day Change: 0.15 | |
| Week Change: 1.58% Year-to-date Change: 8.4% | |
| AGNC Links: Profile News Message Board | |
| Charts:- Daily , Weekly | |
| Add AGNC to Watchlist: View: Get Complete AGNC Trend Analysis ➞ | |
| For tabular summary view of above stock list: Summary View ➞ 0 - 25 , 25 - 50 , 50 - 75 , 75 - 100 , 100 - 125 , 125 - 150 , 150 - 175 , 175 - 200 , 200 - 225 , 225 - 250 , 250 - 275 , 275 - 300 , 300 - 325 , 325 - 350 , 350 - 375 , 375 - 400 , 400 - 425 , 425 - 450 , 450 - 475 , 475 - 500 , 500 - 525 , 525 - 550 , 550 - 575 | ||
| Click To Change The Sort Order: By Market Cap or Company Size Performance: Year-to-date, Week and Day | |
| Select Chart Type: | ||
|
Best Stocks Today 12Stocks.com |
© 2025 12Stocks.com Terms & Conditions Privacy Contact Us
All Information Provided Only For Education And Not To Be Used For Investing or Trading. See Terms & Conditions


One More Thing ... Get Best Stocks Delivered Daily!
Never Ever Miss A Move With Our Top Ten Stocks Lists
Find Best Stocks In Any Market - Bull or Bear Market
Take A Peek At Our Top Ten Stocks Lists: Daily, Weekly, Year-to-Date & Top Trends
Find Best Stocks In Any Market - Bull or Bear Market
Take A Peek At Our Top Ten Stocks Lists: Daily, Weekly, Year-to-Date & Top Trends
Financial Stocks With Best Up Trends [0-bearish to 100-bullish]: Uniti [100], LendingTree [100], Mercury General[100], Perella Weinberg[100], Broadstone Net[100], LendingClub [100], TPG RE[100], CareTrust REIT[100], Stewart Information[100], Healthcare Realty[100], VICI Properties[100]
Best Financial Stocks Year-to-Date:
ESSA Bancorp[3207.77%], Easterly Government[108.45%], Mr. Cooper[86.58%], Heritage Insurance[75.29%], Root [65.29%], Industrial Logistics[64.89%], Rocket [58.42%], Diversified Healthcare[49.61%], ProAssurance [49.59%], Uniti [47.09%], SoFi Technologies[41.62%] Best Financial Stocks This Week:
Uniti [64.77%], Industrial Logistics[11.36%], LendingTree [7.32%], eXp World[7.27%], EverQuote [6.89%], Camping World[6.84%], First Foundation[6.69%], Diamond Hill[5.46%], Mercury General[5.36%], Cipher Mining[5.27%], AlTi Global[5.13%] Best Financial Stocks Daily:
Uniti [64.77%], Industrial Logistics[11.36%], LendingTree [7.32%], eXp World[7.27%], EverQuote [6.89%], Camping World[6.84%], First Foundation[6.69%], Diamond Hill[5.46%], Mercury General[5.36%], Cipher Mining[5.27%], AlTi Global[5.13%]