
 Login Sign Up


| |||||
 |  | ||||

| 12Stocks.com Market Intelligence |
Best Financial Stocks
| In a hurry? Financial Stocks Lists: Performance Trends Table, Stock Charts
Sort Financial stocks: Daily, Weekly, Year-to-Date, Market Cap & Trends. Filter Financial stocks list by size:All Financial Large Mid-Range Small & MicroCap |
| 12Stocks.com Financial Stocks Performances & Trends Daily | |||||||||
|
|  The overall Smart Investing & Trading Score is 33 (0-bearish to 100-bullish) which puts Financial sector in short term bearish to neutral trend. The Smart Investing & Trading Score from previous trading session is 26 and hence an improvement of trend.
| ||||||||
Here are the Smart Investing & Trading Scores of the most requested Financial stocks at 12Stocks.com (click stock name for detailed review):
|


| 12Stocks.com: Investing in Financial sector with Stocks | |
|
The following table helps investors and traders sort through current performance and trends (as measured by Smart Investing & Trading Score) of various
stocks in the Financial sector. Quick View: Move mouse or cursor over stock symbol (ticker) to view short-term Technical chart and over stock name to view long term chart. Click on  to add stock symbol to your watchlist and to add stock symbol to your watchlist and  to view watchlist. Click on any ticker or stock name for detailed market intelligence report for that stock. to view watchlist. Click on any ticker or stock name for detailed market intelligence report for that stock. |
12Stocks.com Performance of Stocks in Financial Sector
| Ticker | Stock Name | Watchlist | Category | Recent Price | Trend Score | Change % | YTD Change% |
| PAGS | PagSeguro Digital |   | Credit Services | 8.01 | 47 | 3.35% | 27.96% |
| CIFR | Cipher Mining | | Capital Markets | 5.19 | 46 | 5.27% | 11.85% |
| PEB | Pebblebrook Hotel | | REIT | 9.90 | 46 | 2.06% | -26.87% |
| PEBK | Peoples Bancorp | | Regional Banks | 28.36 | 46 | 1.79% | -8.04% |
| BCBP | BCB Bancorp | | Regional Banks | 8.24 | 46 | 1.73% | -29.38% |
| GCBC | Greene County | | S&L | 23.40 | 46 | 1.43% | -15.30% |
| FNLC | First Bancorp | | Regional Banks | 25.06 | 46 | 1.13% | -5.73% |
| HONE | HarborOne Bancorp | | S&L | 11.72 | 46 | 0.95% | 0.04% |
| STHO | Star | | Financials Services | 7.22 | 46 | -0.96% | -25.80% |
| OPAD | Offerpad | | Financials Services | 1.20 | 46 | -1.64% | -57.89% |
| NTRS | Northern Trust | | Asset Mgmt | 127.65 | 46 | 0.46% | 25.52% |
| BXMT | Blackstone Mortgage | | Mortgage | 18.90 | 45 | 1.39% | 11.19% |
| XP | XP | | Asset Mgmt | 16.69 | 44 | 2.05% | 40.84% |
| EGP | East Properties | | REIT - Industrial | 163.60 | 44 | 1.01% | 2.75% |
| PRA | ProAssurance | | Insurance | 23.80 | 44 | 0.59% | 49.59% |
| OWL | Blue Owl | | Asset Mgmt | 19.35 | 43 | 2.71% | -16.19% |
| APO | Apollo Global | | Investments | 142.02 | 43 | 2.70% | -13.77% |
| COLB | Columbia Banking | | S&L | 23.88 | 43 | 2.67% | -10.38% |
| FSBW | FS Bancorp | | Regional Banks | 38.82 | 43 | 2.59% | -4.81% |
| GBCI | Glacier Bancorp | | Regional Banks | 43.77 | 43 | 2.12% | -12.10% |
| LAZ | Lazard | | Asset Mgmt | 51.21 | 43 | 2.03% | 0.42% |
| HBCP | Home Bancorp | | S&L | 51.86 | 43 | 1.83% | 12.81% |
| BANR | Banner | | Regional Banks | 62.18 | 43 | 1.80% | -6.23% |
| CHMG | Chemung | | Regional Banks | 50.02 | 43 | 1.79% | 3.16% |
| MTB | M&T Bank | | Regional Banks | 188.29 | 43 | 1.78% | 0.86% |
| For chart view version of above stock list: Chart View ➞ 0 - 25 , 25 - 50 , 50 - 75 , 75 - 100 , 100 - 125 , 125 - 150 , 150 - 175 , 175 - 200 , 200 - 225 , 225 - 250 , 250 - 275 , 275 - 300 , 300 - 325 , 325 - 350 , 350 - 375 , 375 - 400 , 400 - 425 , 425 - 450 , 450 - 475 , 475 - 500 , 500 - 525 , 525 - 550 , 550 - 575 | ||
 | Click To Change The Sort Order: By Market Cap or Company Size Performance: Year-to-date, Week and Day |  |
|
Get the most comprehensive stock market coverage daily at 12Stocks.com ➞ Best Stocks Today ➞ Best Stocks Weekly ➞ Best Stocks Year-to-Date ➞ Best Stocks Trends ➞  Best Stocks Today 12Stocks.com Best Nasdaq Stocks ➞ Best S&P 500 Stocks ➞ Best Tech Stocks ➞ Best Biotech Stocks ➞ |
| Detailed Overview of Financial Stocks |
| Financial Technical Overview, Leaders & Laggards, Top Financial ETF Funds & Detailed Financial Stocks List, Charts, Trends & More |
| Financial Sector: Technical Analysis, Trends & YTD Performance | |
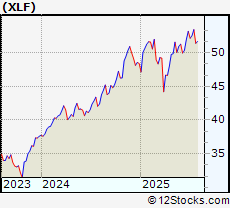
| Financial sector is composed of stocks
from banks, brokers, insurance, REITs
and services subsectors. Financial sector, as represented by XLF, an exchange-traded fund [ETF] that holds basket of Financial stocks (e.g, Bank of America, Goldman Sachs) is up by 7.8% and is currently outperforming the overall market by 0.27% year-to-date. Below is a quick view of Technical charts and trends: |
|
 XLF Weekly Chart |
|
| Long Term Trend: Good | |
| Medium Term Trend: Not Good | |
 XLF Daily Chart |
|
| Short Term Trend: Not Good | |
| Overall Trend Score: 33 | |
| YTD Performance: 7.8% | |
| **Trend Scores & Views Are Only For Educational Purposes And Not For Investing | |
| 12Stocks.com: Top Performing Financial Sector Stocks | ||||||||||||||||||||||||||||||||||||||||||||||||
 The top performing Financial sector stocks year to date are
Now, more recently, over last week, the top performing Financial sector stocks on the move are


|
||||||||||||||||||||||||||||||||||||||||||||||||
| 12Stocks.com: Investing in Financial Sector using Exchange Traded Funds | |
|
The following table shows list of key exchange traded funds (ETF) that
help investors track Financial Index. For detailed view, check out our ETF Funds section of our website. Quick View: Move mouse or cursor over ETF symbol (ticker) to view short-term Technical chart and over ETF name to view long term chart. Click on ticker or stock name for detailed view. Click on to add stock symbol to your watchlist and to view watchlist. |
12Stocks.com List of ETFs that track Financial Index
| Ticker | ETF Name | Watchlist | Recent Price | Smart Investing & Trading Score | Change % | Week % | Year-to-date % |
| XLF | Financial | | 51.91 | 33 | 0.99 | 0.99 | 7.8% |
| IAI | Broker-Dealers & Secs | | 174.97 | 63 | 2.34 | 2.34 | 21.82% |
| KBE | Bank | | 55.98 | 43 | 1.3 | 1.3 | 1.64% |
| FAS | Financial Bull 3X | | 161.82 | 33 | 2.91 | 2.91 | 7.48% |
| FAZ | Financial Bear 3X | | 4.54 | 62 | -2.78 | -2.78 | -27.4% |
| UYG | Financials | | 92.87 | 26 | 1.72 | 1.72 | 9% |
| KIE | Insurance | | 56.42 | 25 | 1.27 | 1.27 | 0.32% |
| 12Stocks.com: Charts, Trends, Fundamental Data and Performances of Financial Stocks | |
|
We now take in-depth look at all Financial stocks including charts, multi-period performances and overall trends (as measured by Smart Investing & Trading Score). One can sort Financial stocks (click link to choose) by Daily, Weekly and by Year-to-Date performances. Also, one can sort by size of the company or by market capitalization. |
| Select Your Default Chart Type: | |||||
| |||||
| Click on stock symbol or name for detailed view. Click on to add stock symbol to your watchlist and to view watchlist. Quick View: Move mouse or cursor over "Daily" to quickly view daily Technical stock chart and over "Weekly" to view weekly Technical stock chart. | |||||

 | PAGS PagSeguro Digital Ltd. |
| Sector: Financials | |
| SubSector: Credit Services | |
| MarketCap: 6500.78 Millions | |
| Recent Price: 8.01 Smart Investing & Trading Score: 47 | |
| Day Percent Change: 3.35% Day Change: 0.26 | |
| Week Change: 3.35% Year-to-date Change: 28.0% | |
| PAGS Links: Profile News Message Board | |
| Charts:- Daily , Weekly | |
| Add PAGS to Watchlist: View: Get Complete PAGS Trend Analysis ➞ | |
 | CIFR Cipher Mining Inc. |
| Sector: Financials | |
| SubSector: Capital Markets | |
| MarketCap: 712 Millions | |
| Recent Price: 5.19 Smart Investing & Trading Score: 46 | |
| Day Percent Change: 5.27% Day Change: 0.26 | |
| Week Change: 5.27% Year-to-date Change: 11.9% | |
| CIFR Links: Profile News Message Board | |
| Charts:- Daily , Weekly | |
| Add CIFR to Watchlist: View: Get Complete CIFR Trend Analysis ➞ | |
 | PEB Pebblebrook Hotel Trust |
| Sector: Financials | |
| SubSector: REIT - Hotel/Motel | |
| MarketCap: 1472.84 Millions | |
| Recent Price: 9.90 Smart Investing & Trading Score: 46 | |
| Day Percent Change: 2.06% Day Change: 0.2 | |
| Week Change: 2.06% Year-to-date Change: -26.9% | |
| PEB Links: Profile News Message Board | |
| Charts:- Daily , Weekly | |
| Add PEB to Watchlist: View: Get Complete PEB Trend Analysis ➞ | |
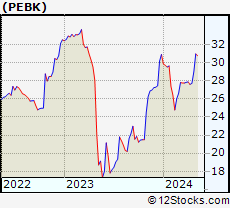 | PEBK Peoples Bancorp of North Carolina, Inc. |
| Sector: Financials | |
| SubSector: Regional - Mid-Atlantic Banks | |
| MarketCap: 180.759 Millions | |
| Recent Price: 28.36 Smart Investing & Trading Score: 46 | |
| Day Percent Change: 1.79% Day Change: 0.5 | |
| Week Change: 1.79% Year-to-date Change: -8.0% | |
| PEBK Links: Profile News Message Board | |
| Charts:- Daily , Weekly | |
| Add PEBK to Watchlist: View: Get Complete PEBK Trend Analysis ➞ | |
 | BCBP BCB Bancorp, Inc. |
| Sector: Financials | |
| SubSector: Regional - Northeast Banks | |
| MarketCap: 196.799 Millions | |
| Recent Price: 8.24 Smart Investing & Trading Score: 46 | |
| Day Percent Change: 1.73% Day Change: 0.14 | |
| Week Change: 1.73% Year-to-date Change: -29.4% | |
| BCBP Links: Profile News Message Board | |
| Charts:- Daily , Weekly | |
| Add BCBP to Watchlist: View: Get Complete BCBP Trend Analysis ➞ | |
 | GCBC Greene County Bancorp, Inc. |
| Sector: Financials | |
| SubSector: Savings & Loans | |
| MarketCap: 314.83 Millions | |
| Recent Price: 23.40 Smart Investing & Trading Score: 46 | |
| Day Percent Change: 1.43% Day Change: 0.33 | |
| Week Change: 1.43% Year-to-date Change: -15.3% | |
| GCBC Links: Profile News Message Board | |
| Charts:- Daily , Weekly | |
| Add GCBC to Watchlist: View: Get Complete GCBC Trend Analysis ➞ | |
 | FNLC The First Bancorp, Inc. |
| Sector: Financials | |
| SubSector: Regional - Northeast Banks | |
| MarketCap: 264.799 Millions | |
| Recent Price: 25.06 Smart Investing & Trading Score: 46 | |
| Day Percent Change: 1.13% Day Change: 0.28 | |
| Week Change: 1.13% Year-to-date Change: -5.7% | |
| FNLC Links: Profile News Message Board | |
| Charts:- Daily , Weekly | |
| Add FNLC to Watchlist: View: Get Complete FNLC Trend Analysis ➞ | |
 | HONE HarborOne Bancorp, Inc. |
| Sector: Financials | |
| SubSector: Savings & Loans | |
| MarketCap: 456.03 Millions | |
| Recent Price: 11.72 Smart Investing & Trading Score: 46 | |
| Day Percent Change: 0.95% Day Change: 0.11 | |
| Week Change: 0.95% Year-to-date Change: 0.0% | |
| HONE Links: Profile News Message Board | |
| Charts:- Daily , Weekly | |
| Add HONE to Watchlist: View: Get Complete HONE Trend Analysis ➞ | |
 | STHO Star Holdings |
| Sector: Financials | |
| SubSector: Financials Services | |
| MarketCap: 195 Millions | |
| Recent Price: 7.22 Smart Investing & Trading Score: 46 | |
| Day Percent Change: -0.96% Day Change: -0.07 | |
| Week Change: -0.96% Year-to-date Change: -25.8% | |
| STHO Links: Profile News Message Board | |
| Charts:- Daily , Weekly | |
| Add STHO to Watchlist: View: Get Complete STHO Trend Analysis ➞ | |
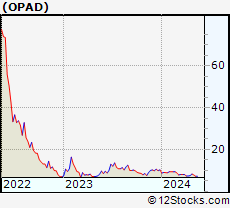 | OPAD Offerpad Solutions Inc. |
| Sector: Financials | |
| SubSector: Financials Services | |
| MarketCap: 345 Millions | |
| Recent Price: 1.20 Smart Investing & Trading Score: 46 | |
| Day Percent Change: -1.64% Day Change: -0.02 | |
| Week Change: -1.64% Year-to-date Change: -57.9% | |
| OPAD Links: Profile News Message Board | |
| Charts:- Daily , Weekly | |
| Add OPAD to Watchlist: View: Get Complete OPAD Trend Analysis ➞ | |
 | NTRS Northern Trust Corporation |
| Sector: Financials | |
| SubSector: Asset Management | |
| MarketCap: 15316.8 Millions | |
| Recent Price: 127.65 Smart Investing & Trading Score: 46 | |
| Day Percent Change: 0.46% Day Change: 0.59 | |
| Week Change: 0.46% Year-to-date Change: 25.5% | |
| NTRS Links: Profile News Message Board | |
| Charts:- Daily , Weekly | |
| Add NTRS to Watchlist: View: Get Complete NTRS Trend Analysis ➞ | |
 | BXMT Blackstone Mortgage Trust, Inc. |
| Sector: Financials | |
| SubSector: Mortgage Investment | |
| MarketCap: 2820.69 Millions | |
| Recent Price: 18.90 Smart Investing & Trading Score: 45 | |
| Day Percent Change: 1.39% Day Change: 0.26 | |
| Week Change: 1.39% Year-to-date Change: 11.2% | |
| BXMT Links: Profile News Message Board | |
| Charts:- Daily , Weekly | |
| Add BXMT to Watchlist: View: Get Complete BXMT Trend Analysis ➞ | |
 | XP XP Inc. |
| Sector: Financials | |
| SubSector: Asset Management | |
| MarketCap: 12990.3 Millions | |
| Recent Price: 16.69 Smart Investing & Trading Score: 44 | |
| Day Percent Change: 2.05% Day Change: 0.34 | |
| Week Change: 2.05% Year-to-date Change: 40.8% | |
| XP Links: Profile News Message Board | |
| Charts:- Daily , Weekly | |
| Add XP to Watchlist: View: Get Complete XP Trend Analysis ➞ | |
 | EGP EastGroup Properties, Inc. |
| Sector: Financials | |
| SubSector: REIT - Industrial | |
| MarketCap: 4034.29 Millions | |
| Recent Price: 163.60 Smart Investing & Trading Score: 44 | |
| Day Percent Change: 1.01% Day Change: 1.63 | |
| Week Change: 1.01% Year-to-date Change: 2.8% | |
| EGP Links: Profile News Message Board | |
| Charts:- Daily , Weekly | |
| Add EGP to Watchlist: View: Get Complete EGP Trend Analysis ➞ | |
 | PRA ProAssurance Corporation |
| Sector: Financials | |
| SubSector: Accident & Health Insurance | |
| MarketCap: 1434.6 Millions | |
| Recent Price: 23.80 Smart Investing & Trading Score: 44 | |
| Day Percent Change: 0.59% Day Change: 0.14 | |
| Week Change: 0.59% Year-to-date Change: 49.6% | |
| PRA Links: Profile News Message Board | |
| Charts:- Daily , Weekly | |
| Add PRA to Watchlist: View: Get Complete PRA Trend Analysis ➞ | |
 | OWL Blue Owl Capital Inc. |
| Sector: Financials | |
| SubSector: Asset Management | |
| MarketCap: 16240 Millions | |
| Recent Price: 19.35 Smart Investing & Trading Score: 43 | |
| Day Percent Change: 2.71% Day Change: 0.51 | |
| Week Change: 2.71% Year-to-date Change: -16.2% | |
| OWL Links: Profile News Message Board | |
| Charts:- Daily , Weekly | |
| Add OWL to Watchlist: View: Get Complete OWL Trend Analysis ➞ | |
 | APO Apollo Global Management, Inc. |
| Sector: Financials | |
| SubSector: Diversified Investments | |
| MarketCap: 12706 Millions | |
| Recent Price: 142.02 Smart Investing & Trading Score: 43 | |
| Day Percent Change: 2.7% Day Change: 3.73 | |
| Week Change: 2.7% Year-to-date Change: -13.8% | |
| APO Links: Profile News Message Board | |
| Charts:- Daily , Weekly | |
| Add APO to Watchlist: View: Get Complete APO Trend Analysis ➞ | |
 | COLB Columbia Banking System, Inc. |
| Sector: Financials | |
| SubSector: Savings & Loans | |
| MarketCap: 1868.3 Millions | |
| Recent Price: 23.88 Smart Investing & Trading Score: 43 | |
| Day Percent Change: 2.67% Day Change: 0.62 | |
| Week Change: 2.67% Year-to-date Change: -10.4% | |
| COLB Links: Profile News Message Board | |
| Charts:- Daily , Weekly | |
| Add COLB to Watchlist: View: Get Complete COLB Trend Analysis ➞ | |
 | FSBW FS Bancorp, Inc. |
| Sector: Financials | |
| SubSector: Regional - Pacific Banks | |
| MarketCap: 140.429 Millions | |
| Recent Price: 38.82 Smart Investing & Trading Score: 43 | |
| Day Percent Change: 2.59% Day Change: 0.98 | |
| Week Change: 2.59% Year-to-date Change: -4.8% | |
| FSBW Links: Profile News Message Board | |
| Charts:- Daily , Weekly | |
| Add FSBW to Watchlist: View: Get Complete FSBW Trend Analysis ➞ | |
 | GBCI Glacier Bancorp, Inc. |
| Sector: Financials | |
| SubSector: Regional - Pacific Banks | |
| MarketCap: 3142.89 Millions | |
| Recent Price: 43.77 Smart Investing & Trading Score: 43 | |
| Day Percent Change: 2.12% Day Change: 0.91 | |
| Week Change: 2.12% Year-to-date Change: -12.1% | |
| GBCI Links: Profile News Message Board | |
| Charts:- Daily , Weekly | |
| Add GBCI to Watchlist: View: Get Complete GBCI Trend Analysis ➞ | |
 | LAZ Lazard Ltd |
| Sector: Financials | |
| SubSector: Asset Management | |
| MarketCap: 3061.13 Millions | |
| Recent Price: 51.21 Smart Investing & Trading Score: 43 | |
| Day Percent Change: 2.03% Day Change: 1.02 | |
| Week Change: 2.03% Year-to-date Change: 0.4% | |
| LAZ Links: Profile News Message Board | |
| Charts:- Daily , Weekly | |
| Add LAZ to Watchlist: View: Get Complete LAZ Trend Analysis ➞ | |
 | HBCP Home Bancorp, Inc. |
| Sector: Financials | |
| SubSector: Savings & Loans | |
| MarketCap: 206.83 Millions | |
| Recent Price: 51.86 Smart Investing & Trading Score: 43 | |
| Day Percent Change: 1.83% Day Change: 0.93 | |
| Week Change: 1.83% Year-to-date Change: 12.8% | |
| HBCP Links: Profile News Message Board | |
| Charts:- Daily , Weekly | |
| Add HBCP to Watchlist: View: Get Complete HBCP Trend Analysis ➞ | |
 | BANR Banner Corporation |
| Sector: Financials | |
| SubSector: Regional - Mid-Atlantic Banks | |
| MarketCap: 1187.09 Millions | |
| Recent Price: 62.18 Smart Investing & Trading Score: 43 | |
| Day Percent Change: 1.8% Day Change: 1.1 | |
| Week Change: 1.8% Year-to-date Change: -6.2% | |
| BANR Links: Profile News Message Board | |
| Charts:- Daily , Weekly | |
| Add BANR to Watchlist: View: Get Complete BANR Trend Analysis ➞ | |
 | CHMG Chemung Financial Corporation |
| Sector: Financials | |
| SubSector: Regional - Pacific Banks | |
| MarketCap: 142.229 Millions | |
| Recent Price: 50.02 Smart Investing & Trading Score: 43 | |
| Day Percent Change: 1.79% Day Change: 0.88 | |
| Week Change: 1.79% Year-to-date Change: 3.2% | |
| CHMG Links: Profile News Message Board | |
| Charts:- Daily , Weekly | |
| Add CHMG to Watchlist: View: Get Complete CHMG Trend Analysis ➞ | |
 | MTB M&T Bank Corporation |
| Sector: Financials | |
| SubSector: Regional - Northeast Banks | |
| MarketCap: 13950.9 Millions | |
| Recent Price: 188.29 Smart Investing & Trading Score: 43 | |
| Day Percent Change: 1.78% Day Change: 3.3 | |
| Week Change: 1.78% Year-to-date Change: 0.9% | |
| MTB Links: Profile News Message Board | |
| Charts:- Daily , Weekly | |
| Add MTB to Watchlist: View: Get Complete MTB Trend Analysis ➞ | |
| For tabular summary view of above stock list: Summary View ➞ 0 - 25 , 25 - 50 , 50 - 75 , 75 - 100 , 100 - 125 , 125 - 150 , 150 - 175 , 175 - 200 , 200 - 225 , 225 - 250 , 250 - 275 , 275 - 300 , 300 - 325 , 325 - 350 , 350 - 375 , 375 - 400 , 400 - 425 , 425 - 450 , 450 - 475 , 475 - 500 , 500 - 525 , 525 - 550 , 550 - 575 | ||
| Click To Change The Sort Order: By Market Cap or Company Size Performance: Year-to-date, Week and Day | |
| Select Chart Type: | ||
|
Best Stocks Today 12Stocks.com |
© 2025 12Stocks.com Terms & Conditions Privacy Contact Us
All Information Provided Only For Education And Not To Be Used For Investing or Trading. See Terms & Conditions


One More Thing ... Get Best Stocks Delivered Daily!
Never Ever Miss A Move With Our Top Ten Stocks Lists
Find Best Stocks In Any Market - Bull or Bear Market
Take A Peek At Our Top Ten Stocks Lists: Daily, Weekly, Year-to-Date & Top Trends
Find Best Stocks In Any Market - Bull or Bear Market
Take A Peek At Our Top Ten Stocks Lists: Daily, Weekly, Year-to-Date & Top Trends
Financial Stocks With Best Up Trends [0-bearish to 100-bullish]: Uniti [100], LendingTree [100], Mercury General[100], Perella Weinberg[100], Broadstone Net[100], LendingClub [100], TPG RE[100], CareTrust REIT[100], Stewart Information[100], Healthcare Realty[100], VICI Properties[100]
Best Financial Stocks Year-to-Date:
ESSA Bancorp[3207.77%], Easterly Government[108.45%], Mr. Cooper[86.58%], Heritage Insurance[75.29%], Root [65.29%], Industrial Logistics[64.89%], Rocket [58.42%], Diversified Healthcare[49.61%], ProAssurance [49.59%], Uniti [47.09%], SoFi Technologies[41.62%] Best Financial Stocks This Week:
Uniti [64.77%], Industrial Logistics[11.36%], LendingTree [7.32%], eXp World[7.27%], EverQuote [6.89%], Camping World[6.84%], First Foundation[6.69%], Diamond Hill[5.46%], Mercury General[5.36%], Cipher Mining[5.27%], AlTi Global[5.13%] Best Financial Stocks Daily:
Uniti [64.77%], Industrial Logistics[11.36%], LendingTree [7.32%], eXp World[7.27%], EverQuote [6.89%], Camping World[6.84%], First Foundation[6.69%], Diamond Hill[5.46%], Mercury General[5.36%], Cipher Mining[5.27%], AlTi Global[5.13%]