
 Login Sign Up


| |||||
 |  | ||||

| 12Stocks.com Market Intelligence |
Best Financial Stocks
| In a hurry? Financial Stocks Lists: Performance Trends Table, Stock Charts
Sort Financial stocks: Daily, Weekly, Year-to-Date, Market Cap & Trends. Filter Financial stocks list by size:All Financial Large Mid-Range Small & MicroCap |
| 12Stocks.com Financial Stocks Performances & Trends Daily | |||||||||
|
|  The overall Smart Investing & Trading Score is 90 (0-bearish to 100-bullish) which puts Financial sector in short term bullish trend. The Smart Investing & Trading Score from previous trading session is 60 and an improvement of trend continues.
| ||||||||
Here are the Smart Investing & Trading Scores of the most requested Financial stocks at 12Stocks.com (click stock name for detailed review):
|


| 12Stocks.com: Investing in Financial sector with Stocks | |
|
The following table helps investors and traders sort through current performance and trends (as measured by Smart Investing & Trading Score) of various
stocks in the Financial sector. Quick View: Move mouse or cursor over stock symbol (ticker) to view short-term Technical chart and over stock name to view long term chart. Click on  to add stock symbol to your watchlist and to add stock symbol to your watchlist and  to view watchlist. Click on any ticker or stock name for detailed market intelligence report for that stock. to view watchlist. Click on any ticker or stock name for detailed market intelligence report for that stock. |
12Stocks.com Performance of Stocks in Financial Sector
| Ticker | Stock Name | Watchlist | Category | Recent Price | Smart Investing & Trading Score | Change % | YTD Change% |
| INBK | First Internet |   | Banks - Regional | 25.25 | 80 | 4.77% | -28.15% |
| BHFAN | Brighthouse | | Insurance Life | 13.16 | 20 | -0.98% | -28.52% |
| MORN | Morningstar | | Financial Data & Stock Exchanges | 233.70 | 0 | -6.11% | -29.37% |
| NCTY | The9 | | Capital Markets | 10.42 | 50 | 3.99% | -30.35% |
| CMTG | Claros Mortgage | | REIT - Mortgage | 3.95 | 46 | -6.82% | -30.53% |
| SITC | SITE Centers | | REIT - Retail | 8.91 | 40 | 2.89% | -32.87% |
| PSEC | Prospect Capital | | Asset Mgmt | 2.67 | 0 | -3.26% | -33.04% |
| RC | Ready Capital | | REIT - Mortgage | 4.32 | 80 | 1.65% | -33.75% |
| FDS | Factset Research | | Financial Data & Stock Exchanges | 301.23 | 0 | -10.36% | -36.49% |
| COLD | Americold Realty | | REIT - Industrial | 12.99 | 0 | -1.96% | -37.66% |
| AFCG | Advanced Flower | | REIT - Mortgage | 4.50 | 40 | 2.51% | -43.19% |
| HDB | HDFC Bank | | Banks - Regional | 35.62 | 50 | -0.97% | -43.78% |
| SLQT | SelectQuote | | Insurance | 2.06 | 20 | 0.98% | -46.77% |
| PMTS | CPI Card | | Credit Services | 15.83 | 60 | 6.89% | -50.22% |
| EHTH | eHealth | | Insurance | 3.96 | 40 | 2.86% | -55.61% |
| SBNY | Signature Bank | | Regional Banks | 0.52 | 0 | 0.00% | -57.02% |
| GGAL | Grupo Financiero | | Banks - Regional | 27.30 | 10 | -7.65% | -60.01% |
| BBAR | BBVA Argentina | | Banks - Regional | 8.31 | 10 | -6.52% | -61.83% |
| BMA | Banco Macro | | Banks - Regional | 40.43 | 10 | -6.91% | -62.74% |
| SUPV | Grupo Supervielle | | Banks - Regional | 5.15 | 10 | -8.04% | -68.70% |
| TGE | Generation Essentials | | Asset Mgmt | 2.56 | 30 | -7.25% | -74.37% |
| AWH | Allied World | | Insurance | 0.03 | 10 | -67.07% | -96.24% |
| SVIIU | Spring Valley | | SPAC | 12.89 | 36 | 0.00% | -100.00% |
| IRRX | Integrated Rail | | SPAC | 17.00 | 36 | 0.00% | -100.00% |
| ALCYU | Alchemy s | | SPAC | 10.96 | 36 | 0.00% | -100.00% |
| For chart view version of above stock list: Chart View ➞ 0 - 25 , 25 - 50 , 50 - 75 , 75 - 100 , 100 - 125 , 125 - 150 , 150 - 175 , 175 - 200 , 200 - 225 , 225 - 250 , 250 - 275 , 275 - 300 , 300 - 325 , 325 - 350 , 350 - 375 , 375 - 400 , 400 - 425 , 425 - 450 , 450 - 475 , 475 - 500 , 500 - 525 , 525 - 550 , 550 - 575 , 575 - 600 , 600 - 625 , 625 - 650 , 650 - 675 , 675 - 700 , 700 - 725 , 725 - 750 , 750 - 775 , 775 - 800 , 800 - 825 , 825 - 850 , 850 - 875 , 875 - 900 , 900 - 925 , 925 - 950 , 950 - 975 , 975 - 1000 , 1000 - 1025 , 1025 - 1050 , 1050 - 1075 , 1075 - 1100 , 1100 - 1125 , 1125 - 1150 , 1150 - 1175 , 1175 - 1200 , 1200 - 1225 , 1225 - 1250 , 1250 - 1275 , 1275 - 1300 , 1300 - 1325 , 1325 - 1350 , 1350 - 1375 , 1375 - 1400 , 1400 - 1425 , 1425 - 1450 , 1450 - 1475 , 1475 - 1500 , 1500 - 1525 , 1525 - 1550 | ||
 | Click To Change The Sort Order: By Market Cap or Company Size Performance: Year-to-date, Week and Day |  |
|
Get the most comprehensive stock market coverage daily at 12Stocks.com ➞ Best Stocks Today ➞ Best Stocks Weekly ➞ Best Stocks Year-to-Date ➞ Best Stocks Trends ➞  Best Stocks Today 12Stocks.com Best Nasdaq Stocks ➞ Best S&P 500 Stocks ➞ Best Tech Stocks ➞ Best Biotech Stocks ➞ |
| Detailed Overview of Financial Stocks |
| Financial Technical Overview, Leaders & Laggards, Top Financial ETF Funds & Detailed Financial Stocks List, Charts, Trends & More |
| Financial Sector: Technical Analysis, Trends & YTD Performance | |
| Financial sector is composed of stocks
from banks, brokers, insurance, REITs
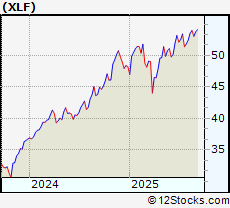
and services subsectors. Financial sector, as represented by XLF, an exchange-traded fund [ETF] that holds basket of Financial stocks (e.g, Bank of America, Goldman Sachs) is up by 13.0735% and is currently underperforming the overall market by -0.7866% year-to-date. Below is a quick view of Technical charts and trends: |
|
 XLF Weekly Chart |
|
| Long Term Trend: Good | |
| Medium Term Trend: Good | |
 XLF Daily Chart |
|
| Short Term Trend: Very Good | |
| Overall Trend Score: 90 | |
| YTD Performance: 13.0735% | |
| **Trend Scores & Views Are Only For Educational Purposes And Not For Investing | |
| 12Stocks.com: Top Performing Financial Sector Stocks | |||||||||||||||||||||||||||||||||||||||||||||||
 The top performing Financial sector stocks year to date are
Now, more recently, over last week, the top performing Financial sector stocks on the move are


|
|||||||||||||||||||||||||||||||||||||||||||||||
| 12Stocks.com: Investing in Financial Sector using Exchange Traded Funds | |
|
The following table shows list of key exchange traded funds (ETF) that
help investors track Financial Index. For detailed view, check out our ETF Funds section of our website. Quick View: Move mouse or cursor over ETF symbol (ticker) to view short-term Technical chart and over ETF name to view long term chart. Click on ticker or stock name for detailed view. Click on to add stock symbol to your watchlist and to view watchlist. |
12Stocks.com List of ETFs that track Financial Index
| Ticker | ETF Name | Watchlist | Recent Price | Smart Investing & Trading Score | Change % | Week % | Year-to-date % |
| CHIX | China Financials | | 10.57 | 20 | 0 | 0 | 0% |
| 12Stocks.com: Charts, Trends, Fundamental Data and Performances of Financial Stocks | |
|
We now take in-depth look at all Financial stocks including charts, multi-period performances and overall trends (as measured by Smart Investing & Trading Score). One can sort Financial stocks (click link to choose) by Daily, Weekly and by Year-to-Date performances. Also, one can sort by size of the company or by market capitalization. |
| Select Your Default Chart Type: | |||||
| |||||
| Click on stock symbol or name for detailed view. Click on to add stock symbol to your watchlist and to view watchlist. Quick View: Move mouse or cursor over "Daily" to quickly view daily Technical stock chart and over "Weekly" to view weekly Technical stock chart. | |||||

 | INBK First Internet Bancorp |
| Sector: Financials | |
| SubSector: Banks - Regional | |
| MarketCap: 212.86 Millions | |
| Recent Price: 25.25 Smart Investing & Trading Score: 80 | |
| Day Percent Change: 4.77178% Day Change: -0.2 | |
| Week Change: 5.20833% Year-to-date Change: -28.1% | |
| INBK Links: Profile News Message Board | |
| Charts:- Daily , Weekly | |
| Add INBK to Watchlist: View: Get Complete INBK Trend Analysis ➞ | |
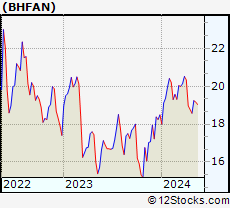 | BHFAN Brighthouse Financial, Inc. |
| Sector: Financials | |
| SubSector: Insurance Life | |
| MarketCap: 60157 Millions | |
| Recent Price: 13.16 Smart Investing & Trading Score: 20 | |
| Day Percent Change: -0.978179% Day Change: -0.15 | |
| Week Change: -2.15613% Year-to-date Change: -28.5% | |
| BHFAN Links: Profile News Message Board | |
| Charts:- Daily , Weekly | |
| Add BHFAN to Watchlist: View: Get Complete BHFAN Trend Analysis ➞ | |
 | MORN Morningstar Inc |
| Sector: Financials | |
| SubSector: Financial Data & Stock Exchanges | |
| MarketCap: 10849.8 Millions | |
| Recent Price: 233.70 Smart Investing & Trading Score: 0 | |
| Day Percent Change: -6.11441% Day Change: -13.17 | |
| Week Change: -7.02208% Year-to-date Change: -29.4% | |
| MORN Links: Profile News Message Board | |
| Charts:- Daily , Weekly | |
| Add MORN to Watchlist: View: Get Complete MORN Trend Analysis ➞ | |
 | NCTY The9 Limited ADR |
| Sector: Financials | |
| SubSector: Capital Markets | |
| MarketCap: 118.27 Millions | |
| Recent Price: 10.42 Smart Investing & Trading Score: 50 | |
| Day Percent Change: 3.99202% Day Change: 0.17 | |
| Week Change: 9.56888% Year-to-date Change: -30.3% | |
| NCTY Links: Profile News Message Board | |
| Charts:- Daily , Weekly | |
| Add NCTY to Watchlist: View: Get Complete NCTY Trend Analysis ➞ | |
 | CMTG Claros Mortgage Trust Inc |
| Sector: Financials | |
| SubSector: REIT - Mortgage | |
| MarketCap: 538.31 Millions | |
| Recent Price: 3.95 Smart Investing & Trading Score: 46 | |
| Day Percent Change: -6.82% Day Change: -0.23 | |
| Week Change: -9.51% Year-to-date Change: -30.5% | |
| CMTG Links: Profile News Message Board | |
| Charts:- Daily , Weekly | |
| Add CMTG to Watchlist: View: Get Complete CMTG Trend Analysis ➞ | |
 | SITC SITE Centers Corp |
| Sector: Financials | |
| SubSector: REIT - Retail | |
| MarketCap: 489.84 Millions | |
| Recent Price: 8.91 Smart Investing & Trading Score: 40 | |
| Day Percent Change: 2.88684% Day Change: 0.01 | |
| Week Change: -0.112108% Year-to-date Change: -32.9% | |
| SITC Links: Profile News Message Board | |
| Charts:- Daily , Weekly | |
| Add SITC to Watchlist: View: Get Complete SITC Trend Analysis ➞ | |
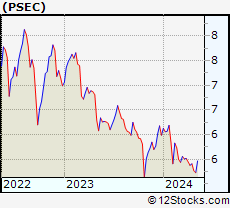 | PSEC Prospect Capital Corp |
| Sector: Financials | |
| SubSector: Asset Management | |
| MarketCap: 1336.17 Millions | |
| Recent Price: 2.67 Smart Investing & Trading Score: 0 | |
| Day Percent Change: -3.26087% Day Change: -0.01 | |
| Week Change: -4.30108% Year-to-date Change: -33.0% | |
| PSEC Links: Profile News Message Board | |
| Charts:- Daily , Weekly | |
| Add PSEC to Watchlist: View: Get Complete PSEC Trend Analysis ➞ | |
 | RC Ready Capital Corp |
| Sector: Financials | |
| SubSector: REIT - Mortgage | |
| MarketCap: 704.96 Millions | |
| Recent Price: 4.32 Smart Investing & Trading Score: 80 | |
| Day Percent Change: 1.64706% Day Change: -0.14 | |
| Week Change: 5.10949% Year-to-date Change: -33.7% | |
| RC Links: Profile News Message Board | |
| Charts:- Daily , Weekly | |
| Add RC to Watchlist: View: Get Complete RC Trend Analysis ➞ | |
 | FDS Factset Research Systems Inc |
| Sector: Financials | |
| SubSector: Financial Data & Stock Exchanges | |
| MarketCap: 14026.7 Millions | |
| Recent Price: 301.23 Smart Investing & Trading Score: 0 | |
| Day Percent Change: -10.3589% Day Change: -31.97 | |
| Week Change: -16.7321% Year-to-date Change: -36.5% | |
| FDS Links: Profile News Message Board | |
| Charts:- Daily , Weekly | |
| Add FDS to Watchlist: View: Get Complete FDS Trend Analysis ➞ | |
 | COLD Americold Realty Trust Inc |
| Sector: Financials | |
| SubSector: REIT - Industrial | |
| MarketCap: 3978.63 Millions | |
| Recent Price: 12.99 Smart Investing & Trading Score: 0 | |
| Day Percent Change: -1.96226% Day Change: -0.24 | |
| Week Change: -1.59091% Year-to-date Change: -37.7% | |
| COLD Links: Profile News Message Board | |
| Charts:- Daily , Weekly | |
| Add COLD to Watchlist: View: Get Complete COLD Trend Analysis ➞ | |
 | AFCG Advanced Flower Capital Inc |
| Sector: Financials | |
| SubSector: REIT - Mortgage | |
| MarketCap: 103.48 Millions | |
| Recent Price: 4.50 Smart Investing & Trading Score: 40 | |
| Day Percent Change: 2.50569% Day Change: 0.12 | |
| Week Change: 0% Year-to-date Change: -43.2% | |
| AFCG Links: Profile News Message Board | |
| Charts:- Daily , Weekly | |
| Add AFCG to Watchlist: View: Get Complete AFCG Trend Analysis ➞ | |
 | HDB HDFC Bank Ltd. ADR |
| Sector: Financials | |
| SubSector: Banks - Regional | |
| MarketCap: 361333 Millions | |
| Recent Price: 35.62 Smart Investing & Trading Score: 50 | |
| Day Percent Change: -0.973033% Day Change: 0.43 | |
| Week Change: 1.13572% Year-to-date Change: -43.8% | |
| HDB Links: Profile News Message Board | |
| Charts:- Daily , Weekly | |
| Add HDB to Watchlist: View: Get Complete HDB Trend Analysis ➞ | |
 | SLQT SelectQuote Inc |
| Sector: Financials | |
| SubSector: Insurance Brokers | |
| MarketCap: 357.73 Millions | |
| Recent Price: 2.06 Smart Investing & Trading Score: 20 | |
| Day Percent Change: 0.980392% Day Change: 0.76 | |
| Week Change: 5.10204% Year-to-date Change: -46.8% | |
| SLQT Links: Profile News Message Board | |
| Charts:- Daily , Weekly | |
| Add SLQT to Watchlist: View: Get Complete SLQT Trend Analysis ➞ | |
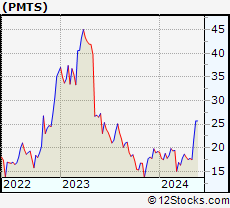 | PMTS CPI Card Group Inc |
| Sector: Financials | |
| SubSector: Credit Services | |
| MarketCap: 162.12 Millions | |
| Recent Price: 15.83 Smart Investing & Trading Score: 60 | |
| Day Percent Change: 6.88724% Day Change: -0.16 | |
| Week Change: 9.13478% Year-to-date Change: -50.2% | |
| PMTS Links: Profile News Message Board | |
| Charts:- Daily , Weekly | |
| Add PMTS to Watchlist: View: Get Complete PMTS Trend Analysis ➞ | |
 | EHTH eHealth Inc |
| Sector: Financials | |
| SubSector: Insurance Brokers | |
| MarketCap: 124.98 Millions | |
| Recent Price: 3.96 Smart Investing & Trading Score: 40 | |
| Day Percent Change: 2.85714% Day Change: 0.16 | |
| Week Change: 5.03979% Year-to-date Change: -55.6% | |
| EHTH Links: Profile News Message Board | |
| Charts:- Daily , Weekly | |
| Add EHTH to Watchlist: View: Get Complete EHTH Trend Analysis ➞ | |
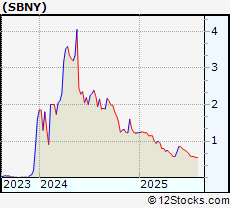 | SBNY Signature Bank |
| Sector: Financials | |
| SubSector: Regional - Mid-Atlantic Banks | |
| MarketCap: 4774.49 Millions | |
| Recent Price: 0.52 Smart Investing & Trading Score: 0 | |
| Day Percent Change: 0% Day Change: -0.01 | |
| Week Change: 4% Year-to-date Change: -57.0% | |
| SBNY Links: Profile News Message Board | |
| Charts:- Daily , Weekly | |
| Add SBNY to Watchlist: View: Get Complete SBNY Trend Analysis ➞ | |
 | GGAL Grupo Financiero Galicia ADR |
| Sector: Financials | |
| SubSector: Banks - Regional | |
| MarketCap: 5313.25 Millions | |
| Recent Price: 27.30 Smart Investing & Trading Score: 10 | |
| Day Percent Change: -7.64547% Day Change: -0.16 | |
| Week Change: -14.8737% Year-to-date Change: -60.0% | |
| GGAL Links: Profile News Message Board | |
| Charts:- Daily , Weekly | |
| Add GGAL to Watchlist: View: Get Complete GGAL Trend Analysis ➞ | |
 | BBAR BBVA Argentina ADR |
| Sector: Financials | |
| SubSector: Banks - Regional | |
| MarketCap: 2518.28 Millions | |
| Recent Price: 8.31 Smart Investing & Trading Score: 10 | |
| Day Percent Change: -6.52418% Day Change: -0.79 | |
| Week Change: -33.4135% Year-to-date Change: -61.8% | |
| BBAR Links: Profile News Message Board | |
| Charts:- Daily , Weekly | |
| Add BBAR to Watchlist: View: Get Complete BBAR Trend Analysis ➞ | |
 | BMA Banco Macro S.A. ADR |
| Sector: Financials | |
| SubSector: Banks - Regional | |
| MarketCap: 3700.73 Millions | |
| Recent Price: 40.43 Smart Investing & Trading Score: 10 | |
| Day Percent Change: -6.90767% Day Change: -0.23 | |
| Week Change: -14.7406% Year-to-date Change: -62.7% | |
| BMA Links: Profile News Message Board | |
| Charts:- Daily , Weekly | |
| Add BMA to Watchlist: View: Get Complete BMA Trend Analysis ➞ | |
 | SUPV Grupo Supervielle S.A. ADR |
| Sector: Financials | |
| SubSector: Banks - Regional | |
| MarketCap: 632.79 Millions | |
| Recent Price: 5.15 Smart Investing & Trading Score: 10 | |
| Day Percent Change: -8.03571% Day Change: -0.1 | |
| Week Change: -17.7316% Year-to-date Change: -68.7% | |
| SUPV Links: Profile News Message Board | |
| Charts:- Daily , Weekly | |
| Add SUPV to Watchlist: View: Get Complete SUPV Trend Analysis ➞ | |
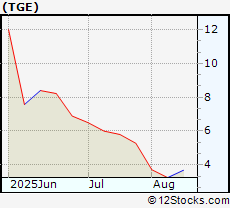 | TGE Generation Essentials Group |
| Sector: Financials | |
| SubSector: Asset Management | |
| MarketCap: 142.96 Millions | |
| Recent Price: 2.56 Smart Investing & Trading Score: 30 | |
| Day Percent Change: -7.24638% Day Change: -0.07 | |
| Week Change: -17.4194% Year-to-date Change: -74.4% | |
| TGE Links: Profile News Message Board | |
| Charts:- Daily , Weekly | |
| Add TGE to Watchlist: View: Get Complete TGE Trend Analysis ➞ | |
 | AWH Allied World Assurance Company Holdings, AG |
| Sector: Financials | |
| SubSector: Property & Casualty Insurance | |
| MarketCap: 4663.47 Millions | |
| Recent Price: 0.03 Smart Investing & Trading Score: 10 | |
| Day Percent Change: -67.0732% Day Change: -9999 | |
| Week Change: -72.3077% Year-to-date Change: -96.2% | |
| AWH Links: Profile News Message Board | |
| Charts:- Daily , Weekly | |
| Add AWH to Watchlist: View: Get Complete AWH Trend Analysis ➞ | |
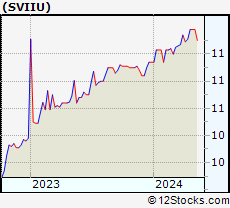 | SVIIU Spring Valley Acquisition Corp. II |
| Sector: Financials | |
| SubSector: SPAC | |
| MarketCap: 324 Millions | |
| Recent Price: 12.89 Smart Investing & Trading Score: 36 | |
| Day Percent Change: 0% Day Change: -9999 | |
| Week Change: -100% Year-to-date Change: -100.0% | |
| SVIIU Links: Profile News Message Board | |
| Charts:- Daily , Weekly | |
| Add SVIIU to Watchlist: View: Get Complete SVIIU Trend Analysis ➞ | |
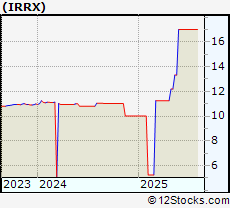 | IRRX Integrated Rail and Resources Acquisition Corp. |
| Sector: Financials | |
| SubSector: SPAC | |
| MarketCap: 251 Millions | |
| Recent Price: 17.00 Smart Investing & Trading Score: 36 | |
| Day Percent Change: 0% Day Change: -9999 | |
| Week Change: -100% Year-to-date Change: -100.0% | |
| IRRX Links: Profile News Message Board | |
| Charts:- Daily , Weekly | |
| Add IRRX to Watchlist: View: Get Complete IRRX Trend Analysis ➞ | |
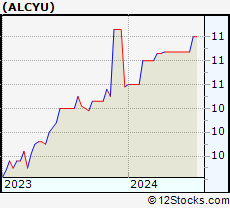 | ALCYU Alchemy Investments Acquisition Corp 1 |
| Sector: Financials | |
| SubSector: SPAC | |
| MarketCap: 147 Millions | |
| Recent Price: 10.96 Smart Investing & Trading Score: 36 | |
| Day Percent Change: 0% Day Change: -9999 | |
| Week Change: -100% Year-to-date Change: -100.0% | |
| ALCYU Links: Profile News Message Board | |
| Charts:- Daily , Weekly | |
| Add ALCYU to Watchlist: View: Get Complete ALCYU Trend Analysis ➞ | |
| For tabular summary view of above stock list: Summary View ➞ 0 - 25 , 25 - 50 , 50 - 75 , 75 - 100 , 100 - 125 , 125 - 150 , 150 - 175 , 175 - 200 , 200 - 225 , 225 - 250 , 250 - 275 , 275 - 300 , 300 - 325 , 325 - 350 , 350 - 375 , 375 - 400 , 400 - 425 , 425 - 450 , 450 - 475 , 475 - 500 , 500 - 525 , 525 - 550 , 550 - 575 , 575 - 600 , 600 - 625 , 625 - 650 , 650 - 675 , 675 - 700 , 700 - 725 , 725 - 750 , 750 - 775 , 775 - 800 , 800 - 825 , 825 - 850 , 850 - 875 , 875 - 900 , 900 - 925 , 925 - 950 , 950 - 975 , 975 - 1000 , 1000 - 1025 , 1025 - 1050 , 1050 - 1075 , 1075 - 1100 , 1100 - 1125 , 1125 - 1150 , 1150 - 1175 , 1175 - 1200 , 1200 - 1225 , 1225 - 1250 , 1250 - 1275 , 1275 - 1300 , 1300 - 1325 , 1325 - 1350 , 1350 - 1375 , 1375 - 1400 , 1400 - 1425 , 1425 - 1450 , 1450 - 1475 , 1475 - 1500 , 1500 - 1525 , 1525 - 1550 | ||
| Click To Change The Sort Order: By Market Cap or Company Size Performance: Year-to-date, Week and Day | |
| Select Chart Type: | ||
|
Best Stocks Today 12Stocks.com |
© 2025 12Stocks.com Terms & Conditions Privacy Contact Us
All Information Provided Only For Education And Not To Be Used For Investing or Trading. See Terms & Conditions


One More Thing ... Get Best Stocks Delivered Daily!
Never Ever Miss A Move With Our Top Ten Stocks Lists
Find Best Stocks In Any Market - Bull or Bear Market
Take A Peek At Our Top Ten Stocks Lists: Daily, Weekly, Year-to-Date & Top Trends
Find Best Stocks In Any Market - Bull or Bear Market
Take A Peek At Our Top Ten Stocks Lists: Daily, Weekly, Year-to-Date & Top Trends
Financial Stocks With Best Up Trends [0-bearish to 100-bullish]: Better Home[100], AMREP Corp[100], PIMCO California[100], Torchmark [100], PIMCO California[100], Triumph Bancorp[100], StepStone [100], Radian [100], National Bank[100], PIMCO Municipal[100], MARA [100]
Best Financial Stocks Year-to-Date:
Insight Select[12384.6%], Oxford Lane[292.479%], Better Home[250.328%], Metalpha Technology[213.274%], Robinhood Markets[206.567%], Cipher Mining[145.528%], Mr. Cooper[133.957%], Banco Santander[130.037%], IHS Holding[117.61%], Deutsche Bank[114.776%], LoanDepot [110.733%] Best Financial Stocks This Week:
Colony Starwood[15929900%], Blackhawk Network[91300%], Macquarie Global[81662.9%], Credit Suisse[63241.6%], Pennsylvania Real[23823%], First Republic[22570.9%], Select ome[14000%], CorEnergy Infrastructure[6797.78%], FedNat Holding[5525%], BlackRock Municipal[5340%], BlackRock MuniYield[3379.04%] Best Financial Stocks Daily:
Better Home[13.3451%], AMREP Corp[11.992%], PIMCO California[11.9545%], Torchmark [11.8363%], Forge Global[11.5409%], PIMCO California[11.4754%], BlackRock Muni[10.8108%], Blackrock MuniYield[10.72%], Triumph Bancorp[10.2661%], StepStone [8.74771%], BlackRock MuniYield[8.15348%]