
 Login Sign Up


| |||||
 |  | ||||

| 12Stocks.com Market Intelligence |
Best Financial Stocks
| In a hurry? Financial Stocks Lists: Performance Trends Table, Stock Charts
Sort Financial stocks: Daily, Weekly, Year-to-Date, Market Cap & Trends. Filter Financial stocks list by size:All Financial Large Mid-Range Small & MicroCap |
| 12Stocks.com Financial Stocks Performances & Trends Daily | |||||||||
|
|  The overall Smart Investing & Trading Score is 33 (0-bearish to 100-bullish) which puts Financial sector in short term bearish to neutral trend. The Smart Investing & Trading Score from previous trading session is 26 and hence an improvement of trend.
| ||||||||
Here are the Smart Investing & Trading Scores of the most requested Financial stocks at 12Stocks.com (click stock name for detailed review):
|


| 12Stocks.com: Investing in Financial sector with Stocks | |
|
The following table helps investors and traders sort through current performance and trends (as measured by Smart Investing & Trading Score) of various
stocks in the Financial sector. Quick View: Move mouse or cursor over stock symbol (ticker) to view short-term Technical chart and over stock name to view long term chart. Click on  to add stock symbol to your watchlist and to add stock symbol to your watchlist and  to view watchlist. Click on any ticker or stock name for detailed market intelligence report for that stock. to view watchlist. Click on any ticker or stock name for detailed market intelligence report for that stock. |
12Stocks.com Performance of Stocks in Financial Sector
| Ticker | Stock Name | Watchlist | Category | Recent Price | Smart Investing & Trading Score | Change % | YTD Change% |
| AON | Aon |   | Insurance | 360.40 | 64 | 1.96 | 0.53% |
| NLY | Annaly Capital | | Mortgage | 20.91 | 100 | 1.95 | 18.27% |
| ELS | Equity LifeStyle | | REIT | 61.43 | 59 | 1.94 | -7.03% |
| JLL | Jones Lang | | Property Mgmt | 270.43 | 78 | 1.91 | 6.83% |
| ATLC | Atlanticus | | Credit Services | 48.93 | 30 | 1.90 | -12.28% |
| IVZ | Invesco | | Asset Mgmt | 21.00 | 70 | 1.89 | 21.49% |
| FIHL | Fidelis Insurance | | Insurance - | 15.15 | 32 | 1.88 | -15.86% |
| UVSP | Univest | | Regional Banks | 28.65 | 18 | 1.88 | -2.25% |
| WAFD | Washington Federal | | S&L | 29.41 | 68 | 1.87 | -7.95% |
| PFSI | PennyMac | | Mortgage | 97.63 | 78 | 1.86 | -4.13% |
| FBNC | First Bancorp | | Regional Banks | 49.26 | 63 | 1.86 | 12.65% |
| VLY | Valley National | | Regional Banks | 9.35 | 56 | 1.85 | 4.54% |
| TPL | Texas Pacific | | Real Estatet | 952.04 | 22 | 1.84 | -13.82% |
| HBCP | Home Bancorp | | S&L | 51.86 | 43 | 1.83 | 12.81% |
| CBU | Community Bank | | Regional Banks | 52.40 | 17 | 1.83 | -14.34% |
| COR | CoreSite Realty | | REIT - Office | 293.64 | 75 | 1.83 | 30.99% |
| NDAQ | Nasdaq | | Investments | 96.91 | 90 | 1.83 | 25.77% |
| INBK | First Internet | | Regional Banks | 21.85 | 17 | 1.82 | -39.15% |
| ONB | Old National | | Regional Banks | 20.77 | 23 | 1.81 | -3.71% |
| KKR | KKR | | Asset Mgmt | 145.13 | 58 | 1.81 | -1.76% |
| TRV | Travelers | | Insurance | 263.00 | 42 | 1.81 | 9.63% |
| EQH | Equitable | | Insurance | 50.99 | 32 | 1.80 | 8.61% |
| ACRE | Ares Commercial | | Mortgage | 4.52 | 50 | 1.80 | -20.73% |
| CPF | Central Pacific | | Regional Banks | 26.62 | 38 | 1.80 | -7.50% |
| BANR | Banner | | Regional Banks | 62.18 | 43 | 1.80 | -6.23% |
| For chart view version of above stock list: Chart View ➞ 0 - 25 , 25 - 50 , 50 - 75 , 75 - 100 , 100 - 125 , 125 - 150 , 150 - 175 , 175 - 200 , 200 - 225 , 225 - 250 , 250 - 275 , 275 - 300 , 300 - 325 , 325 - 350 , 350 - 375 , 375 - 400 , 400 - 425 , 425 - 450 , 450 - 475 , 475 - 500 , 500 - 525 , 525 - 550 , 550 - 575 | ||
 | Click To Change The Sort Order: By Market Cap or Company Size Performance: Year-to-date, Week and Day |  |
|
Get the most comprehensive stock market coverage daily at 12Stocks.com ➞ Best Stocks Today ➞ Best Stocks Weekly ➞ Best Stocks Year-to-Date ➞ Best Stocks Trends ➞  Best Stocks Today 12Stocks.com Best Nasdaq Stocks ➞ Best S&P 500 Stocks ➞ Best Tech Stocks ➞ Best Biotech Stocks ➞ |
| Detailed Overview of Financial Stocks |
| Financial Technical Overview, Leaders & Laggards, Top Financial ETF Funds & Detailed Financial Stocks List, Charts, Trends & More |
| Financial Sector: Technical Analysis, Trends & YTD Performance | |
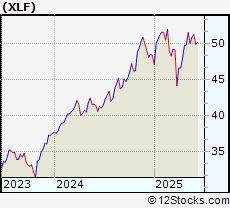
| Financial sector is composed of stocks
from banks, brokers, insurance, REITs
and services subsectors. Financial sector, as represented by XLF, an exchange-traded fund [ETF] that holds basket of Financial stocks (e.g, Bank of America, Goldman Sachs) is up by 7.8% and is currently outperforming the overall market by 0.27% year-to-date. Below is a quick view of Technical charts and trends: |
|
 XLF Weekly Chart |
|
| Long Term Trend: Good | |
| Medium Term Trend: Not Good | |
 XLF Daily Chart |
|
| Short Term Trend: Not Good | |
| Overall Trend Score: 33 | |
| YTD Performance: 7.8% | |
| **Trend Scores & Views Are Only For Educational Purposes And Not For Investing | |
| 12Stocks.com: Top Performing Financial Sector Stocks | ||||||||||||||||||||||||||||||||||||||||||||||||
 The top performing Financial sector stocks year to date are
Now, more recently, over last week, the top performing Financial sector stocks on the move are


|
||||||||||||||||||||||||||||||||||||||||||||||||
| 12Stocks.com: Investing in Financial Sector using Exchange Traded Funds | |
|
The following table shows list of key exchange traded funds (ETF) that
help investors track Financial Index. For detailed view, check out our ETF Funds section of our website. Quick View: Move mouse or cursor over ETF symbol (ticker) to view short-term Technical chart and over ETF name to view long term chart. Click on ticker or stock name for detailed view. Click on to add stock symbol to your watchlist and to view watchlist. |
12Stocks.com List of ETFs that track Financial Index
| Ticker | ETF Name | Watchlist | Recent Price | Smart Investing & Trading Score | Change % | Week % | Year-to-date % |
| XLF | Financial | | 51.91 | 33 | 0.99 | 0.99 | 7.8% |
| IAI | Broker-Dealers & Secs | | 174.97 | 63 | 2.34 | 2.34 | 21.82% |
| KBE | Bank | | 55.98 | 43 | 1.3 | 1.3 | 1.64% |
| FAS | Financial Bull 3X | | 161.82 | 33 | 2.91 | 2.91 | 7.48% |
| FAZ | Financial Bear 3X | | 4.54 | 62 | -2.78 | -2.78 | -27.4% |
| UYG | Financials | | 92.87 | 26 | 1.72 | 1.72 | 9% |
| KIE | Insurance | | 56.42 | 25 | 1.27 | 1.27 | 0.32% |
| 12Stocks.com: Charts, Trends, Fundamental Data and Performances of Financial Stocks | |
|
We now take in-depth look at all Financial stocks including charts, multi-period performances and overall trends (as measured by Smart Investing & Trading Score). One can sort Financial stocks (click link to choose) by Daily, Weekly and by Year-to-Date performances. Also, one can sort by size of the company or by market capitalization. |
| Select Your Default Chart Type: | |||||
| |||||
| Click on stock symbol or name for detailed view. Click on to add stock symbol to your watchlist and to view watchlist. Quick View: Move mouse or cursor over "Daily" to quickly view daily Technical stock chart and over "Weekly" to view weekly Technical stock chart. | |||||

 | AON Aon plc |
| Sector: Financials | |
| SubSector: Insurance Brokers | |
| MarketCap: 36870.1 Millions | |
| Recent Price: 360.40 Smart Investing & Trading Score: 64 | |
| Day Percent Change: 1.96% Day Change: 6.94 | |
| Week Change: 1.96% Year-to-date Change: 0.5% | |
| AON Links: Profile News Message Board | |
| Charts:- Daily , Weekly | |
| Add AON to Watchlist: View: Get Complete AON Trend Analysis ➞ | |
 | NLY Annaly Capital Management, Inc. |
| Sector: Financials | |
| SubSector: Mortgage Investment | |
| MarketCap: 9127.79 Millions | |
| Recent Price: 20.91 Smart Investing & Trading Score: 100 | |
| Day Percent Change: 1.95% Day Change: 0.4 | |
| Week Change: 1.95% Year-to-date Change: 18.3% | |
| NLY Links: Profile News Message Board | |
| Charts:- Daily , Weekly | |
| Add NLY to Watchlist: View: Get Complete NLY Trend Analysis ➞ | |
 | ELS Equity LifeStyle Properties, Inc. |
| Sector: Financials | |
| SubSector: REIT - Residential | |
| MarketCap: 9570.61 Millions | |
| Recent Price: 61.43 Smart Investing & Trading Score: 59 | |
| Day Percent Change: 1.94% Day Change: 1.17 | |
| Week Change: 1.94% Year-to-date Change: -7.0% | |
| ELS Links: Profile News Message Board | |
| Charts:- Daily , Weekly | |
| Add ELS to Watchlist: View: Get Complete ELS Trend Analysis ➞ | |
 | JLL Jones Lang LaSalle Incorporated |
| Sector: Financials | |
| SubSector: Property Management | |
| MarketCap: 5259.32 Millions | |
| Recent Price: 270.43 Smart Investing & Trading Score: 78 | |
| Day Percent Change: 1.91% Day Change: 5.08 | |
| Week Change: 1.91% Year-to-date Change: 6.8% | |
| JLL Links: Profile News Message Board | |
| Charts:- Daily , Weekly | |
| Add JLL to Watchlist: View: Get Complete JLL Trend Analysis ➞ | |
 | ATLC Atlanticus Holdings Corporation |
| Sector: Financials | |
| SubSector: Credit Services | |
| MarketCap: 122.008 Millions | |
| Recent Price: 48.93 Smart Investing & Trading Score: 30 | |
| Day Percent Change: 1.9% Day Change: 0.91 | |
| Week Change: 1.9% Year-to-date Change: -12.3% | |
| ATLC Links: Profile News Message Board | |
| Charts:- Daily , Weekly | |
| Add ATLC to Watchlist: View: Get Complete ATLC Trend Analysis ➞ | |
 | IVZ Invesco Ltd. |
| Sector: Financials | |
| SubSector: Asset Management | |
| MarketCap: 4578.23 Millions | |
| Recent Price: 21.00 Smart Investing & Trading Score: 70 | |
| Day Percent Change: 1.89% Day Change: 0.39 | |
| Week Change: 1.89% Year-to-date Change: 21.5% | |
| IVZ Links: Profile News Message Board | |
| Charts:- Daily , Weekly | |
| Add IVZ to Watchlist: View: Get Complete IVZ Trend Analysis ➞ | |
 | FIHL Fidelis Insurance Holdings Limited |
| Sector: Financials | |
| SubSector: Insurance - Diversified | |
| MarketCap: 1590 Millions | |
| Recent Price: 15.15 Smart Investing & Trading Score: 32 | |
| Day Percent Change: 1.88% Day Change: 0.28 | |
| Week Change: 1.88% Year-to-date Change: -15.9% | |
| FIHL Links: Profile News Message Board | |
| Charts:- Daily , Weekly | |
| Add FIHL to Watchlist: View: Get Complete FIHL Trend Analysis ➞ | |
 | UVSP Univest Financial Corporation |
| Sector: Financials | |
| SubSector: Regional - Northeast Banks | |
| MarketCap: 467.999 Millions | |
| Recent Price: 28.65 Smart Investing & Trading Score: 18 | |
| Day Percent Change: 1.88% Day Change: 0.53 | |
| Week Change: 1.88% Year-to-date Change: -2.3% | |
| UVSP Links: Profile News Message Board | |
| Charts:- Daily , Weekly | |
| Add UVSP to Watchlist: View: Get Complete UVSP Trend Analysis ➞ | |
 | WAFD Washington Federal, Inc. |
| Sector: Financials | |
| SubSector: Savings & Loans | |
| MarketCap: 2219.2 Millions | |
| Recent Price: 29.41 Smart Investing & Trading Score: 68 | |
| Day Percent Change: 1.87% Day Change: 0.54 | |
| Week Change: 1.87% Year-to-date Change: -8.0% | |
| WAFD Links: Profile News Message Board | |
| Charts:- Daily , Weekly | |
| Add WAFD to Watchlist: View: Get Complete WAFD Trend Analysis ➞ | |
 | PFSI PennyMac Financial Services, Inc. |
| Sector: Financials | |
| SubSector: Mortgage Investment | |
| MarketCap: 1588.09 Millions | |
| Recent Price: 97.63 Smart Investing & Trading Score: 78 | |
| Day Percent Change: 1.86% Day Change: 1.78 | |
| Week Change: 1.86% Year-to-date Change: -4.1% | |
| PFSI Links: Profile News Message Board | |
| Charts:- Daily , Weekly | |
| Add PFSI to Watchlist: View: Get Complete PFSI Trend Analysis ➞ | |
 | FBNC First Bancorp |
| Sector: Financials | |
| SubSector: Regional - Mid-Atlantic Banks | |
| MarketCap: 664.959 Millions | |
| Recent Price: 49.26 Smart Investing & Trading Score: 63 | |
| Day Percent Change: 1.86% Day Change: 0.9 | |
| Week Change: 1.86% Year-to-date Change: 12.7% | |
| FBNC Links: Profile News Message Board | |
| Charts:- Daily , Weekly | |
| Add FBNC to Watchlist: View: Get Complete FBNC Trend Analysis ➞ | |
 | VLY Valley National Bancorp |
| Sector: Financials | |
| SubSector: Regional - Northeast Banks | |
| MarketCap: 2843.09 Millions | |
| Recent Price: 9.35 Smart Investing & Trading Score: 56 | |
| Day Percent Change: 1.85% Day Change: 0.17 | |
| Week Change: 1.85% Year-to-date Change: 4.5% | |
| VLY Links: Profile News Message Board | |
| Charts:- Daily , Weekly | |
| Add VLY to Watchlist: View: Get Complete VLY Trend Analysis ➞ | |
 | TPL Texas Pacific Land Trust |
| Sector: Financials | |
| SubSector: Real Estate Development | |
| MarketCap: 3052.29 Millions | |
| Recent Price: 952.04 Smart Investing & Trading Score: 22 | |
| Day Percent Change: 1.84% Day Change: 17.24 | |
| Week Change: 1.84% Year-to-date Change: -13.8% | |
| TPL Links: Profile News Message Board | |
| Charts:- Daily , Weekly | |
| Add TPL to Watchlist: View: Get Complete TPL Trend Analysis ➞ | |
 | HBCP Home Bancorp, Inc. |
| Sector: Financials | |
| SubSector: Savings & Loans | |
| MarketCap: 206.83 Millions | |
| Recent Price: 51.86 Smart Investing & Trading Score: 43 | |
| Day Percent Change: 1.83% Day Change: 0.93 | |
| Week Change: 1.83% Year-to-date Change: 12.8% | |
| HBCP Links: Profile News Message Board | |
| Charts:- Daily , Weekly | |
| Add HBCP to Watchlist: View: Get Complete HBCP Trend Analysis ➞ | |
 | CBU Community Bank System, Inc. |
| Sector: Financials | |
| SubSector: Regional - Midwest Banks | |
| MarketCap: 2787.8 Millions | |
| Recent Price: 52.40 Smart Investing & Trading Score: 17 | |
| Day Percent Change: 1.83% Day Change: 0.94 | |
| Week Change: 1.83% Year-to-date Change: -14.3% | |
| CBU Links: Profile News Message Board | |
| Charts:- Daily , Weekly | |
| Add CBU to Watchlist: View: Get Complete CBU Trend Analysis ➞ | |
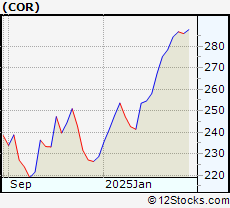 | COR CoreSite Realty Corporation |
| Sector: Financials | |
| SubSector: REIT - Office | |
| MarketCap: 4164.46 Millions | |
| Recent Price: 293.64 Smart Investing & Trading Score: 75 | |
| Day Percent Change: 1.83% Day Change: 5.29 | |
| Week Change: 1.83% Year-to-date Change: 31.0% | |
| COR Links: Profile News Message Board | |
| Charts:- Daily , Weekly | |
| Add COR to Watchlist: View: Get Complete COR Trend Analysis ➞ | |
 | NDAQ Nasdaq, Inc. |
| Sector: Financials | |
| SubSector: Diversified Investments | |
| MarketCap: 14885.2 Millions | |
| Recent Price: 96.91 Smart Investing & Trading Score: 90 | |
| Day Percent Change: 1.83% Day Change: 1.74 | |
| Week Change: 1.83% Year-to-date Change: 25.8% | |
| NDAQ Links: Profile News Message Board | |
| Charts:- Daily , Weekly | |
| Add NDAQ to Watchlist: View: Get Complete NDAQ Trend Analysis ➞ | |
 | INBK First Internet Bancorp |
| Sector: Financials | |
| SubSector: Regional - Midwest Banks | |
| MarketCap: 149.07 Millions | |
| Recent Price: 21.85 Smart Investing & Trading Score: 17 | |
| Day Percent Change: 1.82% Day Change: 0.39 | |
| Week Change: 1.82% Year-to-date Change: -39.2% | |
| INBK Links: Profile News Message Board | |
| Charts:- Daily , Weekly | |
| Add INBK to Watchlist: View: Get Complete INBK Trend Analysis ➞ | |
 | ONB Old National Bancorp |
| Sector: Financials | |
| SubSector: Regional - Midwest Banks | |
| MarketCap: 2340.8 Millions | |
| Recent Price: 20.77 Smart Investing & Trading Score: 23 | |
| Day Percent Change: 1.81% Day Change: 0.37 | |
| Week Change: 1.81% Year-to-date Change: -3.7% | |
| ONB Links: Profile News Message Board | |
| Charts:- Daily , Weekly | |
| Add ONB to Watchlist: View: Get Complete ONB Trend Analysis ➞ | |
 | KKR KKR & Co. Inc. |
| Sector: Financials | |
| SubSector: Asset Management | |
| MarketCap: 17722.5 Millions | |
| Recent Price: 145.13 Smart Investing & Trading Score: 58 | |
| Day Percent Change: 1.81% Day Change: 2.58 | |
| Week Change: 1.81% Year-to-date Change: -1.8% | |
| KKR Links: Profile News Message Board | |
| Charts:- Daily , Weekly | |
| Add KKR to Watchlist: View: Get Complete KKR Trend Analysis ➞ | |
 | TRV The Travelers Companies, Inc. |
| Sector: Financials | |
| SubSector: Property & Casualty Insurance | |
| MarketCap: 25155.9 Millions | |
| Recent Price: 263.00 Smart Investing & Trading Score: 42 | |
| Day Percent Change: 1.81% Day Change: 4.68 | |
| Week Change: 1.81% Year-to-date Change: 9.6% | |
| TRV Links: Profile News Message Board | |
| Charts:- Daily , Weekly | |
| Add TRV to Watchlist: View: Get Complete TRV Trend Analysis ➞ | |
 | EQH Equitable Holdings, Inc. |
| Sector: Financials | |
| SubSector: Insurance Brokers | |
| MarketCap: 5520.07 Millions | |
| Recent Price: 50.99 Smart Investing & Trading Score: 32 | |
| Day Percent Change: 1.8% Day Change: 0.9 | |
| Week Change: 1.8% Year-to-date Change: 8.6% | |
| EQH Links: Profile News Message Board | |
| Charts:- Daily , Weekly | |
| Add EQH to Watchlist: View: Get Complete EQH Trend Analysis ➞ | |
 | ACRE Ares Commercial Real Estate Corporation |
| Sector: Financials | |
| SubSector: Mortgage Investment | |
| MarketCap: 242.339 Millions | |
| Recent Price: 4.52 Smart Investing & Trading Score: 50 | |
| Day Percent Change: 1.8% Day Change: 0.08 | |
| Week Change: 1.8% Year-to-date Change: -20.7% | |
| ACRE Links: Profile News Message Board | |
| Charts:- Daily , Weekly | |
| Add ACRE to Watchlist: View: Get Complete ACRE Trend Analysis ➞ | |
 | CPF Central Pacific Financial Corp. |
| Sector: Financials | |
| SubSector: Regional - Pacific Banks | |
| MarketCap: 407.429 Millions | |
| Recent Price: 26.62 Smart Investing & Trading Score: 38 | |
| Day Percent Change: 1.8% Day Change: 0.47 | |
| Week Change: 1.8% Year-to-date Change: -7.5% | |
| CPF Links: Profile News Message Board | |
| Charts:- Daily , Weekly | |
| Add CPF to Watchlist: View: Get Complete CPF Trend Analysis ➞ | |
 | BANR Banner Corporation |
| Sector: Financials | |
| SubSector: Regional - Mid-Atlantic Banks | |
| MarketCap: 1187.09 Millions | |
| Recent Price: 62.18 Smart Investing & Trading Score: 43 | |
| Day Percent Change: 1.8% Day Change: 1.1 | |
| Week Change: 1.8% Year-to-date Change: -6.2% | |
| BANR Links: Profile News Message Board | |
| Charts:- Daily , Weekly | |
| Add BANR to Watchlist: View: Get Complete BANR Trend Analysis ➞ | |
| For tabular summary view of above stock list: Summary View ➞ 0 - 25 , 25 - 50 , 50 - 75 , 75 - 100 , 100 - 125 , 125 - 150 , 150 - 175 , 175 - 200 , 200 - 225 , 225 - 250 , 250 - 275 , 275 - 300 , 300 - 325 , 325 - 350 , 350 - 375 , 375 - 400 , 400 - 425 , 425 - 450 , 450 - 475 , 475 - 500 , 500 - 525 , 525 - 550 , 550 - 575 | ||
| Click To Change The Sort Order: By Market Cap or Company Size Performance: Year-to-date, Week and Day | |
| Select Chart Type: | ||
|
Best Stocks Today 12Stocks.com |
© 2025 12Stocks.com Terms & Conditions Privacy Contact Us
All Information Provided Only For Education And Not To Be Used For Investing or Trading. See Terms & Conditions


One More Thing ... Get Best Stocks Delivered Daily!
Never Ever Miss A Move With Our Top Ten Stocks Lists
Find Best Stocks In Any Market - Bull or Bear Market
Take A Peek At Our Top Ten Stocks Lists: Daily, Weekly, Year-to-Date & Top Trends
Find Best Stocks In Any Market - Bull or Bear Market
Take A Peek At Our Top Ten Stocks Lists: Daily, Weekly, Year-to-Date & Top Trends
Financial Stocks With Best Up Trends [0-bearish to 100-bullish]: Uniti [100], LendingTree [100], Mercury General[100], Perella Weinberg[100], Broadstone Net[100], LendingClub [100], TPG RE[100], CareTrust REIT[100], Stewart Information[100], Healthcare Realty[100], VICI Properties[100]
Best Financial Stocks Year-to-Date:
ESSA Bancorp[3207.77%], Easterly Government[108.45%], Mr. Cooper[86.58%], Heritage Insurance[75.29%], Root [65.29%], Industrial Logistics[64.89%], Rocket [58.42%], Diversified Healthcare[49.61%], ProAssurance [49.59%], Uniti [47.09%], SoFi Technologies[41.62%] Best Financial Stocks This Week:
Uniti [64.77%], Industrial Logistics[11.36%], LendingTree [7.32%], eXp World[7.27%], EverQuote [6.89%], Camping World[6.84%], First Foundation[6.69%], Diamond Hill[5.46%], Mercury General[5.36%], Cipher Mining[5.27%], AlTi Global[5.13%] Best Financial Stocks Daily:
Uniti [64.77%], Industrial Logistics[11.36%], LendingTree [7.32%], eXp World[7.27%], EverQuote [6.89%], Camping World[6.84%], First Foundation[6.69%], Diamond Hill[5.46%], Mercury General[5.36%], Cipher Mining[5.27%], AlTi Global[5.13%]