
 Login Sign Up


| |||||
 |  | ||||

| 12Stocks.com Market Intelligence |
Best Financial Stocks
| In a hurry? Financial Stocks Lists: Performance Trends Table, Stock Charts
Sort Financial stocks: Daily, Weekly, Year-to-Date, Market Cap & Trends. Filter Financial stocks list by size:All Financial Large Mid-Range Small & MicroCap |
| 12Stocks.com Financial Stocks Performances & Trends Daily | |||||||||
|
|  The overall Smart Investing & Trading Score is 90 (0-bearish to 100-bullish) which puts Financial sector in short term bullish trend. The Smart Investing & Trading Score from previous trading session is 60 and an improvement of trend continues.
| ||||||||
Here are the Smart Investing & Trading Scores of the most requested Financial stocks at 12Stocks.com (click stock name for detailed review):
|


| 12Stocks.com: Investing in Financial sector with Stocks | |
|
The following table helps investors and traders sort through current performance and trends (as measured by Smart Investing & Trading Score) of various
stocks in the Financial sector. Quick View: Move mouse or cursor over stock symbol (ticker) to view short-term Technical chart and over stock name to view long term chart. Click on  to add stock symbol to your watchlist and to add stock symbol to your watchlist and  to view watchlist. Click on any ticker or stock name for detailed market intelligence report for that stock. to view watchlist. Click on any ticker or stock name for detailed market intelligence report for that stock. |
12Stocks.com Performance of Stocks in Financial Sector
| Ticker | Stock Name | Watchlist | Category | Recent Price | Smart Investing & Trading Score | Change % | Weekly Change% |
| SRG | Seritage Growth |   | Real Estate Services | 4.10 | 60 | 0.99% | -8.48% |
| NREF | NexPoint Real | | REIT - Mortgage | 13.98 | 20 | 0.22% | -8.51% |
| AFCG | Advanced Flower | | REIT - Mortgage | 4.39 | 20 | -3.52% | -8.73% |
| NRZ | New Residential | | Mortgage | 7.17 | 10 | 1.41% | -9.14% |
| CMTG | Claros Mortgage | | REIT - Mortgage | 3.63 | 46 | -6.82% | -9.51% |
| ALTI | AlTi Global | | Asset Mgmt | 3.68 | 10 | -1.08% | -9.58% |
| PGRE | Paramount | | REIT - Office | 6.53 | 20 | -11.64% | -9.81% |
| TPVG | TriplePoint Venture | | Asset Mgmt | 6.09 | 0 | -2.09% | -9.91% |
| GGP | GGP | | REIT - Retail | 53.97 | 60 | 0.60% | -10.20% |
| FSK | FS KKR | | Asset Mgmt | 16.03 | 0 | -5.20% | -10.20% |
| BHFAN | Brighthouse | | Insurance Life | 13.29 | 20 | 0.76% | -10.20% |
| FRGE | Forge Global | | Capital Markets | 16.03 | 10 | 1.84% | -10.35% |
| CHMI | Cherry Hill | | REIT - Mortgage | 2.61 | 0 | -0.38% | -10.62% |
| HIFR | InfraREIT | | REIT - Industrial | 24.74 | 10 | 0.08% | -11.77% |
| BHFAP | Brighthouse | | Life Insurance | 16.05 | 10 | 0.63% | -13.43% |
| NGHCO | National General | | Insurance | 14.09 | 10 | -1.47% | -13.98% |
| ENH | Endurance Specialty | | Insurance | 211.43 | 0 | -4.07% | -14.22% |
| MBRG | Middleburg | | Regional Banks | 30.05 | 30 | 1.35% | -15.04% |
| FBC | Flagstar Bancorp | | S&L | 31.78 | 30 | 0.57% | -15.34% |
| FDS | Factset Research | | Financial Data & Stock Exchanges | 304.07 | 0 | -9.51% | -15.95% |
| FIV | First Trust | | Asset Mgmt | 0.52 | 10 | 0.00% | -17.46% |
| FSBK | First South | | S&L | 14.94 | 30 | 0.74% | -18.85% |
| TRCB | Two River | | Regional Banks | 14.23 | 40 | 0.49% | -19.60% |
| PBCT | People s | | S&L | 16.07 | 20 | 1.26% | -19.61% |
| YDKN | Yadkin | | Regional Banks | 15.12 | 10 | 0.53% | -19.83% |
| For chart view version of above stock list: Chart View ➞ 0 - 25 , 25 - 50 , 50 - 75 , 75 - 100 , 100 - 125 , 125 - 150 , 150 - 175 , 175 - 200 , 200 - 225 , 225 - 250 , 250 - 275 , 275 - 300 , 300 - 325 , 325 - 350 , 350 - 375 , 375 - 400 , 400 - 425 , 425 - 450 , 450 - 475 , 475 - 500 , 500 - 525 , 525 - 550 , 550 - 575 , 575 - 600 , 600 - 625 , 625 - 650 , 650 - 675 , 675 - 700 , 700 - 725 , 725 - 750 , 750 - 775 , 775 - 800 , 800 - 825 , 825 - 850 , 850 - 875 , 875 - 900 , 900 - 925 , 925 - 950 , 950 - 975 , 975 - 1000 , 1000 - 1025 , 1025 - 1050 , 1050 - 1075 , 1075 - 1100 , 1100 - 1125 , 1125 - 1150 , 1150 - 1175 , 1175 - 1200 , 1200 - 1225 , 1225 - 1250 , 1250 - 1275 , 1275 - 1300 , 1300 - 1325 , 1325 - 1350 , 1350 - 1375 , 1375 - 1400 , 1400 - 1425 , 1425 - 1450 , 1450 - 1475 , 1475 - 1500 , 1500 - 1525 , 1525 - 1550 | ||
 | Click To Change The Sort Order: By Market Cap or Company Size Performance: Year-to-date, Week and Day |  |
|
Get the most comprehensive stock market coverage daily at 12Stocks.com ➞ Best Stocks Today ➞ Best Stocks Weekly ➞ Best Stocks Year-to-Date ➞ Best Stocks Trends ➞  Best Stocks Today 12Stocks.com Best Nasdaq Stocks ➞ Best S&P 500 Stocks ➞ Best Tech Stocks ➞ Best Biotech Stocks ➞ |
| Detailed Overview of Financial Stocks |
| Financial Technical Overview, Leaders & Laggards, Top Financial ETF Funds & Detailed Financial Stocks List, Charts, Trends & More |
| Financial Sector: Technical Analysis, Trends & YTD Performance | |
| Financial sector is composed of stocks
from banks, brokers, insurance, REITs
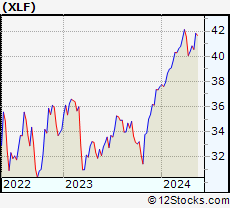
and services subsectors. Financial sector, as represented by XLF, an exchange-traded fund [ETF] that holds basket of Financial stocks (e.g, Bank of America, Goldman Sachs) is up by 13.1362% and is currently underperforming the overall market by -0.884% year-to-date. Below is a quick view of Technical charts and trends: |
|
 XLF Weekly Chart |
|
| Long Term Trend: Good | |
| Medium Term Trend: Good | |
 XLF Daily Chart |
|
| Short Term Trend: Very Good | |
| Overall Trend Score: 90 | |
| YTD Performance: 13.1362% | |
| **Trend Scores & Views Are Only For Educational Purposes And Not For Investing | |
| 12Stocks.com: Top Performing Financial Sector Stocks | |||||||||||||||||||||||||||||||||||||||||||||||
 The top performing Financial sector stocks year to date are
Now, more recently, over last week, the top performing Financial sector stocks on the move are


|
|||||||||||||||||||||||||||||||||||||||||||||||
| 12Stocks.com: Investing in Financial Sector using Exchange Traded Funds | |
|
The following table shows list of key exchange traded funds (ETF) that
help investors track Financial Index. For detailed view, check out our ETF Funds section of our website. Quick View: Move mouse or cursor over ETF symbol (ticker) to view short-term Technical chart and over ETF name to view long term chart. Click on ticker or stock name for detailed view. Click on to add stock symbol to your watchlist and to view watchlist. |
12Stocks.com List of ETFs that track Financial Index
| Ticker | ETF Name | Watchlist | Recent Price | Smart Investing & Trading Score | Change % | Week % | Year-to-date % |
| CHIX | China Financials | | 10.57 | 20 | 0 | 0 | 0% |
| 12Stocks.com: Charts, Trends, Fundamental Data and Performances of Financial Stocks | |
|
We now take in-depth look at all Financial stocks including charts, multi-period performances and overall trends (as measured by Smart Investing & Trading Score). One can sort Financial stocks (click link to choose) by Daily, Weekly and by Year-to-Date performances. Also, one can sort by size of the company or by market capitalization. |
| Select Your Default Chart Type: | |||||
| |||||
| Click on stock symbol or name for detailed view. Click on to add stock symbol to your watchlist and to view watchlist. Quick View: Move mouse or cursor over "Daily" to quickly view daily Technical stock chart and over "Weekly" to view weekly Technical stock chart. | |||||

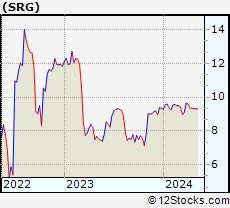 | SRG Seritage Growth Properties |
| Sector: Financials | |
| SubSector: Real Estate Services | |
| MarketCap: 210.65 Millions | |
| Recent Price: 4.10 Smart Investing & Trading Score: 60 | |
| Day Percent Change: 0.985222% Day Change: -0.01 | |
| Week Change: -8.48214% Year-to-date Change: -1.4% | |
| SRG Links: Profile News Message Board | |
| Charts:- Daily , Weekly | |
| Add SRG to Watchlist: View: Get Complete SRG Trend Analysis ➞ | |
 | NREF NexPoint Real Estate Finance Inc |
| Sector: Financials | |
| SubSector: REIT - Mortgage | |
| MarketCap: 272.74 Millions | |
| Recent Price: 13.98 Smart Investing & Trading Score: 20 | |
| Day Percent Change: 0.215054% Day Change: -0.19 | |
| Week Change: -8.50785% Year-to-date Change: -5.4% | |
| NREF Links: Profile News Message Board | |
| Charts:- Daily , Weekly | |
| Add NREF to Watchlist: View: Get Complete NREF Trend Analysis ➞ | |
 | AFCG Advanced Flower Capital Inc |
| Sector: Financials | |
| SubSector: REIT - Mortgage | |
| MarketCap: 103.48 Millions | |
| Recent Price: 4.39 Smart Investing & Trading Score: 20 | |
| Day Percent Change: -3.51648% Day Change: 0.12 | |
| Week Change: -8.73181% Year-to-date Change: -44.6% | |
| AFCG Links: Profile News Message Board | |
| Charts:- Daily , Weekly | |
| Add AFCG to Watchlist: View: Get Complete AFCG Trend Analysis ➞ | |
 | NRZ New Residential Investment Corp. |
| Sector: Financials | |
| SubSector: Mortgage Investment | |
| MarketCap: 3449.79 Millions | |
| Recent Price: 7.17 Smart Investing & Trading Score: 10 | |
| Day Percent Change: 1.41443% Day Change: -9999 | |
| Week Change: -9.13699% Year-to-date Change: 0.0% | |
| NRZ Links: Profile News Message Board | |
| Charts:- Daily , Weekly | |
| Add NRZ to Watchlist: View: Get Complete NRZ Trend Analysis ➞ | |
 | CMTG Claros Mortgage Trust Inc |
| Sector: Financials | |
| SubSector: REIT - Mortgage | |
| MarketCap: 538.31 Millions | |
| Recent Price: 3.63 Smart Investing & Trading Score: 46 | |
| Day Percent Change: -6.82% Day Change: -0.23 | |
| Week Change: -9.51% Year-to-date Change: -30.5% | |
| CMTG Links: Profile News Message Board | |
| Charts:- Daily , Weekly | |
| Add CMTG to Watchlist: View: Get Complete CMTG Trend Analysis ➞ | |
 | ALTI AlTi Global Inc |
| Sector: Financials | |
| SubSector: Asset Management | |
| MarketCap: 607.14 Millions | |
| Recent Price: 3.68 Smart Investing & Trading Score: 10 | |
| Day Percent Change: -1.07527% Day Change: -0.05 | |
| Week Change: -9.58231% Year-to-date Change: -16.2% | |
| ALTI Links: Profile News Message Board | |
| Charts:- Daily , Weekly | |
| Add ALTI to Watchlist: View: Get Complete ALTI Trend Analysis ➞ | |
 | PGRE Paramount Group Inc |
| Sector: Financials | |
| SubSector: REIT - Office | |
| MarketCap: 1798.92 Millions | |
| Recent Price: 6.53 Smart Investing & Trading Score: 20 | |
| Day Percent Change: -11.6373% Day Change: -0.04 | |
| Week Change: -9.80663% Year-to-date Change: 31.7% | |
| PGRE Links: Profile News Message Board | |
| Charts:- Daily , Weekly | |
| Add PGRE to Watchlist: View: Get Complete PGRE Trend Analysis ➞ | |
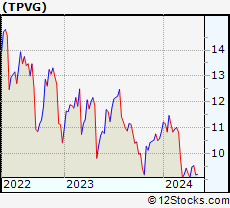 | TPVG TriplePoint Venture Growth BDC Corp |
| Sector: Financials | |
| SubSector: Asset Management | |
| MarketCap: 275.41 Millions | |
| Recent Price: 6.09 Smart Investing & Trading Score: 0 | |
| Day Percent Change: -2.09003% Day Change: 0.18 | |
| Week Change: -9.91124% Year-to-date Change: -13.1% | |
| TPVG Links: Profile News Message Board | |
| Charts:- Daily , Weekly | |
| Add TPVG to Watchlist: View: Get Complete TPVG Trend Analysis ➞ | |
 | GGP GGP Inc. |
| Sector: Financials | |
| SubSector: REIT - Retail | |
| MarketCap: 20902.7 Millions | |
| Recent Price: 53.97 Smart Investing & Trading Score: 60 | |
| Day Percent Change: 0.596459% Day Change: -9999 | |
| Week Change: -10.1997% Year-to-date Change: 0.0% | |
| GGP Links: Profile News Message Board | |
| Charts:- Daily , Weekly | |
| Add GGP to Watchlist: View: Get Complete GGP Trend Analysis ➞ | |
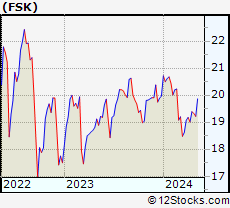 | FSK FS KKR Capital Corp |
| Sector: Financials | |
| SubSector: Asset Management | |
| MarketCap: 5077.6 Millions | |
| Recent Price: 16.03 Smart Investing & Trading Score: 0 | |
| Day Percent Change: -5.20402% Day Change: -0.03 | |
| Week Change: -10.1961% Year-to-date Change: -22.2% | |
| FSK Links: Profile News Message Board | |
| Charts:- Daily , Weekly | |
| Add FSK to Watchlist: View: Get Complete FSK Trend Analysis ➞ | |
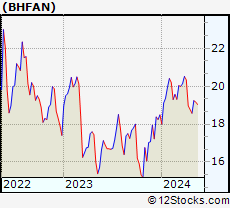 | BHFAN Brighthouse Financial, Inc. |
| Sector: Financials | |
| SubSector: Insurance Life | |
| MarketCap: 60157 Millions | |
| Recent Price: 13.29 Smart Investing & Trading Score: 20 | |
| Day Percent Change: 0.75815% Day Change: -0.15 | |
| Week Change: -10.2027% Year-to-date Change: -27.8% | |
| BHFAN Links: Profile News Message Board | |
| Charts:- Daily , Weekly | |
| Add BHFAN to Watchlist: View: Get Complete BHFAN Trend Analysis ➞ | |
 | FRGE Forge Global Holdings Inc |
| Sector: Financials | |
| SubSector: Capital Markets | |
| MarketCap: 235.58 Millions | |
| Recent Price: 16.03 Smart Investing & Trading Score: 10 | |
| Day Percent Change: 1.84244% Day Change: -0.56 | |
| Week Change: -10.3468% Year-to-date Change: 13.1% | |
| FRGE Links: Profile News Message Board | |
| Charts:- Daily , Weekly | |
| Add FRGE to Watchlist: View: Get Complete FRGE Trend Analysis ➞ | |
 | CHMI Cherry Hill Mortgage Investment Corporation |
| Sector: Financials | |
| SubSector: REIT - Mortgage | |
| MarketCap: 104.53 Millions | |
| Recent Price: 2.61 Smart Investing & Trading Score: 0 | |
| Day Percent Change: -0.381679% Day Change: -0.05 | |
| Week Change: -10.6164% Year-to-date Change: 9.6% | |
| CHMI Links: Profile News Message Board | |
| Charts:- Daily , Weekly | |
| Add CHMI to Watchlist: View: Get Complete CHMI Trend Analysis ➞ | |
 | HIFR InfraREIT, Inc. |
| Sector: Financials | |
| SubSector: REIT - Industrial | |
| MarketCap: 760.89 Millions | |
| Recent Price: 24.74 Smart Investing & Trading Score: 10 | |
| Day Percent Change: 0.0809061% Day Change: -9999 | |
| Week Change: -11.7689% Year-to-date Change: 0.0% | |
| HIFR Links: Profile News Message Board | |
| Charts:- Daily , Weekly | |
| Add HIFR to Watchlist: View: Get Complete HIFR Trend Analysis ➞ | |
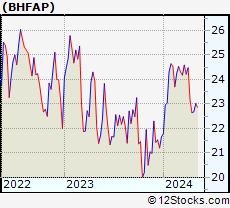 | BHFAP Brighthouse Financial, Inc. |
| Sector: Financials | |
| SubSector: Life Insurance | |
| MarketCap: 1936.76 Millions | |
| Recent Price: 16.05 Smart Investing & Trading Score: 10 | |
| Day Percent Change: 0.626959% Day Change: -0.19 | |
| Week Change: -13.4304% Year-to-date Change: -25.0% | |
| BHFAP Links: Profile News Message Board | |
| Charts:- Daily , Weekly | |
| Add BHFAP to Watchlist: View: Get Complete BHFAP Trend Analysis ➞ | |
 | NGHCO National General Holdings Corp. |
| Sector: Financials | |
| SubSector: Property & Casualty Insurance | |
| MarketCap: 1414.12 Millions | |
| Recent Price: 14.09 Smart Investing & Trading Score: 10 | |
| Day Percent Change: -1.46853% Day Change: -9999 | |
| Week Change: -13.9805% Year-to-date Change: 0.0% | |
| NGHCO Links: Profile News Message Board | |
| Charts:- Daily , Weekly | |
| Add NGHCO to Watchlist: View: Get Complete NGHCO Trend Analysis ➞ | |
 | ENH Endurance Specialty Holdings Ltd. |
| Sector: Financials | |
| SubSector: Property & Casualty Insurance | |
| MarketCap: 6278.44 Millions | |
| Recent Price: 211.43 Smart Investing & Trading Score: 0 | |
| Day Percent Change: -4.07423% Day Change: -9999 | |
| Week Change: -14.2167% Year-to-date Change: 0.0% | |
| ENH Links: Profile News Message Board | |
| Charts:- Daily , Weekly | |
| Add ENH to Watchlist: View: Get Complete ENH Trend Analysis ➞ | |
 | MBRG Middleburg Financial Corporation |
| Sector: Financials | |
| SubSector: Regional - Mid-Atlantic Banks | |
| MarketCap: 254.79 Millions | |
| Recent Price: 30.05 Smart Investing & Trading Score: 30 | |
| Day Percent Change: 1.34907% Day Change: -9999 | |
| Week Change: -15.041% Year-to-date Change: 0.0% | |
| MBRG Links: Profile News Message Board | |
| Charts:- Daily , Weekly | |
| Add MBRG to Watchlist: View: Get Complete MBRG Trend Analysis ➞ | |
 | FBC Flagstar Bancorp, Inc. |
| Sector: Financials | |
| SubSector: Savings & Loans | |
| MarketCap: 1209.3 Millions | |
| Recent Price: 31.78 Smart Investing & Trading Score: 30 | |
| Day Percent Change: 0.56962% Day Change: -9999 | |
| Week Change: -15.3436% Year-to-date Change: 0.0% | |
| FBC Links: Profile News Message Board | |
| Charts:- Daily , Weekly | |
| Add FBC to Watchlist: View: Get Complete FBC Trend Analysis ➞ | |
 | FDS Factset Research Systems Inc |
| Sector: Financials | |
| SubSector: Financial Data & Stock Exchanges | |
| MarketCap: 14026.7 Millions | |
| Recent Price: 304.07 Smart Investing & Trading Score: 0 | |
| Day Percent Change: -9.51375% Day Change: -31.97 | |
| Week Change: -15.947% Year-to-date Change: -35.9% | |
| FDS Links: Profile News Message Board | |
| Charts:- Daily , Weekly | |
| Add FDS to Watchlist: View: Get Complete FDS Trend Analysis ➞ | |
 | FIV First Trust Senior Floating Rate 2022 Target Term Fund |
| Sector: Financials | |
| SubSector: Asset Management | |
| MarketCap: 222.803 Millions | |
| Recent Price: 0.52 Smart Investing & Trading Score: 10 | |
| Day Percent Change: 0% Day Change: -9999 | |
| Week Change: -17.4603% Year-to-date Change: 0.0% | |
| FIV Links: Profile News Message Board | |
| Charts:- Daily , Weekly | |
| Add FIV to Watchlist: View: Get Complete FIV Trend Analysis ➞ | |
 | FSBK First South Bancorp, Inc. |
| Sector: Financials | |
| SubSector: Savings & Loans | |
| MarketCap: 117.45 Millions | |
| Recent Price: 14.94 Smart Investing & Trading Score: 30 | |
| Day Percent Change: 0.74174% Day Change: -9999 | |
| Week Change: -18.8485% Year-to-date Change: 0.0% | |
| FSBK Links: Profile News Message Board | |
| Charts:- Daily , Weekly | |
| Add FSBK to Watchlist: View: Get Complete FSBK Trend Analysis ➞ | |
 | TRCB Two River Bancorp |
| Sector: Financials | |
| SubSector: Regional - Northeast Banks | |
| MarketCap: 148.09 Millions | |
| Recent Price: 14.23 Smart Investing & Trading Score: 40 | |
| Day Percent Change: 0.49435% Day Change: -9999 | |
| Week Change: -19.6045% Year-to-date Change: 0.0% | |
| TRCB Links: Profile News Message Board | |
| Charts:- Daily , Weekly | |
| Add TRCB to Watchlist: View: Get Complete TRCB Trend Analysis ➞ | |
 | PBCT People s United Financial, Inc. |
| Sector: Financials | |
| SubSector: Savings & Loans | |
| MarketCap: 5707.7 Millions | |
| Recent Price: 16.07 Smart Investing & Trading Score: 20 | |
| Day Percent Change: 1.26024% Day Change: -9999 | |
| Week Change: -19.6098% Year-to-date Change: 0.0% | |
| PBCT Links: Profile News Message Board | |
| Charts:- Daily , Weekly | |
| Add PBCT to Watchlist: View: Get Complete PBCT Trend Analysis ➞ | |
 | YDKN Yadkin Financial Corporation |
| Sector: Financials | |
| SubSector: Regional - Mid-Atlantic Banks | |
| MarketCap: 1782.96 Millions | |
| Recent Price: 15.12 Smart Investing & Trading Score: 10 | |
| Day Percent Change: 0.531915% Day Change: -9999 | |
| Week Change: -19.8303% Year-to-date Change: 0.0% | |
| YDKN Links: Profile News Message Board | |
| Charts:- Daily , Weekly | |
| Add YDKN to Watchlist: View: Get Complete YDKN Trend Analysis ➞ | |
| For tabular summary view of above stock list: Summary View ➞ 0 - 25 , 25 - 50 , 50 - 75 , 75 - 100 , 100 - 125 , 125 - 150 , 150 - 175 , 175 - 200 , 200 - 225 , 225 - 250 , 250 - 275 , 275 - 300 , 300 - 325 , 325 - 350 , 350 - 375 , 375 - 400 , 400 - 425 , 425 - 450 , 450 - 475 , 475 - 500 , 500 - 525 , 525 - 550 , 550 - 575 , 575 - 600 , 600 - 625 , 625 - 650 , 650 - 675 , 675 - 700 , 700 - 725 , 725 - 750 , 750 - 775 , 775 - 800 , 800 - 825 , 825 - 850 , 850 - 875 , 875 - 900 , 900 - 925 , 925 - 950 , 950 - 975 , 975 - 1000 , 1000 - 1025 , 1025 - 1050 , 1050 - 1075 , 1075 - 1100 , 1100 - 1125 , 1125 - 1150 , 1150 - 1175 , 1175 - 1200 , 1200 - 1225 , 1225 - 1250 , 1250 - 1275 , 1275 - 1300 , 1300 - 1325 , 1325 - 1350 , 1350 - 1375 , 1375 - 1400 , 1400 - 1425 , 1425 - 1450 , 1450 - 1475 , 1475 - 1500 , 1500 - 1525 , 1525 - 1550 | ||
| Click To Change The Sort Order: By Market Cap or Company Size Performance: Year-to-date, Week and Day | |
| Select Chart Type: | ||
|
Best Stocks Today 12Stocks.com |
© 2025 12Stocks.com Terms & Conditions Privacy Contact Us
All Information Provided Only For Education And Not To Be Used For Investing or Trading. See Terms & Conditions


One More Thing ... Get Best Stocks Delivered Daily!
Never Ever Miss A Move With Our Top Ten Stocks Lists
Find Best Stocks In Any Market - Bull or Bear Market
Take A Peek At Our Top Ten Stocks Lists: Daily, Weekly, Year-to-Date & Top Trends
Find Best Stocks In Any Market - Bull or Bear Market
Take A Peek At Our Top Ten Stocks Lists: Daily, Weekly, Year-to-Date & Top Trends
Financial Stocks With Best Up Trends [0-bearish to 100-bullish]: PIMCO California[100], Torchmark [100], B. Riley[100], PIMCO California[100], Better Home[100], Triumph Bancorp[100], Cipher Mining[100], PIMCO Municipal[100], PIMCO Municipal[100], SuRo Capital[100], Jefferies [100]
Best Financial Stocks Year-to-Date:
Insight Select[12384.6%], Oxford Lane[292.029%], Better Home[209.081%], Robinhood Markets[200.811%], Metalpha Technology[196.46%], Cipher Mining[156.315%], Mr. Cooper[135%], LoanDepot [133.846%], Banco Santander[129.354%], IHS Holding[117.61%], Deutsche Bank[114.955%] Best Financial Stocks This Week:
Colony Starwood[15929900%], Blackhawk Network[91300%], Macquarie Global[81662.9%], Credit Suisse[63241.6%], Pennsylvania Real[23823%], First Republic[22570.9%], Select ome[14000%], CorEnergy Infrastructure[6797.78%], FedNat Holding[5525%], BlackRock Municipal[5340%], BlackRock MuniYield[3379.04%] Best Financial Stocks Daily:
Offerpad [12.3487%], PIMCO California[11.9545%], Torchmark [11.8363%], B. Riley[11.5556%], PIMCO California[11.4754%], BlackRock Muni[10.8108%], Blackrock MuniYield[10.72%], Better Home[10.5675%], Triumph Bancorp[10.2661%], Coinbase Global[8.50387%], BlackRock MuniYield[8.15348%]