
 Login Sign Up


| |||||
 |  | ||||

| 12Stocks.com Market Intelligence |
Best Financial Stocks
| In a hurry? Financial Stocks Lists: Performance Trends Table, Stock Charts
Sort Financial stocks: Daily, Weekly, Year-to-Date, Market Cap & Trends. Filter Financial stocks list by size:All Financial Large Mid-Range Small & MicroCap |
| 12Stocks.com Financial Stocks Performances & Trends Daily | |||||||||
|
|  The overall Smart Investing & Trading Score is 68 (0-bearish to 100-bullish) which puts Financial sector in short term neutral to bullish trend. The Smart Investing & Trading Score from previous trading session is 75 and hence a deterioration of trend.
| ||||||||
Here are the Smart Investing & Trading Scores of the most requested Financial stocks at 12Stocks.com (click stock name for detailed review):
|


| 12Stocks.com: Investing in Financial sector with Stocks | |
|
The following table helps investors and traders sort through current performance and trends (as measured by Smart Investing & Trading Score) of various
stocks in the Financial sector. Quick View: Move mouse or cursor over stock symbol (ticker) to view short-term Technical chart and over stock name to view long term chart. Click on  to add stock symbol to your watchlist and to add stock symbol to your watchlist and  to view watchlist. Click on any ticker or stock name for detailed market intelligence report for that stock. to view watchlist. Click on any ticker or stock name for detailed market intelligence report for that stock. |
12Stocks.com Performance of Stocks in Financial Sector
| Ticker | Stock Name | Watchlist | Category | Recent Price | Smart Investing & Trading Score | Change % | Weekly Change% |
| EFX | Equifax |   | Credit Services | 225.71 | 32 | 0.56% | 4.40% |
| TRTX | TPG RE | | Mortgage | 7.84 | 90 | 0.00% | 4.39% |
| WU | Western Union | | Credit Services | 13.59 | 75 | 1.42% | 4.38% |
| IVR | Invesco Mortgage | | Mortgage | 8.61 | 49 | 0.35% | 4.36% |
| ACNB | ACNB | | Regional - Southwest Banks | 33.90 | 42 | -1.02% | 4.34% |
| PRA | ProAssurance | | Insurance | 13.97 | 100 | 1.67% | 4.33% |
| UTF | Cohen & Steers Infrastructure Fund | | Closed-End Fund - Equity | 23.18 | 60 | 2.79% | 4.32% |
| CUZ | Cousins Properties | | REIT - | 23.12 | 67 | 1.85% | 4.29% |
| PNFP | Pinnacle | | Regional Banks | 82.91 | 54 | 1.93% | 4.29% |
| MMI | Marcus & Millichap | | Real Estatet | 32.35 | 49 | -0.03% | 4.29% |
| FFWM | First Foundation | | Regional Banks | 7.05 | 39 | 1.59% | 4.29% |
| LX | LexinFintech | | Credit Services | 1.70 | 10 | 0.59% | 4.29% |
| UCBI | United Community | | Regional Banks | 26.33 | 69 | 0.57% | 4.28% |
| HPI | John Hancock | | Closed-End Fund - Debt | 16.34 | 57 | 0.43% | 4.21% |
| COF | Capital One | | Credit Services | 148.87 | 93 | 0.66% | 4.17% |
| BNRE | Brookfield Reinsurance | | Insurance - Reinsurance | 40.48 | 88 | 0.20% | 4.17% |
| ABCB | Ameris Bancorp | | Regional Banks | 48.20 | 74 | 0.71% | 4.15% |
| VRTS | Virtus | | Asset Mgmt | 234.70 | 37 | 0.67% | 4.15% |
| PMX | PIMCO Municipal | | Closed-End Fund - Debt | 7.55 | 100 | 1.07% | 4.14% |
| EQH | Equitable | | Insurance | 38.07 | 60 | 2.15% | 4.13% |
| KMPR | Kemper | | Insurance | 60.40 | 100 | 3.32% | 4.12% |
| FNB | F.N.B | | Regional Banks | 13.67 | 85 | 0.29% | 4.11% |
| GSHD | Goosehead Insurance | | Insurance | 60.20 | 44 | 0.27% | 4.10% |
| UDR | UDR | | REIT | 37.89 | 100 | 1.66% | 4.09% |
| FCF | First Commonwealth | | Regional Banks | 13.74 | 67 | 1.18% | 4.09% |
| For chart view version of above stock list: Chart View ➞ 0 - 25 , 25 - 50 , 50 - 75 , 75 - 100 , 100 - 125 , 125 - 150 , 150 - 175 , 175 - 200 , 200 - 225 , 225 - 250 , 250 - 275 , 275 - 300 , 300 - 325 , 325 - 350 , 350 - 375 , 375 - 400 , 400 - 425 , 425 - 450 , 450 - 475 , 475 - 500 , 500 - 525 , 525 - 550 , 550 - 575 , 575 - 600 , 600 - 625 , 625 - 650 , 650 - 675 , 675 - 700 , 700 - 725 , 725 - 750 , 750 - 775 , 775 - 800 , 800 - 825 , 825 - 850 , 850 - 875 , 875 - 900 , 900 - 925 , 925 - 950 , 950 - 975 , 975 - 1000 , 1000 - 1025 , 1025 - 1050 , 1050 - 1075 , 1075 - 1100 , 1100 - 1125 , 1125 - 1150 , 1150 - 1175 , 1175 - 1200 , 1200 - 1225 , 1225 - 1250 | ||
 | Click To Change The Sort Order: By Market Cap or Company Size Performance: Year-to-date, Week and Day |  |
|
Get the most comprehensive stock market coverage daily at 12Stocks.com ➞ Best Stocks Today ➞ Best Stocks Weekly ➞ Best Stocks Year-to-Date ➞ Best Stocks Trends ➞  Best Stocks Today 12Stocks.com Best Nasdaq Stocks ➞ Best S&P 500 Stocks ➞ Best Tech Stocks ➞ Best Biotech Stocks ➞ |
| Detailed Overview of Financial Stocks |
| Financial Technical Overview, Leaders & Laggards, Top Financial ETF Funds & Detailed Financial Stocks List, Charts, Trends & More |
| Financial Sector: Technical Analysis, Trends & YTD Performance | |
| Financial sector is composed of stocks
from banks, brokers, insurance, REITs
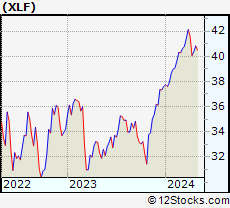
and services subsectors. Financial sector, as represented by XLF, an exchange-traded fund [ETF] that holds basket of Financial stocks (e.g, Bank of America, Goldman Sachs) is up by 9.36% and is currently outperforming the overall market by 3.7% year-to-date. Below is a quick view of Technical charts and trends: |
|
 XLF Weekly Chart |
|
| Long Term Trend: Very Good | |
| Medium Term Trend: Not Good | |
 XLF Daily Chart |
|
| Short Term Trend: Very Good | |
| Overall Trend Score: 68 | |
| YTD Performance: 9.36% | |
| **Trend Scores & Views Are Only For Educational Purposes And Not For Investing | |
| 12Stocks.com: Top Performing Financial Sector Stocks | ||||||||||||||||||||||||||||||||||||||||||||||||
 The top performing Financial sector stocks year to date are
Now, more recently, over last week, the top performing Financial sector stocks on the move are


|
||||||||||||||||||||||||||||||||||||||||||||||||
| 12Stocks.com: Investing in Financial Sector using Exchange Traded Funds | |
|
The following table shows list of key exchange traded funds (ETF) that
help investors track Financial Index. For detailed view, check out our ETF Funds section of our website. Quick View: Move mouse or cursor over ETF symbol (ticker) to view short-term Technical chart and over ETF name to view long term chart. Click on ticker or stock name for detailed view. Click on to add stock symbol to your watchlist and to view watchlist. |
12Stocks.com List of ETFs that track Financial Index
| Ticker | ETF Name | Watchlist | Recent Price | Smart Investing & Trading Score | Change % | Week % | Year-to-date % |
| XLF | Financial | | 41.12 | 68 | -0.02 | 1.83 | 9.36% |
| IAI | Broker-Dealers & Secs | | 112.90 | 75 | -0.18 | 1.68 | 4.03% |
| IYF | Financials | | 92.96 | 68 | -0.20 | 1.82 | 8.84% |
| IYG | Financial Services | | 64.92 | 68 | 0.07 | 2.37 | 8.69% |
| KRE | Regional Banking | | 49.01 | 74 | 0.57 | 3.57 | -6.52% |
| IXG | Global Financials | | 84.19 | 53 | -0.54 | 1.61 | 7.14% |
| VFH | Financials | | 99.72 | 75 | -0.10 | 2.02 | 8.09% |
| KBE | Bank | | 45.96 | 100 | 0.70 | 3.49 | -0.13% |
| FAS | Financial Bull 3X | | 103.20 | 68 | -0.35 | 5.38 | 24.86% |
| FAZ | Financial Bear 3X | | 10.61 | 32 | 0.28 | -5.27 | -22.38% |
| UYG | Financials | | 64.47 | 68 | -0.42 | 3.25 | 16.79% |
| IAT | Regional Banks | | 42.21 | 68 | 0.76 | 3.61 | 0.88% |
| KIE | Insurance | | 49.67 | 58 | -0.16 | 1.2 | 9.84% |
| PSCF | SmallCap Financials | | 46.98 | 58 | 0.07 | 3.33 | -4.46% |
| EUFN | Europe Financials | | 22.42 | 68 | -1.10 | 2.14 | 6.97% |
| PGF | Financial Preferred | | 14.73 | 29 | 0.07 | 1.38 | 1.03% |
| 12Stocks.com: Charts, Trends, Fundamental Data and Performances of Financial Stocks | |
|
We now take in-depth look at all Financial stocks including charts, multi-period performances and overall trends (as measured by Smart Investing & Trading Score). One can sort Financial stocks (click link to choose) by Daily, Weekly and by Year-to-Date performances. Also, one can sort by size of the company or by market capitalization. |
| Select Your Default Chart Type: | |||||
| |||||
| Click on stock symbol or name for detailed view. Click on to add stock symbol to your watchlist and to view watchlist. Quick View: Move mouse or cursor over "Daily" to quickly view daily Technical stock chart and over "Weekly" to view weekly Technical stock chart. | |||||

 | EFX Equifax Inc. |
| Sector: Financials | |
| SubSector: Credit Services | |
| MarketCap: 13754.6 Millions | |
| Recent Price: 225.71 Smart Investing & Trading Score: 32 | |
| Day Percent Change: 0.56% Day Change: 1.25 | |
| Week Change: 4.4% Year-to-date Change: -8.7% | |
| EFX Links: Profile News Message Board | |
| Charts:- Daily , Weekly | |
| Add EFX to Watchlist: View: Get Complete EFX Trend Analysis ➞ | |
 | TRTX TPG RE Finance Trust, Inc. |
| Sector: Financials | |
| SubSector: Mortgage Investment | |
| MarketCap: 607.739 Millions | |
| Recent Price: 7.84 Smart Investing & Trading Score: 90 | |
| Day Percent Change: 0.00% Day Change: 0.00 | |
| Week Change: 4.39% Year-to-date Change: 20.6% | |
| TRTX Links: Profile News Message Board | |
| Charts:- Daily , Weekly | |
| Add TRTX to Watchlist: View: Get Complete TRTX Trend Analysis ➞ | |
 | WU The Western Union Company |
| Sector: Financials | |
| SubSector: Credit Services | |
| MarketCap: 7974.48 Millions | |
| Recent Price: 13.59 Smart Investing & Trading Score: 75 | |
| Day Percent Change: 1.42% Day Change: 0.19 | |
| Week Change: 4.38% Year-to-date Change: 14.0% | |
| WU Links: Profile News Message Board | |
| Charts:- Daily , Weekly | |
| Add WU to Watchlist: View: Get Complete WU Trend Analysis ➞ | |
 | IVR Invesco Mortgage Capital Inc. |
| Sector: Financials | |
| SubSector: Mortgage Investment | |
| MarketCap: 1182.19 Millions | |
| Recent Price: 8.61 Smart Investing & Trading Score: 49 | |
| Day Percent Change: 0.35% Day Change: 0.03 | |
| Week Change: 4.36% Year-to-date Change: -2.8% | |
| IVR Links: Profile News Message Board | |
| Charts:- Daily , Weekly | |
| Add IVR to Watchlist: View: Get Complete IVR Trend Analysis ➞ | |
 | ACNB ACNB Corporation |
| Sector: Financials | |
| SubSector: Regional - Southwest Banks | |
| MarketCap: 231.065 Millions | |
| Recent Price: 33.90 Smart Investing & Trading Score: 42 | |
| Day Percent Change: -1.02% Day Change: -0.35 | |
| Week Change: 4.34% Year-to-date Change: -24.3% | |
| ACNB Links: Profile News Message Board | |
| Charts:- Daily , Weekly | |
| Add ACNB to Watchlist: View: Get Complete ACNB Trend Analysis ➞ | |
 | PRA ProAssurance Corporation |
| Sector: Financials | |
| SubSector: Accident & Health Insurance | |
| MarketCap: 1434.6 Millions | |
| Recent Price: 13.97 Smart Investing & Trading Score: 100 | |
| Day Percent Change: 1.67% Day Change: 0.23 | |
| Week Change: 4.33% Year-to-date Change: 1.3% | |
| PRA Links: Profile News Message Board | |
| Charts:- Daily , Weekly | |
| Add PRA to Watchlist: View: Get Complete PRA Trend Analysis ➞ | |
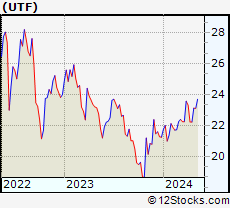 | UTF Cohen & Steers Infrastructure Fund, Inc |
| Sector: Financials | |
| SubSector: Closed-End Fund - Equity | |
| MarketCap: 1195.37 Millions | |
| Recent Price: 23.18 Smart Investing & Trading Score: 60 | |
| Day Percent Change: 2.79% Day Change: 0.63 | |
| Week Change: 4.32% Year-to-date Change: 9.1% | |
| UTF Links: Profile News Message Board | |
| Charts:- Daily , Weekly | |
| Add UTF to Watchlist: View: Get Complete UTF Trend Analysis ➞ | |
 | CUZ Cousins Properties Incorporated |
| Sector: Financials | |
| SubSector: REIT - Diversified | |
| MarketCap: 3828.13 Millions | |
| Recent Price: 23.12 Smart Investing & Trading Score: 67 | |
| Day Percent Change: 1.85% Day Change: 0.42 | |
| Week Change: 4.29% Year-to-date Change: -5.1% | |
| CUZ Links: Profile News Message Board | |
| Charts:- Daily , Weekly | |
| Add CUZ to Watchlist: View: Get Complete CUZ Trend Analysis ➞ | |
 | PNFP Pinnacle Financial Partners, Inc. |
| Sector: Financials | |
| SubSector: Regional - Southeast Banks | |
| MarketCap: 2771.75 Millions | |
| Recent Price: 82.91 Smart Investing & Trading Score: 54 | |
| Day Percent Change: 1.93% Day Change: 1.57 | |
| Week Change: 4.29% Year-to-date Change: -4.9% | |
| PNFP Links: Profile News Message Board | |
| Charts:- Daily , Weekly | |
| Add PNFP to Watchlist: View: Get Complete PNFP Trend Analysis ➞ | |
 | MMI Marcus & Millichap, Inc. |
| Sector: Financials | |
| SubSector: Real Estate Development | |
| MarketCap: 1005.19 Millions | |
| Recent Price: 32.35 Smart Investing & Trading Score: 49 | |
| Day Percent Change: -0.03% Day Change: -0.01 | |
| Week Change: 4.29% Year-to-date Change: -25.9% | |
| MMI Links: Profile News Message Board | |
| Charts:- Daily , Weekly | |
| Add MMI to Watchlist: View: Get Complete MMI Trend Analysis ➞ | |
 | FFWM First Foundation Inc. |
| Sector: Financials | |
| SubSector: Regional - Midwest Banks | |
| MarketCap: 457.17 Millions | |
| Recent Price: 7.05 Smart Investing & Trading Score: 39 | |
| Day Percent Change: 1.59% Day Change: 0.11 | |
| Week Change: 4.29% Year-to-date Change: -27.2% | |
| FFWM Links: Profile News Message Board | |
| Charts:- Daily , Weekly | |
| Add FFWM to Watchlist: View: Get Complete FFWM Trend Analysis ➞ | |
 | LX LexinFintech Holdings Ltd. |
| Sector: Financials | |
| SubSector: Credit Services | |
| MarketCap: 1674.18 Millions | |
| Recent Price: 1.70 Smart Investing & Trading Score: 10 | |
| Day Percent Change: 0.59% Day Change: 0.01 | |
| Week Change: 4.29% Year-to-date Change: -7.6% | |
| LX Links: Profile News Message Board | |
| Charts:- Daily , Weekly | |
| Add LX to Watchlist: View: Get Complete LX Trend Analysis ➞ | |
 | UCBI United Community Banks, Inc. |
| Sector: Financials | |
| SubSector: Regional - Mid-Atlantic Banks | |
| MarketCap: 1593.99 Millions | |
| Recent Price: 26.33 Smart Investing & Trading Score: 69 | |
| Day Percent Change: 0.57% Day Change: 0.15 | |
| Week Change: 4.28% Year-to-date Change: -10.0% | |
| UCBI Links: Profile News Message Board | |
| Charts:- Daily , Weekly | |
| Add UCBI to Watchlist: View: Get Complete UCBI Trend Analysis ➞ | |
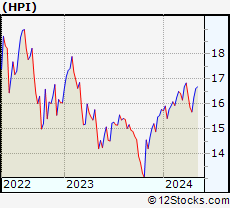 | HPI John Hancock Preferred Income Fund |
| Sector: Financials | |
| SubSector: Closed-End Fund - Debt | |
| MarketCap: 347.007 Millions | |
| Recent Price: 16.34 Smart Investing & Trading Score: 57 | |
| Day Percent Change: 0.43% Day Change: 0.07 | |
| Week Change: 4.21% Year-to-date Change: 3.6% | |
| HPI Links: Profile News Message Board | |
| Charts:- Daily , Weekly | |
| Add HPI to Watchlist: View: Get Complete HPI Trend Analysis ➞ | |
 | COF Capital One Financial Corporation |
| Sector: Financials | |
| SubSector: Credit Services | |
| MarketCap: 23094.2 Millions | |
| Recent Price: 148.87 Smart Investing & Trading Score: 93 | |
| Day Percent Change: 0.66% Day Change: 0.97 | |
| Week Change: 4.17% Year-to-date Change: 13.5% | |
| COF Links: Profile News Message Board | |
| Charts:- Daily , Weekly | |
| Add COF to Watchlist: View: Get Complete COF Trend Analysis ➞ | |
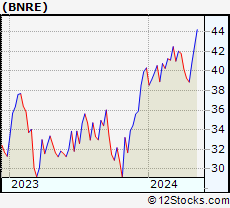 | BNRE Brookfield Reinsurance Ltd. |
| Sector: Financials | |
| SubSector: Insurance - Reinsurance | |
| MarketCap: 468 Millions | |
| Recent Price: 40.48 Smart Investing & Trading Score: 88 | |
| Day Percent Change: 0.20% Day Change: 0.08 | |
| Week Change: 4.17% Year-to-date Change: 0.4% | |
| BNRE Links: Profile News Message Board | |
| Charts:- Daily , Weekly | |
| Add BNRE to Watchlist: View: Get Complete BNRE Trend Analysis ➞ | |
 | ABCB Ameris Bancorp |
| Sector: Financials | |
| SubSector: Regional - Mid-Atlantic Banks | |
| MarketCap: 1537.79 Millions | |
| Recent Price: 48.20 Smart Investing & Trading Score: 74 | |
| Day Percent Change: 0.71% Day Change: 0.34 | |
| Week Change: 4.15% Year-to-date Change: -9.1% | |
| ABCB Links: Profile News Message Board | |
| Charts:- Daily , Weekly | |
| Add ABCB to Watchlist: View: Get Complete ABCB Trend Analysis ➞ | |
 | VRTS Virtus Investment Partners, Inc. |
| Sector: Financials | |
| SubSector: Asset Management | |
| MarketCap: 601.303 Millions | |
| Recent Price: 234.70 Smart Investing & Trading Score: 37 | |
| Day Percent Change: 0.67% Day Change: 1.56 | |
| Week Change: 4.15% Year-to-date Change: -2.9% | |
| VRTS Links: Profile News Message Board | |
| Charts:- Daily , Weekly | |
| Add VRTS to Watchlist: View: Get Complete VRTS Trend Analysis ➞ | |
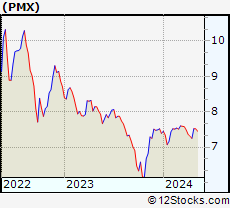 | PMX PIMCO Municipal Income Fund III |
| Sector: Financials | |
| SubSector: Closed-End Fund - Debt | |
| MarketCap: 309.807 Millions | |
| Recent Price: 7.55 Smart Investing & Trading Score: 100 | |
| Day Percent Change: 1.07% Day Change: 0.08 | |
| Week Change: 4.14% Year-to-date Change: 2.2% | |
| PMX Links: Profile News Message Board | |
| Charts:- Daily , Weekly | |
| Add PMX to Watchlist: View: Get Complete PMX Trend Analysis ➞ | |
 | EQH Equitable Holdings, Inc. |
| Sector: Financials | |
| SubSector: Insurance Brokers | |
| MarketCap: 5520.07 Millions | |
| Recent Price: 38.07 Smart Investing & Trading Score: 60 | |
| Day Percent Change: 2.15% Day Change: 0.80 | |
| Week Change: 4.13% Year-to-date Change: 14.3% | |
| EQH Links: Profile News Message Board | |
| Charts:- Daily , Weekly | |
| Add EQH to Watchlist: View: Get Complete EQH Trend Analysis ➞ | |
 | KMPR Kemper Corporation |
| Sector: Financials | |
| SubSector: Property & Casualty Insurance | |
| MarketCap: 4035.12 Millions | |
| Recent Price: 60.40 Smart Investing & Trading Score: 100 | |
| Day Percent Change: 3.32% Day Change: 1.94 | |
| Week Change: 4.12% Year-to-date Change: 24.1% | |
| KMPR Links: Profile News Message Board | |
| Charts:- Daily , Weekly | |
| Add KMPR to Watchlist: View: Get Complete KMPR Trend Analysis ➞ | |
 | FNB F.N.B. Corporation |
| Sector: Financials | |
| SubSector: Regional - Southeast Banks | |
| MarketCap: 2445.55 Millions | |
| Recent Price: 13.67 Smart Investing & Trading Score: 85 | |
| Day Percent Change: 0.29% Day Change: 0.04 | |
| Week Change: 4.11% Year-to-date Change: -0.7% | |
| FNB Links: Profile News Message Board | |
| Charts:- Daily , Weekly | |
| Add FNB to Watchlist: View: Get Complete FNB Trend Analysis ➞ | |
 | GSHD Goosehead Insurance, Inc |
| Sector: Financials | |
| SubSector: Insurance Brokers | |
| MarketCap: 1863.57 Millions | |
| Recent Price: 60.20 Smart Investing & Trading Score: 44 | |
| Day Percent Change: 0.27% Day Change: 0.16 | |
| Week Change: 4.1% Year-to-date Change: -20.6% | |
| GSHD Links: Profile News Message Board | |
| Charts:- Daily , Weekly | |
| Add GSHD to Watchlist: View: Get Complete GSHD Trend Analysis ➞ | |
 | UDR UDR, Inc. |
| Sector: Financials | |
| SubSector: REIT - Residential | |
| MarketCap: 10180.1 Millions | |
| Recent Price: 37.89 Smart Investing & Trading Score: 100 | |
| Day Percent Change: 1.66% Day Change: 0.62 | |
| Week Change: 4.09% Year-to-date Change: -1.0% | |
| UDR Links: Profile News Message Board | |
| Charts:- Daily , Weekly | |
| Add UDR to Watchlist: View: Get Complete UDR Trend Analysis ➞ | |
 | FCF First Commonwealth Financial Corporation |
| Sector: Financials | |
| SubSector: Regional - Northeast Banks | |
| MarketCap: 900.299 Millions | |
| Recent Price: 13.74 Smart Investing & Trading Score: 67 | |
| Day Percent Change: 1.18% Day Change: 0.16 | |
| Week Change: 4.09% Year-to-date Change: -11.0% | |
| FCF Links: Profile News Message Board | |
| Charts:- Daily , Weekly | |
| Add FCF to Watchlist: View: Get Complete FCF Trend Analysis ➞ | |
| For tabular summary view of above stock list: Summary View ➞ 0 - 25 , 25 - 50 , 50 - 75 , 75 - 100 , 100 - 125 , 125 - 150 , 150 - 175 , 175 - 200 , 200 - 225 , 225 - 250 , 250 - 275 , 275 - 300 , 300 - 325 , 325 - 350 , 350 - 375 , 375 - 400 , 400 - 425 , 425 - 450 , 450 - 475 , 475 - 500 , 500 - 525 , 525 - 550 , 550 - 575 , 575 - 600 , 600 - 625 , 625 - 650 , 650 - 675 , 675 - 700 , 700 - 725 , 725 - 750 , 750 - 775 , 775 - 800 , 800 - 825 , 825 - 850 , 850 - 875 , 875 - 900 , 900 - 925 , 925 - 950 , 950 - 975 , 975 - 1000 , 1000 - 1025 , 1025 - 1050 , 1050 - 1075 , 1075 - 1100 , 1100 - 1125 , 1125 - 1150 , 1150 - 1175 , 1175 - 1200 , 1200 - 1225 , 1225 - 1250 | ||
| Click To Change The Sort Order: By Market Cap or Company Size Performance: Year-to-date, Week and Day | |
| Select Chart Type: | ||
|
Best Stocks Today 12Stocks.com |
© 2024 12Stocks.com Terms & Conditions Privacy Contact Us
All Information Provided Only For Education And Not To Be Used For Investing or Trading. See Terms & Conditions


One More Thing ... Get Best Stocks Delivered Daily!
Never Ever Miss A Move With Our Top Ten Stocks Lists
Find Best Stocks In Any Market - Bull or Bear Market
Take A Peek At Our Top Ten Stocks Lists: Daily, Weekly, Year-to-Date & Top Trends
Find Best Stocks In Any Market - Bull or Bear Market
Take A Peek At Our Top Ten Stocks Lists: Daily, Weekly, Year-to-Date & Top Trends
Financial Stocks With Best Up Trends [0-bearish to 100-bullish]: B. Riley[100], Trustmark [100], Synchrony [100], MBIA [100], Kemper [100], Virtu [100], East West[100], Equity Residential[100], Essex Property[100], Cullen/Frost Bankers[100], BOK [100]
Best Financial Stocks Year-to-Date:
Root [473.26%], Hippo [130.79%], Gladstone Capital[98.6%], Banco Macro[70.66%], Grupo Financiero[68.49%], Yiren Digital[62.82%], Banco BBVA[62.68%], Heritage Insurance[61.04%], EverQuote [59.56%], Fidelis Insurance[55.01%], First [52%] Best Financial Stocks This Week:
B. Riley[49.37%], Oportun [39.66%], Cipher Mining[22.14%], Globe Life[17.77%], Root [16%], Sierra Bancorp[11.2%], TOP [10.64%], Provident Bancorp[10.27%], LendingTree [9.82%], Coinbase Global[9.74%], Trustmark [9.73%] Best Financial Stocks Daily:
B. Riley[37.48%], CoStar [8.74%], Offerpad [7.14%], Pegasus Digital[6.93%], Waterstone [6.80%], Trustmark [6.46%], Provident Bancorp[5.92%], EverQuote [5.57%], Trupanion [5.23%], Stock Yards[5.12%], Bank of N.T. Butterfield & Son[5.09%]