
 Login Sign Up


| |||||
 |  | ||||

| 12Stocks.com Market Intelligence |
Best Financial Stocks
| In a hurry? Financial Stocks Lists: Performance Trends Table, Stock Charts
Sort Financial stocks: Daily, Weekly, Year-to-Date, Market Cap & Trends. Filter Financial stocks list by size:All Financial Large Mid-Range Small & MicroCap |
| 12Stocks.com Financial Stocks Performances & Trends Daily | |||||||||
|
|  The overall Smart Investing & Trading Score is 68 (0-bearish to 100-bullish) which puts Financial sector in short term neutral to bullish trend. The Smart Investing & Trading Score from previous trading session is 75 and hence a deterioration of trend.
| ||||||||
Here are the Smart Investing & Trading Scores of the most requested Financial stocks at 12Stocks.com (click stock name for detailed review):
|


| 12Stocks.com: Investing in Financial sector with Stocks | |
|
The following table helps investors and traders sort through current performance and trends (as measured by Smart Investing & Trading Score) of various
stocks in the Financial sector. Quick View: Move mouse or cursor over stock symbol (ticker) to view short-term Technical chart and over stock name to view long term chart. Click on  to add stock symbol to your watchlist and to add stock symbol to your watchlist and  to view watchlist. Click on any ticker or stock name for detailed market intelligence report for that stock. to view watchlist. Click on any ticker or stock name for detailed market intelligence report for that stock. |
12Stocks.com Performance of Stocks in Financial Sector
| Ticker | Stock Name | Watchlist | Category | Recent Price | Smart Investing & Trading Score | Change % | Weekly Change% |
| BHB | Bar Harbor |   | Regional Banks | 25.75 | 60 | 1.86% | 1.06% |
| PFO | Flaherty & Crumrine Preferred ome Opportunity Fund | | Closed-End Fund - Debt | 8.12 | 49 | -0.25% | 1.06% |
| BETZ | Roundhill Sports | | Exchange Traded Fund | 16.74 | 25 | -1.24% | 1.06% |
| PHK | PIMCO High | | Closed-End Fund - Debt | 4.79 | 18 | 0.00% | 1.05% |
| BSAC | Banco Santander-Chile | | Banks | 18.23 | 45 | -0.05% | 1.05% |
| DFEB | FT Cboe | | Exchange Traded Fund | 38.40 | 58 | -0.10% | 1.05% |
| ICE | Intercontinental Exchange | | Investments | 132.57 | 58 | 0.18% | 1.04% |
| NBH | Neuberger Berman | | Asset Mgmt | 10.21 | 44 | 0.44% | 1.04% |
| MSBIP | Midland States | | Banks - Regional | 25.25 | 42 | 0.80% | 1.04% |
| PTA | Cohen & Steers Tax-Advantaged Preferred Securities and ome Fund | | Closed-End Fund - Debt | 18.57 | 49 | -0.38% | 1.03% |
| CRBG | Corebridge | | Asset Mgmt | 27.25 | 68 | -0.27% | 1.02% |
| AIG | American | | Insurance | 74.97 | 63 | 0.05% | 1.00% |
| GLAD | Gladstone Capital | | Closed-End Fund - Debt | 21.25 | 83 | -0.19% | 1.00% |
| TD | Toronto-Dominion Bank | | Banks | 58.67 | 42 | -0.42% | 1.00% |
| ORRF | Orrstown | | Regional Banks | 26.22 | 62 | -0.34% | 1.00% |
| FRA | BlackRock Floating | | Closed-End Fund - Debt | 13.13 | 93 | -0.45% | 1.00% |
| IJAN | Innovator MSCI | | Exchange Traded Fund | 30.83 | 58 | -0.10% | 1.00% |
| MCBC | Macatawa Bank | | Regional Banks | 14.27 | 76 | -0.07% | 0.99% |
| BMAY | Innovator S&P | | Exchange Traded Fund | 35.71 | 78 | -0.01% | 0.99% |
| FTF | Franklin | | Asset Mgmt | 6.19 | 42 | -0.16% | 0.98% |
| VKQ | Invesco Municipal | | Closed-End Fund - Debt | 9.31 | 37 | 0.00% | 0.98% |
| ROIC | Retail Opportunity | | REIT - Retail | 12.40 | 74 | -1.04% | 0.98% |
| BTT | Blackrock Municipal | | Closed-End Fund - Debt | 20.61 | 30 | -0.29% | 0.98% |
| JGH | Nuveen Global | | Asset Mgmt | 12.39 | 52 | -0.80% | 0.98% |
| TEI | Templeton Emerging | | Closed-End Fund - Debt | 5.20 | 58 | -0.38% | 0.97% |
| For chart view version of above stock list: Chart View ➞ 0 - 25 , 25 - 50 , 50 - 75 , 75 - 100 , 100 - 125 , 125 - 150 , 150 - 175 , 175 - 200 , 200 - 225 , 225 - 250 , 250 - 275 , 275 - 300 , 300 - 325 , 325 - 350 , 350 - 375 , 375 - 400 , 400 - 425 , 425 - 450 , 450 - 475 , 475 - 500 , 500 - 525 , 525 - 550 , 550 - 575 , 575 - 600 , 600 - 625 , 625 - 650 , 650 - 675 , 675 - 700 , 700 - 725 , 725 - 750 , 750 - 775 , 775 - 800 , 800 - 825 , 825 - 850 , 850 - 875 , 875 - 900 , 900 - 925 , 925 - 950 , 950 - 975 , 975 - 1000 , 1000 - 1025 , 1025 - 1050 , 1050 - 1075 , 1075 - 1100 , 1100 - 1125 , 1125 - 1150 , 1150 - 1175 , 1175 - 1200 , 1200 - 1225 , 1225 - 1250 | ||
 | Click To Change The Sort Order: By Market Cap or Company Size Performance: Year-to-date, Week and Day |  |
|
Get the most comprehensive stock market coverage daily at 12Stocks.com ➞ Best Stocks Today ➞ Best Stocks Weekly ➞ Best Stocks Year-to-Date ➞ Best Stocks Trends ➞  Best Stocks Today 12Stocks.com Best Nasdaq Stocks ➞ Best S&P 500 Stocks ➞ Best Tech Stocks ➞ Best Biotech Stocks ➞ |
| Detailed Overview of Financial Stocks |
| Financial Technical Overview, Leaders & Laggards, Top Financial ETF Funds & Detailed Financial Stocks List, Charts, Trends & More |
| Financial Sector: Technical Analysis, Trends & YTD Performance | |
| Financial sector is composed of stocks
from banks, brokers, insurance, REITs
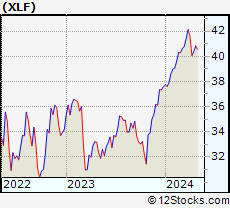
and services subsectors. Financial sector, as represented by XLF, an exchange-traded fund [ETF] that holds basket of Financial stocks (e.g, Bank of America, Goldman Sachs) is up by 9.36% and is currently outperforming the overall market by 3.7% year-to-date. Below is a quick view of Technical charts and trends: |
|
 XLF Weekly Chart |
|
| Long Term Trend: Very Good | |
| Medium Term Trend: Not Good | |
 XLF Daily Chart |
|
| Short Term Trend: Very Good | |
| Overall Trend Score: 68 | |
| YTD Performance: 9.36% | |
| **Trend Scores & Views Are Only For Educational Purposes And Not For Investing | |
| 12Stocks.com: Top Performing Financial Sector Stocks | ||||||||||||||||||||||||||||||||||||||||||||||||
 The top performing Financial sector stocks year to date are
Now, more recently, over last week, the top performing Financial sector stocks on the move are


|
||||||||||||||||||||||||||||||||||||||||||||||||
| 12Stocks.com: Investing in Financial Sector using Exchange Traded Funds | |
|
The following table shows list of key exchange traded funds (ETF) that
help investors track Financial Index. For detailed view, check out our ETF Funds section of our website. Quick View: Move mouse or cursor over ETF symbol (ticker) to view short-term Technical chart and over ETF name to view long term chart. Click on ticker or stock name for detailed view. Click on to add stock symbol to your watchlist and to view watchlist. |
12Stocks.com List of ETFs that track Financial Index
| Ticker | ETF Name | Watchlist | Recent Price | Smart Investing & Trading Score | Change % | Week % | Year-to-date % |
| XLF | Financial | | 41.12 | 68 | -0.02 | 1.83 | 9.36% |
| IAI | Broker-Dealers & Secs | | 112.90 | 75 | -0.18 | 1.68 | 4.03% |
| IYF | Financials | | 92.96 | 68 | -0.20 | 1.82 | 8.84% |
| IYG | Financial Services | | 64.92 | 68 | 0.07 | 2.37 | 8.69% |
| KRE | Regional Banking | | 49.01 | 74 | 0.57 | 3.57 | -6.52% |
| IXG | Global Financials | | 84.19 | 53 | -0.54 | 1.61 | 7.14% |
| VFH | Financials | | 99.72 | 75 | -0.10 | 2.02 | 8.09% |
| KBE | Bank | | 45.96 | 100 | 0.70 | 3.49 | -0.13% |
| FAS | Financial Bull 3X | | 103.20 | 68 | -0.35 | 5.38 | 24.86% |
| FAZ | Financial Bear 3X | | 10.61 | 32 | 0.28 | -5.27 | -22.38% |
| UYG | Financials | | 64.47 | 68 | -0.42 | 3.25 | 16.79% |
| IAT | Regional Banks | | 42.21 | 68 | 0.76 | 3.61 | 0.88% |
| KIE | Insurance | | 49.67 | 58 | -0.16 | 1.2 | 9.84% |
| PSCF | SmallCap Financials | | 46.98 | 58 | 0.07 | 3.33 | -4.46% |
| EUFN | Europe Financials | | 22.42 | 68 | -1.10 | 2.14 | 6.97% |
| PGF | Financial Preferred | | 14.73 | 29 | 0.07 | 1.38 | 1.03% |
| 12Stocks.com: Charts, Trends, Fundamental Data and Performances of Financial Stocks | |
|
We now take in-depth look at all Financial stocks including charts, multi-period performances and overall trends (as measured by Smart Investing & Trading Score). One can sort Financial stocks (click link to choose) by Daily, Weekly and by Year-to-Date performances. Also, one can sort by size of the company or by market capitalization. |
| Select Your Default Chart Type: | |||||
| |||||
| Click on stock symbol or name for detailed view. Click on to add stock symbol to your watchlist and to view watchlist. Quick View: Move mouse or cursor over "Daily" to quickly view daily Technical stock chart and over "Weekly" to view weekly Technical stock chart. | |||||

 | BHB Bar Harbor Bankshares |
| Sector: Financials | |
| SubSector: Regional - Northeast Banks | |
| MarketCap: 298.099 Millions | |
| Recent Price: 25.75 Smart Investing & Trading Score: 60 | |
| Day Percent Change: 1.86% Day Change: 0.47 | |
| Week Change: 1.06% Year-to-date Change: -12.3% | |
| BHB Links: Profile News Message Board | |
| Charts:- Daily , Weekly | |
| Add BHB to Watchlist: View: Get Complete BHB Trend Analysis ➞ | |
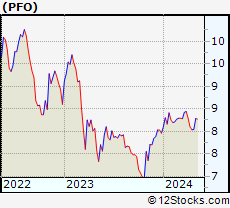 | PFO Flaherty & Crumrine Preferred Income Opportunity Fund Inc. |
| Sector: Financials | |
| SubSector: Closed-End Fund - Debt | |
| MarketCap: 106.107 Millions | |
| Recent Price: 8.12 Smart Investing & Trading Score: 49 | |
| Day Percent Change: -0.25% Day Change: -0.02 | |
| Week Change: 1.06% Year-to-date Change: 2.0% | |
| PFO Links: Profile News Message Board | |
| Charts:- Daily , Weekly | |
| Add PFO to Watchlist: View: Get Complete PFO Trend Analysis ➞ | |
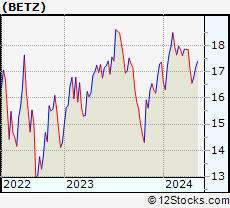 | BETZ Roundhill Sports Betting & iGaming ETF |
| Sector: Financials | |
| SubSector: Exchange Traded Fund | |
| MarketCap: 60157 Millions | |
| Recent Price: 16.74 Smart Investing & Trading Score: 25 | |
| Day Percent Change: -1.24% Day Change: -0.21 | |
| Week Change: 1.06% Year-to-date Change: -3.6% | |
| BETZ Links: Profile News Message Board | |
| Charts:- Daily , Weekly | |
| Add BETZ to Watchlist: View: Get Complete BETZ Trend Analysis ➞ | |
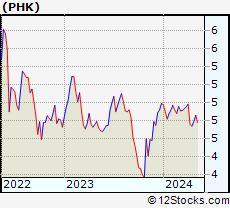 | PHK PIMCO High Income Fund |
| Sector: Financials | |
| SubSector: Closed-End Fund - Debt | |
| MarketCap: 571.207 Millions | |
| Recent Price: 4.79 Smart Investing & Trading Score: 18 | |
| Day Percent Change: 0.00% Day Change: 0.00 | |
| Week Change: 1.05% Year-to-date Change: -4.0% | |
| PHK Links: Profile News Message Board | |
| Charts:- Daily , Weekly | |
| Add PHK to Watchlist: View: Get Complete PHK Trend Analysis ➞ | |
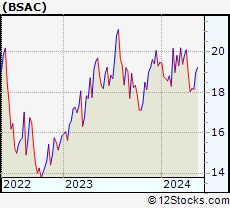 | BSAC Banco Santander-Chile |
| Sector: Financials | |
| SubSector: Money Center Banks | |
| MarketCap: 6987.59 Millions | |
| Recent Price: 18.23 Smart Investing & Trading Score: 45 | |
| Day Percent Change: -0.05% Day Change: -0.01 | |
| Week Change: 1.05% Year-to-date Change: -6.5% | |
| BSAC Links: Profile News Message Board | |
| Charts:- Daily , Weekly | |
| Add BSAC to Watchlist: View: Get Complete BSAC Trend Analysis ➞ | |
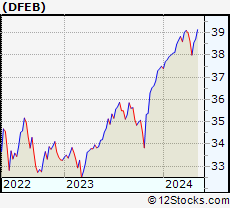 | DFEB FT Cboe Vest US Eq Deep Buffer ETF February |
| Sector: Financials | |
| SubSector: Exchange Traded Fund | |
| MarketCap: 60157 Millions | |
| Recent Price: 38.40 Smart Investing & Trading Score: 58 | |
| Day Percent Change: -0.10% Day Change: -0.04 | |
| Week Change: 1.05% Year-to-date Change: 2.4% | |
| DFEB Links: Profile News Message Board | |
| Charts:- Daily , Weekly | |
| Add DFEB to Watchlist: View: Get Complete DFEB Trend Analysis ➞ | |
 | ICE Intercontinental Exchange, Inc. |
| Sector: Financials | |
| SubSector: Diversified Investments | |
| MarketCap: 46054.6 Millions | |
| Recent Price: 132.57 Smart Investing & Trading Score: 58 | |
| Day Percent Change: 0.18% Day Change: 0.24 | |
| Week Change: 1.04% Year-to-date Change: 3.2% | |
| ICE Links: Profile News Message Board | |
| Charts:- Daily , Weekly | |
| Add ICE to Watchlist: View: Get Complete ICE Trend Analysis ➞ | |
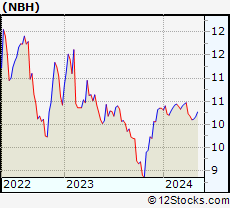 | NBH Neuberger Berman Intermediate Municipal Fund Inc. |
| Sector: Financials | |
| SubSector: Asset Management | |
| MarketCap: 228.603 Millions | |
| Recent Price: 10.21 Smart Investing & Trading Score: 44 | |
| Day Percent Change: 0.44% Day Change: 0.04 | |
| Week Change: 1.04% Year-to-date Change: -1.4% | |
| NBH Links: Profile News Message Board | |
| Charts:- Daily , Weekly | |
| Add NBH to Watchlist: View: Get Complete NBH Trend Analysis ➞ | |
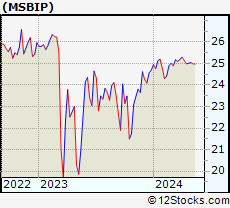 | MSBIP Midland States Bancorp, Inc. |
| Sector: Financials | |
| SubSector: Banks - Regional | |
| MarketCap: 439 Millions | |
| Recent Price: 25.25 Smart Investing & Trading Score: 42 | |
| Day Percent Change: 0.80% Day Change: 0.20 | |
| Week Change: 1.04% Year-to-date Change: 2.2% | |
| MSBIP Links: Profile News Message Board | |
| Charts:- Daily , Weekly | |
| Add MSBIP to Watchlist: View: Get Complete MSBIP Trend Analysis ➞ | |
 | PTA Cohen & Steers Tax-Advantaged Preferred Securities and Income Fund |
| Sector: Financials | |
| SubSector: Closed-End Fund - Debt | |
| MarketCap: 963 Millions | |
| Recent Price: 18.57 Smart Investing & Trading Score: 49 | |
| Day Percent Change: -0.38% Day Change: -0.07 | |
| Week Change: 1.03% Year-to-date Change: 2.7% | |
| PTA Links: Profile News Message Board | |
| Charts:- Daily , Weekly | |
| Add PTA to Watchlist: View: Get Complete PTA Trend Analysis ➞ | |
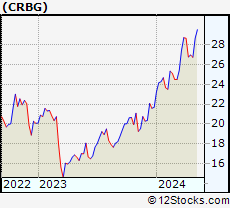 | CRBG Corebridge Financial, Inc. |
| Sector: Financials | |
| SubSector: Asset Management | |
| MarketCap: 11170 Millions | |
| Recent Price: 27.25 Smart Investing & Trading Score: 68 | |
| Day Percent Change: -0.27% Day Change: -0.07 | |
| Week Change: 1.02% Year-to-date Change: 25.7% | |
| CRBG Links: Profile News Message Board | |
| Charts:- Daily , Weekly | |
| Add CRBG to Watchlist: View: Get Complete CRBG Trend Analysis ➞ | |
 | AIG American International Group, Inc. |
| Sector: Financials | |
| SubSector: Property & Casualty Insurance | |
| MarketCap: 21219 Millions | |
| Recent Price: 74.97 Smart Investing & Trading Score: 63 | |
| Day Percent Change: 0.05% Day Change: 0.04 | |
| Week Change: 1% Year-to-date Change: 10.7% | |
| AIG Links: Profile News Message Board | |
| Charts:- Daily , Weekly | |
| Add AIG to Watchlist: View: Get Complete AIG Trend Analysis ➞ | |
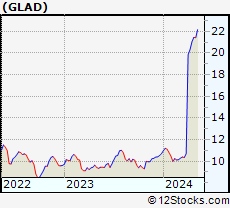 | GLAD Gladstone Capital Corporation |
| Sector: Financials | |
| SubSector: Closed-End Fund - Debt | |
| MarketCap: 174.807 Millions | |
| Recent Price: 21.25 Smart Investing & Trading Score: 83 | |
| Day Percent Change: -0.19% Day Change: -0.04 | |
| Week Change: 1% Year-to-date Change: 98.6% | |
| GLAD Links: Profile News Message Board | |
| Charts:- Daily , Weekly | |
| Add GLAD to Watchlist: View: Get Complete GLAD Trend Analysis ➞ | |
 | TD The Toronto-Dominion Bank |
| Sector: Financials | |
| SubSector: Money Center Banks | |
| MarketCap: 75152.4 Millions | |
| Recent Price: 58.67 Smart Investing & Trading Score: 42 | |
| Day Percent Change: -0.42% Day Change: -0.25 | |
| Week Change: 1% Year-to-date Change: -9.2% | |
| TD Links: Profile News Message Board | |
| Charts:- Daily , Weekly | |
| Add TD to Watchlist: View: Get Complete TD Trend Analysis ➞ | |
 | ORRF Orrstown Financial Services, Inc. |
| Sector: Financials | |
| SubSector: Regional - Northeast Banks | |
| MarketCap: 159.999 Millions | |
| Recent Price: 26.22 Smart Investing & Trading Score: 62 | |
| Day Percent Change: -0.34% Day Change: -0.09 | |
| Week Change: 1% Year-to-date Change: -11.1% | |
| ORRF Links: Profile News Message Board | |
| Charts:- Daily , Weekly | |
| Add ORRF to Watchlist: View: Get Complete ORRF Trend Analysis ➞ | |
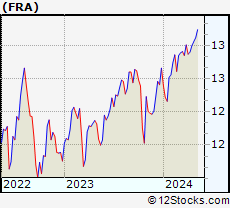 | FRA BlackRock Floating Rate Income Strategies Fund, Inc. |
| Sector: Financials | |
| SubSector: Closed-End Fund - Debt | |
| MarketCap: 312.007 Millions | |
| Recent Price: 13.13 Smart Investing & Trading Score: 93 | |
| Day Percent Change: -0.45% Day Change: -0.06 | |
| Week Change: 1% Year-to-date Change: 3.7% | |
| FRA Links: Profile News Message Board | |
| Charts:- Daily , Weekly | |
| Add FRA to Watchlist: View: Get Complete FRA Trend Analysis ➞ | |
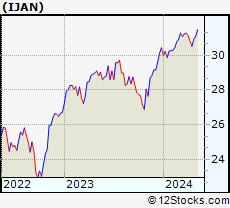 | IJAN Innovator MSCI EAFE Power Buffer ETF January |
| Sector: Financials | |
| SubSector: Exchange Traded Fund | |
| MarketCap: 60157 Millions | |
| Recent Price: 30.83 Smart Investing & Trading Score: 58 | |
| Day Percent Change: -0.10% Day Change: -0.03 | |
| Week Change: 1% Year-to-date Change: 1.3% | |
| IJAN Links: Profile News Message Board | |
| Charts:- Daily , Weekly | |
| Add IJAN to Watchlist: View: Get Complete IJAN Trend Analysis ➞ | |
 | MCBC Macatawa Bank Corporation |
| Sector: Financials | |
| SubSector: Regional - Midwest Banks | |
| MarketCap: 264.37 Millions | |
| Recent Price: 14.27 Smart Investing & Trading Score: 76 | |
| Day Percent Change: -0.07% Day Change: -0.01 | |
| Week Change: 0.99% Year-to-date Change: 26.5% | |
| MCBC Links: Profile News Message Board | |
| Charts:- Daily , Weekly | |
| Add MCBC to Watchlist: View: Get Complete MCBC Trend Analysis ➞ | |
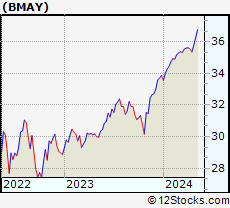 | BMAY Innovator S&P 500 Buffer ETF May |
| Sector: Financials | |
| SubSector: Exchange Traded Fund | |
| MarketCap: 60157 Millions | |
| Recent Price: 35.71 Smart Investing & Trading Score: 78 | |
| Day Percent Change: -0.01% Day Change: 0.00 | |
| Week Change: 0.99% Year-to-date Change: 5.4% | |
| BMAY Links: Profile News Message Board | |
| Charts:- Daily , Weekly | |
| Add BMAY to Watchlist: View: Get Complete BMAY Trend Analysis ➞ | |
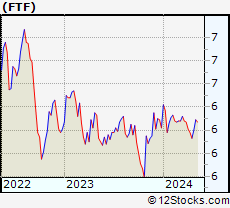 | FTF Franklin Limited Duration Income Trust |
| Sector: Financials | |
| SubSector: Asset Management | |
| MarketCap: 210.603 Millions | |
| Recent Price: 6.19 Smart Investing & Trading Score: 42 | |
| Day Percent Change: -0.16% Day Change: -0.01 | |
| Week Change: 0.98% Year-to-date Change: -0.5% | |
| FTF Links: Profile News Message Board | |
| Charts:- Daily , Weekly | |
| Add FTF to Watchlist: View: Get Complete FTF Trend Analysis ➞ | |
 | VKQ Invesco Municipal Trust |
| Sector: Financials | |
| SubSector: Closed-End Fund - Debt | |
| MarketCap: 577.507 Millions | |
| Recent Price: 9.31 Smart Investing & Trading Score: 37 | |
| Day Percent Change: 0.00% Day Change: 0.00 | |
| Week Change: 0.98% Year-to-date Change: -2.3% | |
| VKQ Links: Profile News Message Board | |
| Charts:- Daily , Weekly | |
| Add VKQ to Watchlist: View: Get Complete VKQ Trend Analysis ➞ | |
 | ROIC Retail Opportunity Investments Corp. |
| Sector: Financials | |
| SubSector: REIT - Retail | |
| MarketCap: 943.414 Millions | |
| Recent Price: 12.40 Smart Investing & Trading Score: 74 | |
| Day Percent Change: -1.04% Day Change: -0.13 | |
| Week Change: 0.98% Year-to-date Change: -11.6% | |
| ROIC Links: Profile News Message Board | |
| Charts:- Daily , Weekly | |
| Add ROIC to Watchlist: View: Get Complete ROIC Trend Analysis ➞ | |
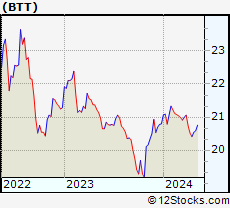 | BTT Blackrock Municipal 2030 Target Term Trust |
| Sector: Financials | |
| SubSector: Closed-End Fund - Debt | |
| MarketCap: 1438.37 Millions | |
| Recent Price: 20.61 Smart Investing & Trading Score: 30 | |
| Day Percent Change: -0.29% Day Change: -0.06 | |
| Week Change: 0.98% Year-to-date Change: -0.9% | |
| BTT Links: Profile News Message Board | |
| Charts:- Daily , Weekly | |
| Add BTT to Watchlist: View: Get Complete BTT Trend Analysis ➞ | |
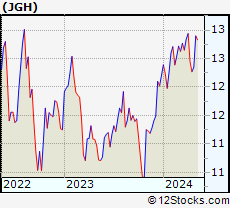 | JGH Nuveen Global High Income Fund |
| Sector: Financials | |
| SubSector: Asset Management | |
| MarketCap: 244.503 Millions | |
| Recent Price: 12.39 Smart Investing & Trading Score: 52 | |
| Day Percent Change: -0.80% Day Change: -0.10 | |
| Week Change: 0.98% Year-to-date Change: 1.6% | |
| JGH Links: Profile News Message Board | |
| Charts:- Daily , Weekly | |
| Add JGH to Watchlist: View: Get Complete JGH Trend Analysis ➞ | |
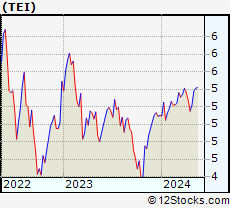 | TEI Templeton Emerging Markets Income Fund |
| Sector: Financials | |
| SubSector: Closed-End Fund - Debt | |
| MarketCap: 337.907 Millions | |
| Recent Price: 5.20 Smart Investing & Trading Score: 58 | |
| Day Percent Change: -0.38% Day Change: -0.02 | |
| Week Change: 0.97% Year-to-date Change: 2.0% | |
| TEI Links: Profile News Message Board | |
| Charts:- Daily , Weekly | |
| Add TEI to Watchlist: View: Get Complete TEI Trend Analysis ➞ | |
| For tabular summary view of above stock list: Summary View ➞ 0 - 25 , 25 - 50 , 50 - 75 , 75 - 100 , 100 - 125 , 125 - 150 , 150 - 175 , 175 - 200 , 200 - 225 , 225 - 250 , 250 - 275 , 275 - 300 , 300 - 325 , 325 - 350 , 350 - 375 , 375 - 400 , 400 - 425 , 425 - 450 , 450 - 475 , 475 - 500 , 500 - 525 , 525 - 550 , 550 - 575 , 575 - 600 , 600 - 625 , 625 - 650 , 650 - 675 , 675 - 700 , 700 - 725 , 725 - 750 , 750 - 775 , 775 - 800 , 800 - 825 , 825 - 850 , 850 - 875 , 875 - 900 , 900 - 925 , 925 - 950 , 950 - 975 , 975 - 1000 , 1000 - 1025 , 1025 - 1050 , 1050 - 1075 , 1075 - 1100 , 1100 - 1125 , 1125 - 1150 , 1150 - 1175 , 1175 - 1200 , 1200 - 1225 , 1225 - 1250 | ||
| Click To Change The Sort Order: By Market Cap or Company Size Performance: Year-to-date, Week and Day | |
| Select Chart Type: | ||
|
Best Stocks Today 12Stocks.com |
© 2024 12Stocks.com Terms & Conditions Privacy Contact Us
All Information Provided Only For Education And Not To Be Used For Investing or Trading. See Terms & Conditions


One More Thing ... Get Best Stocks Delivered Daily!
Never Ever Miss A Move With Our Top Ten Stocks Lists
Find Best Stocks In Any Market - Bull or Bear Market
Take A Peek At Our Top Ten Stocks Lists: Daily, Weekly, Year-to-Date & Top Trends
Find Best Stocks In Any Market - Bull or Bear Market
Take A Peek At Our Top Ten Stocks Lists: Daily, Weekly, Year-to-Date & Top Trends
Financial Stocks With Best Up Trends [0-bearish to 100-bullish]: B. Riley[100], Trustmark [100], Synchrony [100], MBIA [100], Kemper [100], Virtu [100], East West[100], Equity Residential[100], Essex Property[100], Cullen/Frost Bankers[100], BOK [100]
Best Financial Stocks Year-to-Date:
Root [473.26%], Hippo [130.79%], Gladstone Capital[98.6%], Banco Macro[70.66%], Grupo Financiero[68.49%], Yiren Digital[62.82%], Banco BBVA[62.68%], Heritage Insurance[61.04%], EverQuote [59.56%], Fidelis Insurance[55.01%], First [52%] Best Financial Stocks This Week:
B. Riley[49.37%], Oportun [39.66%], Cipher Mining[22.14%], Globe Life[17.77%], Root [16%], Sierra Bancorp[11.2%], TOP [10.64%], Provident Bancorp[10.27%], LendingTree [9.82%], Coinbase Global[9.74%], Trustmark [9.73%] Best Financial Stocks Daily:
B. Riley[37.48%], CoStar [8.74%], Offerpad [7.14%], Pegasus Digital[6.93%], Waterstone [6.80%], Trustmark [6.46%], Provident Bancorp[5.92%], EverQuote [5.57%], Trupanion [5.23%], Stock Yards[5.12%], Bank of N.T. Butterfield & Son[5.09%]