
 Login Sign Up


| |||||
 |  | ||||

| 12Stocks.com Market Intelligence |
Best Financial Stocks
| In a hurry? Financial Stocks Lists: Performance Trends Table, Stock Charts
Sort Financial stocks: Daily, Weekly, Year-to-Date, Market Cap & Trends. Filter Financial stocks list by size:All Financial Large Mid-Range Small & MicroCap |
| 12Stocks.com Financial Stocks Performances & Trends Daily | |||||||||
|
|  The overall Smart Investing & Trading Score is 56 (0-bearish to 100-bullish) which puts Financial sector in short term neutral trend. The Smart Investing & Trading Score from previous trading session is 36 and hence an improvement of trend.
| ||||||||
Here are the Smart Investing & Trading Scores of the most requested Financial stocks at 12Stocks.com (click stock name for detailed review):
|


| 12Stocks.com: Investing in Financial sector with Stocks | |
|
The following table helps investors and traders sort through current performance and trends (as measured by Smart Investing & Trading Score) of various
stocks in the Financial sector. Quick View: Move mouse or cursor over stock symbol (ticker) to view short-term Technical chart and over stock name to view long term chart. Click on  to add stock symbol to your watchlist and to add stock symbol to your watchlist and  to view watchlist. Click on any ticker or stock name for detailed market intelligence report for that stock. to view watchlist. Click on any ticker or stock name for detailed market intelligence report for that stock. |
12Stocks.com Performance of Stocks in Financial Sector
| Ticker | Stock Name | Watchlist | Category | Recent Price | Smart Investing & Trading Score | Change % | Weekly Change% |
| IX | ORIX |   | Credit Services | 101.75 | 43 | -0.20% | -3.73% |
| EGBN | Eagle Bancorp | | Regional Banks | 20.52 | 27 | 0.44% | -3.80% |
| TPL | Texas Pacific | | Real Estatet | 582.40 | 47 | -0.44% | -3.85% |
| ARR | ARMOUR Residential | | Mortgage | 17.71 | 25 | 1.14% | -3.85% |
| PYPL | PayPal | | Credit Services | 62.10 | 36 | -1.83% | -3.86% |
| CNNE | Cannae | | Asset Mgmt | 19.55 | 10 | 0.62% | -3.88% |
| HELX | Franklin Genomic | | Exchange Traded Fund | 29.90 | 13 | -1.30% | -3.89% |
| GEO | GEO | | REIT | 14.77 | 59 | -1.47% | -3.90% |
| NMR | Nomura | | Brokerage | 5.87 | 48 | 0.17% | -3.93% |
| BSBR | Banco Santander | | Foreign Banks | 5.12 | 17 | -0.19% | -3.94% |
| upst | Upstart | | Credit Services | 22.88 | 42 | 2.05% | -3.95% |
| JHG | Janus Henderson | | Asset Mgmt | 30.47 | 41 | -0.88% | -3.97% |
| MCB | Metropolitan Bank | | Regional Banks | 33.10 | 20 | 1.35% | -3.97% |
| CHW | Calamos Global | | Closed-End Fund - Equity | 6.28 | 46 | -0.71% | -3.98% |
| WUGI | Esoterica NextG | | Exchange Traded Fund | 58.70 | 26 | -0.66% | -3.99% |
| STHO | Star | | Financials Services | 11.68 | 61 | 0.04% | -3.99% |
| AGO | Assured Guaranty | | Insurance | 76.26 | 10 | -1.09% | -4.00% |
| BST | BlackRock Science | | Closed-End Fund - Equity | 33.96 | 10 | -0.85% | -4.01% |
| HBCP | Home Bancorp | | S&L | 33.30 | 10 | -1.19% | -4.03% |
| PCN | PIMCO Corporate | | Closed-End Fund - Debt | 12.83 | 10 | 0.00% | -4.04% |
| KKR | KKR | | Asset Mgmt | 93.35 | 44 | -1.35% | -4.05% |
| DLR | Digital Realty | | REIT - Office | 136.66 | 17 | 0.67% | -4.09% |
| RCS | PIMCO Strategic | | Closed-End Fund - Debt | 5.63 | 10 | -2.60% | -4.09% |
| MFA | MFA | | Mortgage | 10.28 | 10 | 0.29% | -4.10% |
| CLM | Cornerstone Strategic | | Asset Mgmt | 7.23 | 61 | 0.70% | -4.11% |
| For chart view version of above stock list: Chart View ➞ 0 - 25 , 25 - 50 , 50 - 75 , 75 - 100 , 100 - 125 , 125 - 150 , 150 - 175 , 175 - 200 , 200 - 225 , 225 - 250 , 250 - 275 , 275 - 300 , 300 - 325 , 325 - 350 , 350 - 375 , 375 - 400 , 400 - 425 , 425 - 450 , 450 - 475 , 475 - 500 , 500 - 525 , 525 - 550 , 550 - 575 , 575 - 600 , 600 - 625 , 625 - 650 , 650 - 675 , 675 - 700 , 700 - 725 , 725 - 750 , 750 - 775 , 775 - 800 , 800 - 825 , 825 - 850 , 850 - 875 , 875 - 900 , 900 - 925 , 925 - 950 , 950 - 975 , 975 - 1000 , 1000 - 1025 , 1025 - 1050 , 1050 - 1075 , 1075 - 1100 , 1100 - 1125 , 1125 - 1150 , 1150 - 1175 , 1175 - 1200 , 1200 - 1225 , 1225 - 1250 | ||
 | Click To Change The Sort Order: By Market Cap or Company Size Performance: Year-to-date, Week and Day |  |
|
Get the most comprehensive stock market coverage daily at 12Stocks.com ➞ Best Stocks Today ➞ Best Stocks Weekly ➞ Best Stocks Year-to-Date ➞ Best Stocks Trends ➞  Best Stocks Today 12Stocks.com Best Nasdaq Stocks ➞ Best S&P 500 Stocks ➞ Best Tech Stocks ➞ Best Biotech Stocks ➞ |
| Detailed Overview of Financial Stocks |
| Financial Technical Overview, Leaders & Laggards, Top Financial ETF Funds & Detailed Financial Stocks List, Charts, Trends & More |
| Financial Sector: Technical Analysis, Trends & YTD Performance | |
| Financial sector is composed of stocks
from banks, brokers, insurance, REITs
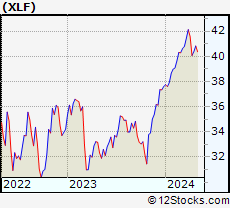
and services subsectors. Financial sector, as represented by XLF, an exchange-traded fund [ETF] that holds basket of Financial stocks (e.g, Bank of America, Goldman Sachs) is up by 5.93% and is currently outperforming the overall market by 1.74% year-to-date. Below is a quick view of Technical charts and trends: |
|
 XLF Weekly Chart |
|
| Long Term Trend: Good | |
| Medium Term Trend: Not Good | |
 XLF Daily Chart |
|
| Short Term Trend: Deteriorating | |
| Overall Trend Score: 56 | |
| YTD Performance: 5.93% | |
| **Trend Scores & Views Are Only For Educational Purposes And Not For Investing | |
| 12Stocks.com: Top Performing Financial Sector Stocks | ||||||||||||||||||||||||||||||||||||||||||||||||
 The top performing Financial sector stocks year to date are
Now, more recently, over last week, the top performing Financial sector stocks on the move are


|
||||||||||||||||||||||||||||||||||||||||||||||||
| 12Stocks.com: Investing in Financial Sector using Exchange Traded Funds | |
|
The following table shows list of key exchange traded funds (ETF) that
help investors track Financial Index. For detailed view, check out our ETF Funds section of our website. Quick View: Move mouse or cursor over ETF symbol (ticker) to view short-term Technical chart and over ETF name to view long term chart. Click on ticker or stock name for detailed view. Click on to add stock symbol to your watchlist and to view watchlist. |
12Stocks.com List of ETFs that track Financial Index
| Ticker | ETF Name | Watchlist | Recent Price | Smart Investing & Trading Score | Change % | Week % | Year-to-date % |
| XLF | Financial | | 39.83 | 56 | 0.35 | -0.57 | 5.93% |
| IAI | Broker-Dealers & Secs | | 110.39 | 56 | 0.04 | -0.4 | 1.71% |
| IYF | Financials | | 90.04 | 48 | 0.61 | -0.56 | 5.42% |
| IYG | Financial Services | | 62.67 | 56 | 0.30 | -0.85 | 4.91% |
| KRE | Regional Banking | | 46.11 | 28 | 0.61 | -0.88 | -12.05% |
| IXG | Global Financials | | 82.50 | 43 | 0.66 | -0.19 | 4.99% |
| VFH | Financials | | 96.40 | 56 | 0.39 | -0.8 | 4.49% |
| KBE | Bank | | 43.40 | 22 | 0.70 | -0.89 | -5.69% |
| FAS | Financial Bull 3X | | 94.14 | 56 | 1.00 | -2.16 | 13.9% |
| FAZ | Financial Bear 3X | | 11.66 | 40 | -0.85 | 2.19 | -14.7% |
| UYG | Financials | | 60.75 | 51 | 0.70 | -1.17 | 10.05% |
| IAT | Regional Banks | | 39.74 | 27 | 0.28 | -1.73 | -5.02% |
| KIE | Insurance | | 48.28 | 51 | 1.17 | -0.08 | 6.77% |
| PSCF | SmallCap Financials | | 44.94 | 22 | 0.18 | -1.03 | -8.62% |
| EUFN | Europe Financials | | 21.86 | 56 | 0.21 | -0.16 | 4.27% |
| PGF | Financial Preferred | | 14.44 | 18 | -0.38 | -1.67 | -0.99% |
| 12Stocks.com: Charts, Trends, Fundamental Data and Performances of Financial Stocks | |
|
We now take in-depth look at all Financial stocks including charts, multi-period performances and overall trends (as measured by Smart Investing & Trading Score). One can sort Financial stocks (click link to choose) by Daily, Weekly and by Year-to-Date performances. Also, one can sort by size of the company or by market capitalization. |
| Select Your Default Chart Type: | |||||
| |||||
| Click on stock symbol or name for detailed view. Click on to add stock symbol to your watchlist and to view watchlist. Quick View: Move mouse or cursor over "Daily" to quickly view daily Technical stock chart and over "Weekly" to view weekly Technical stock chart. | |||||

 | IX ORIX Corporation |
| Sector: Financials | |
| SubSector: Credit Services | |
| MarketCap: 15483.4 Millions | |
| Recent Price: 101.75 Smart Investing & Trading Score: 43 | |
| Day Percent Change: -0.20% Day Change: -0.20 | |
| Week Change: -3.73% Year-to-date Change: 9.0% | |
| IX Links: Profile News Message Board | |
| Charts:- Daily , Weekly | |
| Add IX to Watchlist: View: Get Complete IX Trend Analysis ➞ | |
 | EGBN Eagle Bancorp, Inc. |
| Sector: Financials | |
| SubSector: Regional - Mid-Atlantic Banks | |
| MarketCap: 906.559 Millions | |
| Recent Price: 20.52 Smart Investing & Trading Score: 27 | |
| Day Percent Change: 0.44% Day Change: 0.09 | |
| Week Change: -3.8% Year-to-date Change: -31.9% | |
| EGBN Links: Profile News Message Board | |
| Charts:- Daily , Weekly | |
| Add EGBN to Watchlist: View: Get Complete EGBN Trend Analysis ➞ | |
 | TPL Texas Pacific Land Trust |
| Sector: Financials | |
| SubSector: Real Estate Development | |
| MarketCap: 3052.29 Millions | |
| Recent Price: 582.40 Smart Investing & Trading Score: 47 | |
| Day Percent Change: -0.44% Day Change: -2.56 | |
| Week Change: -3.85% Year-to-date Change: -63.0% | |
| TPL Links: Profile News Message Board | |
| Charts:- Daily , Weekly | |
| Add TPL to Watchlist: View: Get Complete TPL Trend Analysis ➞ | |
 | ARR ARMOUR Residential REIT, Inc. |
| Sector: Financials | |
| SubSector: Mortgage Investment | |
| MarketCap: 578.739 Millions | |
| Recent Price: 17.71 Smart Investing & Trading Score: 25 | |
| Day Percent Change: 1.14% Day Change: 0.20 | |
| Week Change: -3.85% Year-to-date Change: -8.3% | |
| ARR Links: Profile News Message Board | |
| Charts:- Daily , Weekly | |
| Add ARR to Watchlist: View: Get Complete ARR Trend Analysis ➞ | |
 | PYPL PayPal Holdings, Inc. |
| Sector: Financials | |
| SubSector: Credit Services | |
| MarketCap: 108949 Millions | |
| Recent Price: 62.10 Smart Investing & Trading Score: 36 | |
| Day Percent Change: -1.83% Day Change: -1.16 | |
| Week Change: -3.86% Year-to-date Change: 1.1% | |
| PYPL Links: Profile News Message Board | |
| Charts:- Daily , Weekly | |
| Add PYPL to Watchlist: View: Get Complete PYPL Trend Analysis ➞ | |
 | CNNE Cannae Holdings, Inc. |
| Sector: Financials | |
| SubSector: Asset Management | |
| MarketCap: 2625.53 Millions | |
| Recent Price: 19.55 Smart Investing & Trading Score: 10 | |
| Day Percent Change: 0.62% Day Change: 0.12 | |
| Week Change: -3.88% Year-to-date Change: 0.2% | |
| CNNE Links: Profile News Message Board | |
| Charts:- Daily , Weekly | |
| Add CNNE to Watchlist: View: Get Complete CNNE Trend Analysis ➞ | |
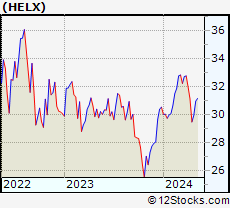 | HELX Franklin Genomic Advancements ETF |
| Sector: Financials | |
| SubSector: Exchange Traded Fund | |
| MarketCap: 60157 Millions | |
| Recent Price: 29.90 Smart Investing & Trading Score: 13 | |
| Day Percent Change: -1.30% Day Change: -0.40 | |
| Week Change: -3.89% Year-to-date Change: -2.1% | |
| HELX Links: Profile News Message Board | |
| Charts:- Daily , Weekly | |
| Add HELX to Watchlist: View: Get Complete HELX Trend Analysis ➞ | |
 | GEO The GEO Group, Inc. |
| Sector: Financials | |
| SubSector: REIT - Healthcare Facilities | |
| MarketCap: 1678.34 Millions | |
| Recent Price: 14.77 Smart Investing & Trading Score: 59 | |
| Day Percent Change: -1.47% Day Change: -0.22 | |
| Week Change: -3.9% Year-to-date Change: 36.4% | |
| GEO Links: Profile News Message Board | |
| Charts:- Daily , Weekly | |
| Add GEO to Watchlist: View: Get Complete GEO Trend Analysis ➞ | |
 | NMR Nomura Holdings, Inc. |
| Sector: Financials | |
| SubSector: Investment Brokerage - National | |
| MarketCap: 15277 Millions | |
| Recent Price: 5.87 Smart Investing & Trading Score: 48 | |
| Day Percent Change: 0.17% Day Change: 0.01 | |
| Week Change: -3.93% Year-to-date Change: 30.2% | |
| NMR Links: Profile News Message Board | |
| Charts:- Daily , Weekly | |
| Add NMR to Watchlist: View: Get Complete NMR Trend Analysis ➞ | |
 | BSBR Banco Santander (Brasil) S.A. |
| Sector: Financials | |
| SubSector: Foreign Regional Banks | |
| MarketCap: 21961.4 Millions | |
| Recent Price: 5.12 Smart Investing & Trading Score: 17 | |
| Day Percent Change: -0.19% Day Change: -0.01 | |
| Week Change: -3.94% Year-to-date Change: -21.8% | |
| BSBR Links: Profile News Message Board | |
| Charts:- Daily , Weekly | |
| Add BSBR to Watchlist: View: Get Complete BSBR Trend Analysis ➞ | |
 | upst Upstart Holdings, Inc. |
| Sector: Financials | |
| SubSector: Credit Services | |
| MarketCap: 2900 Millions | |
| Recent Price: 22.88 Smart Investing & Trading Score: 42 | |
| Day Percent Change: 2.05% Day Change: 0.46 | |
| Week Change: -3.95% Year-to-date Change: -43.5% | |
| upst Links: Profile News Message Board | |
| Charts:- Daily , Weekly | |
| Add upst to Watchlist: View: Get Complete upst Trend Analysis ➞ | |
 | JHG Janus Henderson Group plc |
| Sector: Financials | |
| SubSector: Asset Management | |
| MarketCap: 2992.33 Millions | |
| Recent Price: 30.47 Smart Investing & Trading Score: 41 | |
| Day Percent Change: -0.88% Day Change: -0.27 | |
| Week Change: -3.97% Year-to-date Change: 1.1% | |
| JHG Links: Profile News Message Board | |
| Charts:- Daily , Weekly | |
| Add JHG to Watchlist: View: Get Complete JHG Trend Analysis ➞ | |
 | MCB Metropolitan Bank Holding Corp. |
| Sector: Financials | |
| SubSector: Regional - Northeast Banks | |
| MarketCap: 212.999 Millions | |
| Recent Price: 33.10 Smart Investing & Trading Score: 20 | |
| Day Percent Change: 1.35% Day Change: 0.44 | |
| Week Change: -3.97% Year-to-date Change: -40.2% | |
| MCB Links: Profile News Message Board | |
| Charts:- Daily , Weekly | |
| Add MCB to Watchlist: View: Get Complete MCB Trend Analysis ➞ | |
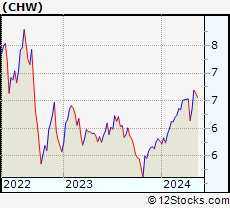 | CHW Calamos Global Dynamic Income Fund |
| Sector: Financials | |
| SubSector: Closed-End Fund - Equity | |
| MarketCap: 272.047 Millions | |
| Recent Price: 6.28 Smart Investing & Trading Score: 46 | |
| Day Percent Change: -0.71% Day Change: -0.04 | |
| Week Change: -3.98% Year-to-date Change: 8.8% | |
| CHW Links: Profile News Message Board | |
| Charts:- Daily , Weekly | |
| Add CHW to Watchlist: View: Get Complete CHW Trend Analysis ➞ | |
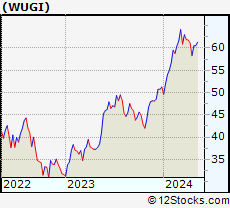 | WUGI Esoterica NextG Economy ETF |
| Sector: Financials | |
| SubSector: Exchange Traded Fund | |
| MarketCap: 60157 Millions | |
| Recent Price: 58.70 Smart Investing & Trading Score: 26 | |
| Day Percent Change: -0.66% Day Change: -0.39 | |
| Week Change: -3.99% Year-to-date Change: 14.5% | |
| WUGI Links: Profile News Message Board | |
| Charts:- Daily , Weekly | |
| Add WUGI to Watchlist: View: Get Complete WUGI Trend Analysis ➞ | |
 | STHO Star Holdings |
| Sector: Financials | |
| SubSector: Financials Services | |
| MarketCap: 195 Millions | |
| Recent Price: 11.68 Smart Investing & Trading Score: 61 | |
| Day Percent Change: 0.04% Day Change: 0.01 | |
| Week Change: -3.99% Year-to-date Change: -22.1% | |
| STHO Links: Profile News Message Board | |
| Charts:- Daily , Weekly | |
| Add STHO to Watchlist: View: Get Complete STHO Trend Analysis ➞ | |
 | AGO Assured Guaranty Ltd. |
| Sector: Financials | |
| SubSector: Surety & Title Insurance | |
| MarketCap: 2133.18 Millions | |
| Recent Price: 76.26 Smart Investing & Trading Score: 10 | |
| Day Percent Change: -1.09% Day Change: -0.84 | |
| Week Change: -4% Year-to-date Change: 1.9% | |
| AGO Links: Profile News Message Board | |
| Charts:- Daily , Weekly | |
| Add AGO to Watchlist: View: Get Complete AGO Trend Analysis ➞ | |
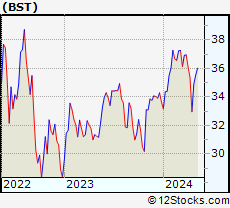 | BST BlackRock Science and Technology Trust |
| Sector: Financials | |
| SubSector: Closed-End Fund - Equity | |
| MarketCap: 552.347 Millions | |
| Recent Price: 33.96 Smart Investing & Trading Score: 10 | |
| Day Percent Change: -0.85% Day Change: -0.29 | |
| Week Change: -4.01% Year-to-date Change: 0.9% | |
| BST Links: Profile News Message Board | |
| Charts:- Daily , Weekly | |
| Add BST to Watchlist: View: Get Complete BST Trend Analysis ➞ | |
 | HBCP Home Bancorp, Inc. |
| Sector: Financials | |
| SubSector: Savings & Loans | |
| MarketCap: 206.83 Millions | |
| Recent Price: 33.30 Smart Investing & Trading Score: 10 | |
| Day Percent Change: -1.19% Day Change: -0.40 | |
| Week Change: -4.03% Year-to-date Change: -20.7% | |
| HBCP Links: Profile News Message Board | |
| Charts:- Daily , Weekly | |
| Add HBCP to Watchlist: View: Get Complete HBCP Trend Analysis ➞ | |
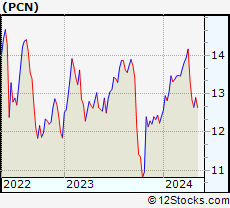 | PCN PIMCO Corporate & Income Strategy Fund |
| Sector: Financials | |
| SubSector: Closed-End Fund - Debt | |
| MarketCap: 442.607 Millions | |
| Recent Price: 12.83 Smart Investing & Trading Score: 10 | |
| Day Percent Change: 0.00% Day Change: 0.00 | |
| Week Change: -4.04% Year-to-date Change: 3.4% | |
| PCN Links: Profile News Message Board | |
| Charts:- Daily , Weekly | |
| Add PCN to Watchlist: View: Get Complete PCN Trend Analysis ➞ | |
 | KKR KKR & Co. Inc. |
| Sector: Financials | |
| SubSector: Asset Management | |
| MarketCap: 17722.5 Millions | |
| Recent Price: 93.35 Smart Investing & Trading Score: 44 | |
| Day Percent Change: -1.35% Day Change: -1.28 | |
| Week Change: -4.05% Year-to-date Change: 12.7% | |
| KKR Links: Profile News Message Board | |
| Charts:- Daily , Weekly | |
| Add KKR to Watchlist: View: Get Complete KKR Trend Analysis ➞ | |
 | DLR Digital Realty Trust, Inc. |
| Sector: Financials | |
| SubSector: REIT - Office | |
| MarketCap: 27038.6 Millions | |
| Recent Price: 136.66 Smart Investing & Trading Score: 17 | |
| Day Percent Change: 0.67% Day Change: 0.91 | |
| Week Change: -4.09% Year-to-date Change: 1.6% | |
| DLR Links: Profile News Message Board | |
| Charts:- Daily , Weekly | |
| Add DLR to Watchlist: View: Get Complete DLR Trend Analysis ➞ | |
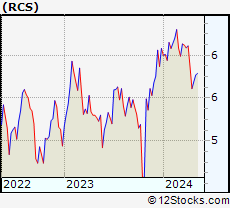 | RCS PIMCO Strategic Income Fund, Inc. |
| Sector: Financials | |
| SubSector: Closed-End Fund - Debt | |
| MarketCap: 246.607 Millions | |
| Recent Price: 5.63 Smart Investing & Trading Score: 10 | |
| Day Percent Change: -2.60% Day Change: -0.15 | |
| Week Change: -4.09% Year-to-date Change: -7.4% | |
| RCS Links: Profile News Message Board | |
| Charts:- Daily , Weekly | |
| Add RCS to Watchlist: View: Get Complete RCS Trend Analysis ➞ | |
 | MFA MFA Financial, Inc. |
| Sector: Financials | |
| SubSector: Mortgage Investment | |
| MarketCap: 1869.69 Millions | |
| Recent Price: 10.28 Smart Investing & Trading Score: 10 | |
| Day Percent Change: 0.29% Day Change: 0.03 | |
| Week Change: -4.1% Year-to-date Change: -8.8% | |
| MFA Links: Profile News Message Board | |
| Charts:- Daily , Weekly | |
| Add MFA to Watchlist: View: Get Complete MFA Trend Analysis ➞ | |
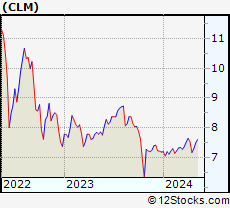 | CLM Cornerstone Strategic Value Fund, Inc. |
| Sector: Financials | |
| SubSector: Asset Management | |
| MarketCap: 512.703 Millions | |
| Recent Price: 7.23 Smart Investing & Trading Score: 61 | |
| Day Percent Change: 0.70% Day Change: 0.05 | |
| Week Change: -4.11% Year-to-date Change: 0.6% | |
| CLM Links: Profile News Message Board | |
| Charts:- Daily , Weekly | |
| Add CLM to Watchlist: View: Get Complete CLM Trend Analysis ➞ | |
| For tabular summary view of above stock list: Summary View ➞ 0 - 25 , 25 - 50 , 50 - 75 , 75 - 100 , 100 - 125 , 125 - 150 , 150 - 175 , 175 - 200 , 200 - 225 , 225 - 250 , 250 - 275 , 275 - 300 , 300 - 325 , 325 - 350 , 350 - 375 , 375 - 400 , 400 - 425 , 425 - 450 , 450 - 475 , 475 - 500 , 500 - 525 , 525 - 550 , 550 - 575 , 575 - 600 , 600 - 625 , 625 - 650 , 650 - 675 , 675 - 700 , 700 - 725 , 725 - 750 , 750 - 775 , 775 - 800 , 800 - 825 , 825 - 850 , 850 - 875 , 875 - 900 , 900 - 925 , 925 - 950 , 950 - 975 , 975 - 1000 , 1000 - 1025 , 1025 - 1050 , 1050 - 1075 , 1075 - 1100 , 1100 - 1125 , 1125 - 1150 , 1150 - 1175 , 1175 - 1200 , 1200 - 1225 , 1225 - 1250 | ||
| Click To Change The Sort Order: By Market Cap or Company Size Performance: Year-to-date, Week and Day | |
| Select Chart Type: | ||
|
Best Stocks Today 12Stocks.com |
© 2024 12Stocks.com Terms & Conditions Privacy Contact Us
All Information Provided Only For Education And Not To Be Used For Investing or Trading. See Terms & Conditions


One More Thing ... Get Best Stocks Delivered Daily!
Never Ever Miss A Move With Our Top Ten Stocks Lists
Find Best Stocks In Any Market - Bull or Bear Market
Take A Peek At Our Top Ten Stocks Lists: Daily, Weekly, Year-to-Date & Top Trends
Find Best Stocks In Any Market - Bull or Bear Market
Take A Peek At Our Top Ten Stocks Lists: Daily, Weekly, Year-to-Date & Top Trends
Financial Stocks With Best Up Trends [0-bearish to 100-bullish]: Medical Properties[100], Macatawa Bank[100], Stellus Capital[100], Regional Management[100], Kernel [95], HDFC Bank[93], Charles Schwab[93], Fidus [93], BlackRock MuniYield[93], Old Second[93], Wells Fargo[90]
Best Financial Stocks Year-to-Date:
Root [389.97%], Hippo [128.32%], Gladstone Capital[93.22%], Banco Macro[68.33%], Grupo Financiero[62.41%], Yiren Digital[55.45%], Fidelis Insurance[53.3%], First [51.11%], Banco BBVA[48.35%], EverQuote [48.28%], Heritage Insurance[45.55%] Best Financial Stocks This Week:
Macatawa Bank[44.53%], Medical Properties[25.06%], Globe Life[10%], James River[8.87%], GoHealth [7.45%], Victory Capital[6.86%], Huize Holding[6.65%], LCNB [5.7%], Bancorp [5.53%], Green Dot[5.25%], ESSA Bancorp[4.85%] Best Financial Stocks Daily:
Cipher Mining[8.65%], Oportun [8.45%], Ally [6.73%], eHealth [6.11%], Coinbase Global[5.90%], James River[5.62%], Tejon Ranch[5.44%], C&F [5.02%], Bank OZK[4.73%], Medical Properties[4.61%], Claros Mortgage[4.52%]